
Fig. 1.
Difference in biochemical parameters on day 0 & day 5 of – paired t-test / Wilcoxon signed-rank test – in non-survivors
| Parameters | Day 0 | Day 5 | p-value |
|---|---|---|---|
| Total cholesterol (mg/dL) | 114.14±41.15 | 110±38.95 | 0.654 |
| 111(70–149) | 115 (76–143) | ||
| Triglycerides (mg/dL) | 152.38±66.18 | 178.33±93.79 | 0.139 |
| HDL - Cholesterol (mg/dL) | 22.76±11.67 | 16.67±8.27 | 0.019* |
| LDL - Cholesterol (mg/dL) | 61.81±32.76 | 57.57±29.77 | 0.499 |
| Non-HDL - Cholesterol (mg/dL) | 91.38±38.82 | 93.86±37.32 | 0.753 |
| Procalcitonin (ng/mL) | 15.53 (4.4–41.75) | 7.0 (2.4–17.07) | 0.11 |
| APACHE II | 23 (17.5–26.0) | 28 (24–30) | 0* |
Baseline characteristics of the study participants
| Parameters | Number of Patients (n = 80) |
|---|---|
| Total number of cases | 80 |
| Male: Female | 56:24 |
| Males (70%); Females (30%) | |
| Discharged (Survivors) | 59 (74%) |
| Deceased (Non-Survivors) | 21 (26%) |
| Parameters | Median (Interquartile Range) |
| Age (in years) | 57 (45–66) |
| Number of Days in ICU | 13 (8–17) |
| Diagnosis | Number of Patients (%) |
| CAD | 16 (20%) |
| Necrotizing Fasciitis | 7 (9%) |
| GIT & Liver disease | 2 (2.5%) |
| Renal disease (Pyelonephritis) | 8 (10%) |
| Trauma | 12 (15%) |
| DM Complications (No statin therapy) | 2 (2.5%) |
| Respiratory diseases | 12 (15%) |
| Others | 21 (26%) |
Difference in biochemical parameters on day 0 & day 5 of admission – paired t-test / Wilcoxon signed-rank test – in survivors
| Parameters | Day 0 | Day 5 | p-value |
|---|---|---|---|
| Total cholesterol (mg/dL) | 108.29±37.29 | 123.59±39.30 | 0.005* |
| Triglycerides (mg/dL) | 159 (107–212) | 148 (115–230) | 0.339 |
| HDL - Cholesterol (mg/dL) | 25.25±12.41 | 23.88±10.19 | 0.315 |
| LDL - Cholesterol (mg/dL) | 53.27±30.05 | 65.97±33.25 | 0.008* |
| Non-HDL - Cholesterol (mg/dL) | 86.78±35.16 | 99.71±39.27 | 0.014* |
| Procalcitonin (ng/mL) | 13.42 (5.77–33.18) | 3.32 (1.27–11.86) | 0* |
| APACHE II | 16 (12–21) | 16 (14–20) | 0.183 |
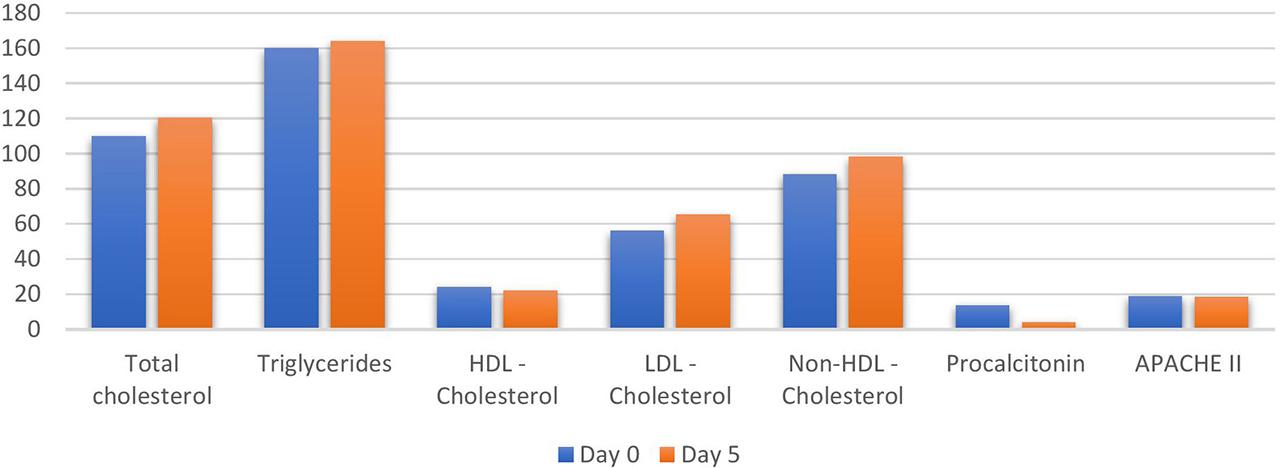
Difference in biochemical parameters on day 0 & day 5 of admission – paired t-test / Wilcoxon signed-rank test – both survivors & non-survivors
| Parameters | Day 0 | Day 5 | p-value |
|---|---|---|---|
| Total cholesterol (mg/dL) | 109.83±38.17 | 120.16±39.39 | 0.024* |
| Triglycerides (mg/dL) | 157 (104–208) | 164 (114–225) | 0.135 |
| HDL - Cholesterol (mg/dL) | 24.60±12.19 | 21.99±10.19 | 0.032* |
| LDL - Cholesterol (mg/dL) | 55.51±30.81 | 63.76±32.40 | 0.034* |
| Non-HDL - Cholesterol (mg/dL) | 87.99±35.96 | 98.18±38.62 | 0.020* |
| Procalcitonin (ng/mL) | 13.7 (5.04–38.21) | 4 (1.45–13.43) | 0* |
| APACHE II | 17 (14–25) | 17 (13–23) | 0.001* |
Difference in biochemical parameters between survivors & non-survivors on day 5 of admission – unpaired t-test / Mann Whitney U test
| Parameters | Survivors | Non-Survivors | p-value |
|---|---|---|---|
| Total cholesterol (mg/dL) | 123.59±39.304 | 110.52±38.947 | 0.193 |
| Triglycerides (mg/dL) | 148 (115–230) | 176 (101–223) | 0.810 |
| HDL - Cholesterol (mg/dL) | 23.88±10.190 | 16.67±8.272 | 0.005* |
| LDL - Cholesterol (mg/dL) | 65.97±33.254 | 57.57±29.772 | 0.311 |
| Non-HDL - Cholesterol (mg/dL) | 99.71±29.275 | 93.86±37.317 | 0.554 |
| Procalcitonin (ng/mL) | 3.32 (1.27–11.86) | 7.0 (2.4–17.07) | 0.170 |
| APACHE II | 16 (14–20) | 28 (24–30) | 0* |