
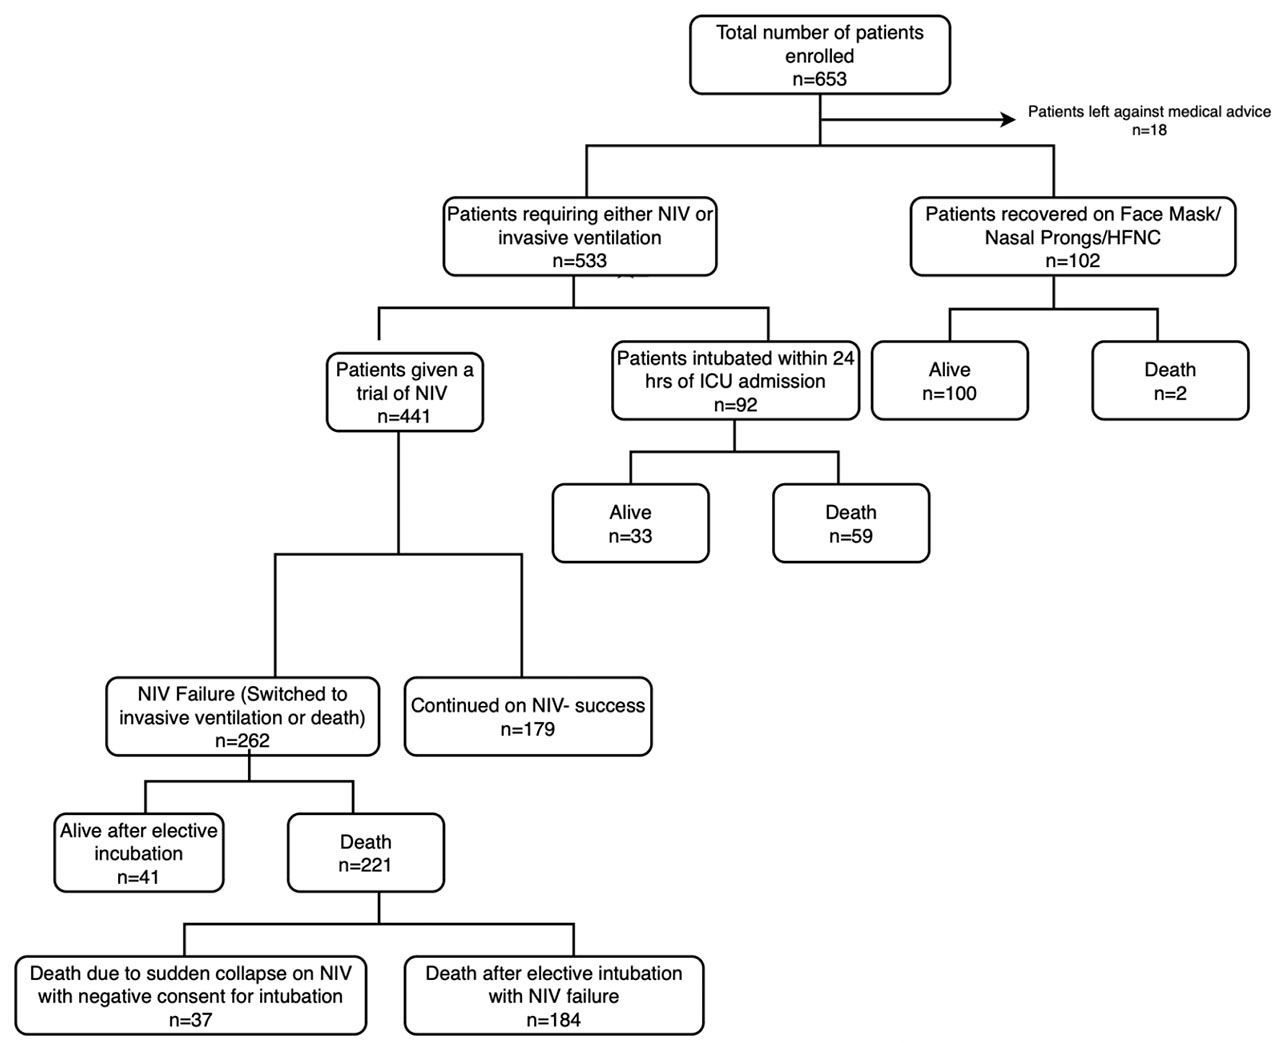
Fig. 1.
Study flow chart
Table 1.
Comparison of Demographic, Severity of illness, Inflammatory markers between NIV success vs Failure patients
| Total | NIV Success (n=179) | NIV failure (n=262) | p value | |
|---|---|---|---|---|
| Age | 60 (19–90) | 54(53–58) | 62(61–64) | <0.001 |
| M:F | 311:130 | 126:53 | 185:77 | 0.960 |
| DM | 241(54.6%) | 106(59.2%) | 135(56%) | 0.111 |
| HTN | 268(60.8%) | 103(57.5%) | 165(63%) | 0.251 |
| CAD | 64 (14.5%) | 22(12.3%) | 42(16%) | 0.274 |
| CKD | 24(5.4%) | 7(3.9%) | 17(6.5%) | 0.241 |
| COAD | 22(5%) | 8(4.5%) | 14(5.3%) | 0.629 |
| Symptom-admission duration (days) | 7 (0–14) | 3(0–8) | 4(1–14) | 0.783 |
| Baseline P/F ratio | 125(56–280) | 145(140–156) | 117(110–121) | <0.001 |
| ARDS category | <0.001 | |||
| Mild | 32 (7.3%) | 18(56.3%) | 14(43.8%) | |
| Moderate | 282 (63.4%) | 136(48.2%) | 146(51.8%) | |
| Severe | 127(28.8%) | 25(19.7%) | 80.3% | |
| Remedesivir | 286 (64.9%) | 117(65.4%) | 169(64.5%) | 0.853 |
| TCZ | 23 (5.2%) | 11(6.1%) | 12(4.6%) | 0.468 |
| Vasopressors | 172(39%) | 2(1.1%) | 170(64.9%) | <0.001 |
| Steroid | <0.001 | |||
| Early High | 283 (64.2%) | 126(70.4%) | 157(59.9%) | |
| Early low | 113 (25.6%) | 50(27.91%) | 63(14.3%) | |
| Indeterminate | 45 (10.2%) | 3 (1.7%) | 42(9.5%) | |
| BSI | ||||
| NG | 351(79.6%) | 164(91.6%) | 187(71.4%) | <0.001 |
| Gram neg | 56(12.7%) | 9(5%) | 47(17.9%) | |
| Positive | 14 (3.2%) | 3(1.7%) | 11(4.2%) | |
| Fungal | 20(4.5%) | 3(1.7%) | 17(6.5%) | |
| Shock | 134 (30.4%) | 1(0.6%) | 133(50.8%) | <0.001 |
| AKI | 109(24.7%0 | 8(4.5%) | 101(38.5%) | <0.001 |
| SOFA | 4(2–14) | 3(3–4) | 6(6–7) | 0.0001 |
| Baseline CRP | 101(1.98–870) | 75(68–98.70) | 116.20(98–135) | 0.006 |
| Baseline ALC | 760(120–3640) | 860(760–920) | 720(650–780) | <0.001 |
| ICU LOS | 9(1–90) | 7(7–8) | 11(10–13) | <0.001 |
| Hospital LOS | 14(1–95) | 14(12–16) | 14(13–15) | 0.349 |
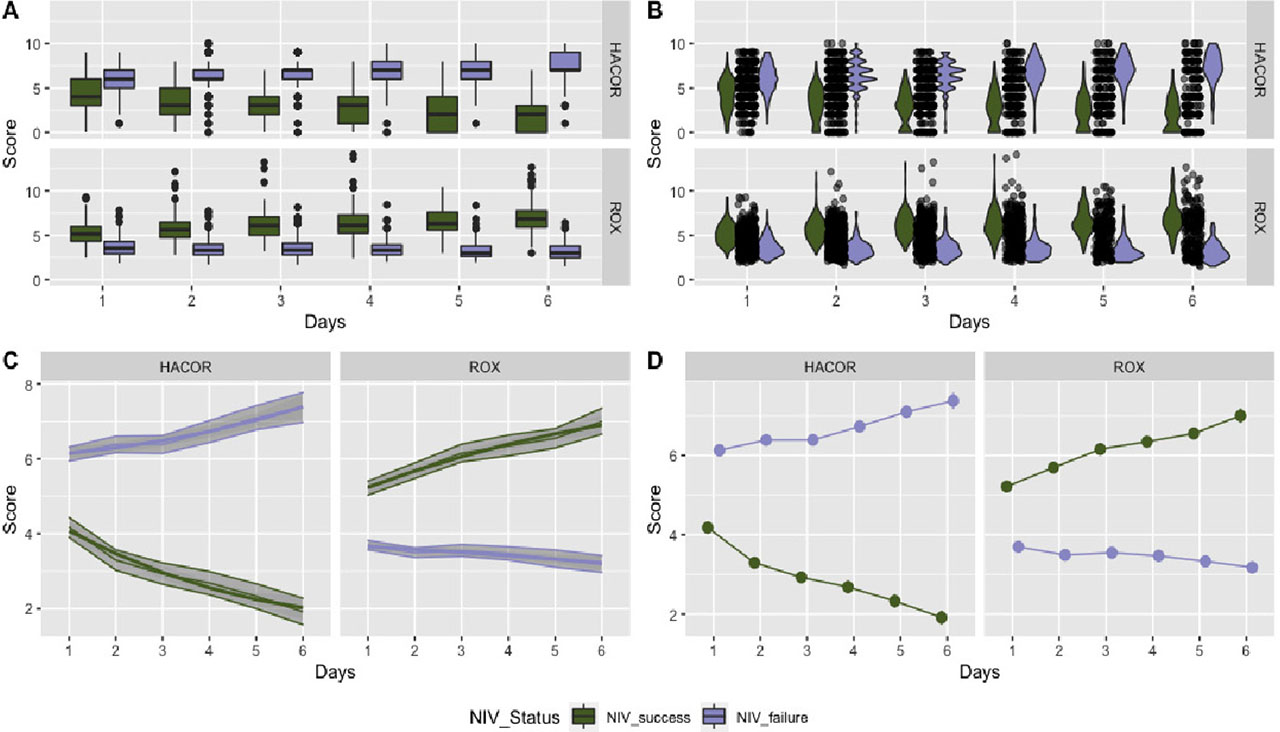
Fig. 2.
Patterns of ROX index and HACOR from day 1 to day 6
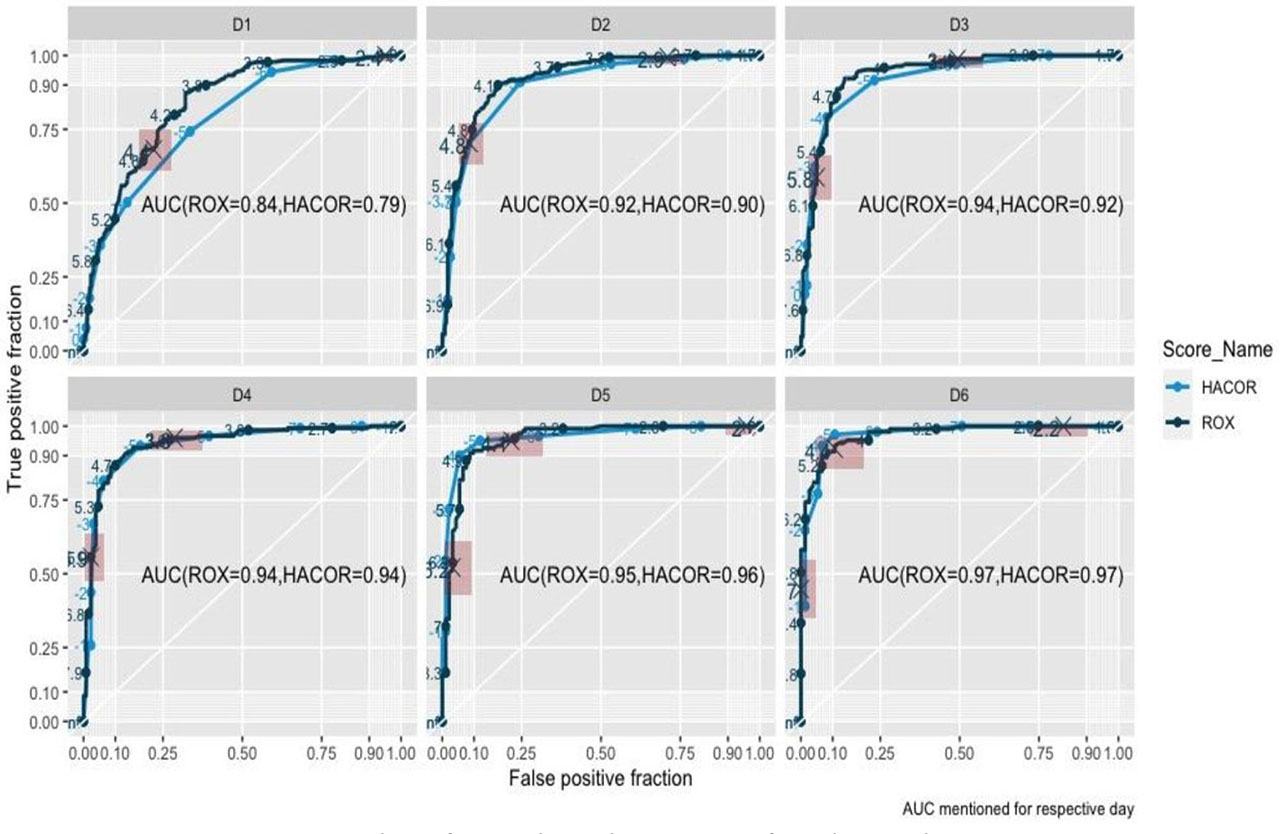
Fig. 3.
Receiver operating curve analysis of ROX-index and HACOR score from day 1 to day 6
Table 2.
Ventilatory parameter comparison- HACOR/ROX
| Total | Success (n=175) | Failure (n=262) | Univariate analysis OR (CI) | |
|---|---|---|---|---|
| HACOR D1 | 5(0–9) | 4(4–5) | 6(6–7) | 1.963(1.696–2.273) |
| ROX D1 | 4.13(1.9–9.27) | 5.14(4.9–5.3) | 3.53(3.33–3.68) | 0.309(0.245–0.389) |
| HACOR D2 | 5(0–10) | 3(3–4) | 6(6–7) | 2.735(2.250–3.325) |
| ROX D2 | 4.1(1.7–12.15) | 5.62(5.36–5.85) | 3.32(3.16–3.50) | 0.194(0.143–0.262) |
| HACOR D3 | 5(0–9) | 3(3–4) | 7(7–8) | 3.064(2.435–3.857) |
| ROX D3 | 4.5(1.68–13.22) | 6.06(5.85–6.27) | 3.3(3.13–3.50) | 0.186(0.131–0.263) |
| HACOR D4 | 5(0–10) | 3(3–4) | 7(7–8) | 3.119(2.416–4.027) |
| ROX D4 | 2.7(2–14.1) | 6.08(5.83–6.50) | 3.29(3.10–3.57) | 0.182(0.125–0.266) |
| HACOR D5 | 4.0(0–10) | 2(2–3) | 7(7–8) | 3.745(2.647–5.300) |
| ROX D5 | 5.2(1.95–10.47) | 6.3(6.15–6.6) | 2.95(2.8–3.20) | 0.182(0.119–0.279) |
| HACOR D6 | 4 (0–10) | 2.0(2–3) | 7.5(7–8) | 3.536(2.442–5.119) |
| ROX D6 | 5.4(1.5–12.65) | 6.84(6.35–7.14) | 2.89(2.66–3.20) | 0.159(0.093–0.272) |
| No of days with HACOR>5 | 2(0–18) | 1(1–2) | 3(3–4) | 1.87(1.58–2.09) |
Table 3.
Multivariable models for NIV failure. The models were created on 327 participants having complete information about all covariates. The model diagnostics indicate the substantial reduction in error variances after theory driven sequential sections of variables
| Predictors | Ref. Category. NIV_Success Odds Ratios CI p | ||||||||||||||
|---|---|---|---|---|---|---|---|---|---|---|---|---|---|---|---|
| OR | CI | p | OR | CI | p | OR | Cl | p | OR | CI | p | OR | CI | p | |
| R0X>4.47 | 0.19 | 0.13–26 | <0.001 | 0,18 | 0.12–0.25 | <0.001 | 0,18 | 0.12–0.25 | <0.001 | 0,17 | 0.11–0.25 | <0.001 | 0,15 | 0.09–0.23 | <0.001 |
| Age>60Yrs | 5, | 2.47–11.83 | <0.001 | 5, | 238–11.74 | <0.001 | 5, | 230–1158 | <0.001 | 4, | 1.66–10.18 | 0,003 | |||
| GenderF | 0,64 | 0.29–1.41 | 0,271 | 59 | 0.26–1.33 | 0,208 | 0,65 | 0.28–1.47 | 0,300 | 37 | 0.13–1.00 | 57 | |||
| Diabetes+ | 0,61 | 0.29-1.27 | 0,184 | 59 | 0.28–1.25 | 0,170 | 59 | 0.27–1.26 | 0,176 | 55 | 023–1.30 | 0,175 | |||
| Illness_ICU_IntervalT2(Int) | 0,72 | 0.29–1.72 | 0,456 | 0,76 | 031–1.86 | 355 | 0,77 | 0.27–2.15 | 0,617 | ||||||
| Illness_ICU_IntervalT3(High) | 2, | 0.87–5.25 | 0,100 | 222 | 0.90–5.62 | 0,086 | 3, | 1.16–9.26 | 0,027 | ||||||
| ALCDI_Tertile2(Int) | 0,45 | 0.17–1.11 | 87 | 0,87 | 0.29–258 | 0,796 | |||||||||
| ALCDI_Tertile3(High) | 0,43 | 0.16–1.07 | 0,071 | 0,75 | 0.26–2.16 | 585 | |||||||||
| SOFA Score | 2, | 1.60–2.71 | <0.001 | ||||||||||||
| Observations | 327 | 327 | 327 | 327 | 327 | ||||||||||
| R2 Tjur | 393 | 0,636 | 0,646 | 0,654 | 0,729 | ||||||||||
| AIC | 224, | 209, | 207, | 206582 | 169, | ||||||||||
| log-Likelihood | −110213 | −99334 | −96387 | −94291 | −74, | ||||||||||
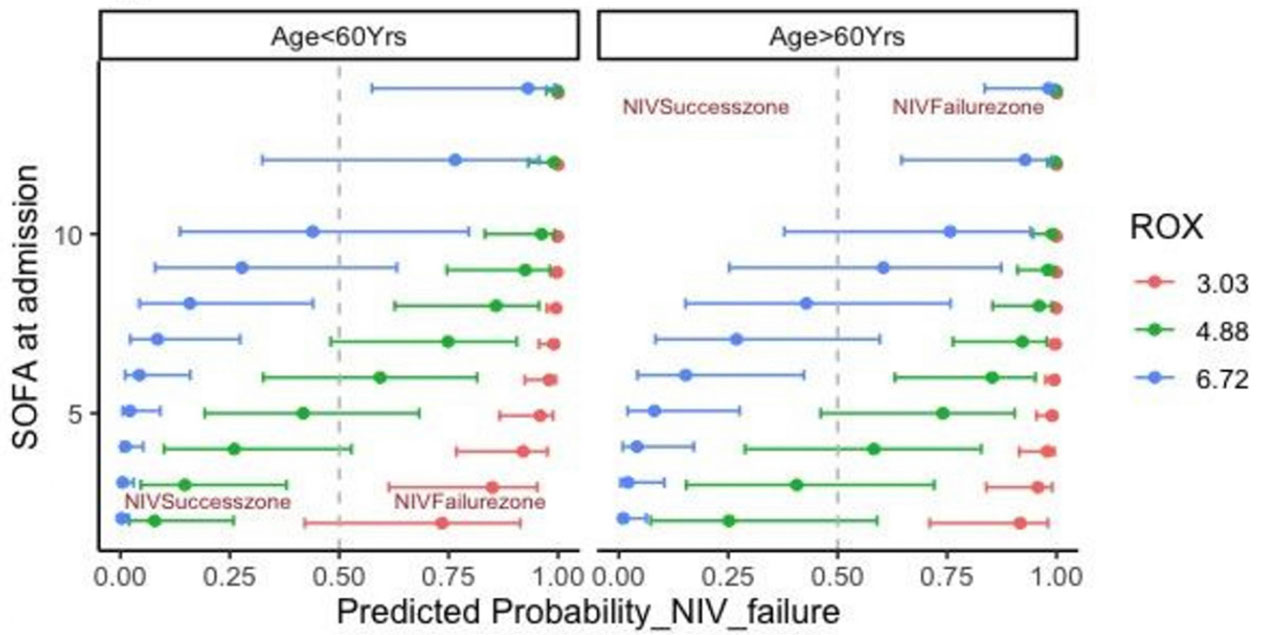
Fig. 4.
Age, SOFA, ROX score interaction
Table 4:
Summary of studies depicting NIV failure
| Reference, Year (Country) | Setting | Modes | NIRS failure definition | HACOR score in Failure | ROX Score in Failure | NIRS Failure | Mortality | Predictors of Failure |
|---|---|---|---|---|---|---|---|---|
| Duan et al. 2021 (China)19 | ICU (non-COPD) | NIV | Need of IMV as rescue therapy | 7 (at initiation) 5 (at 1–2 hours) | 14.7 % | 9.4 % | HACOR score, Duration of NIV, Heart rate, pH, GCS, Mean Arterial BP, P/F ratio, PaCO2 | |
| Guia et al. 2021 (Italy, Portugal, USA)15 | ICU (COVID) | NIV (CPAP) | Need of IMV as rescue therapy and Death | 5 | 27.3 % | 23 % | HACOR score, Age, P/F ratio | |
| Valencia et al. 2021 (Colombia)13 | Emergency Department | HFNC (COVID) | Need of IMV as rescue therapy and Death | 7.14 ±3.6 | 5.61 ±4.1 | 62.0 % | 29.3 % | HACOR score, GCS, ROX index, Heart Rate, Respiratory Rate, PaCO2, SaO2, pH, PaO2, P/F ratio, Chronic Kidney Disease, Co-Infections |
| Jog S et al. 2021 (India)20 | ICU (COVID) | NIV/HFNC | Need of IMV as rescue therapy and Death | 64.1 % | 56.9 % | Age, Medical Comorbidities, Admission SpO2, Non-Respiratory organ dysfunction | ||
| Prakash J et al. 2021 (Meta-analysis)16 | ICU (COVID) | HFNC | 5 (24 hr) | ROX score | ||||
| Prakash J et al. 2021 (Meta-analysis)16 | ICU (COVID) | HFNC | 5 (24 hr) | ROX score | ||||
| Khan MS et al., 2022 (India)21 | ICU (COVID) | HFNC | Need of NIV or IMV as rescue therapy | 3.4 ± 0.4 (1 hr) 4.4 ± 0.9 (6 hr) | 28.9 % | 27.1 % (28-day) | Age, APACHE ll, SOFA, Lag time to HFNC, Duration of HFNC, ICU LOS, PF ratio, ROX index, D-dimer, IL-6, RBS, Admission SpO2 | |
| Santus et al. 2022 (Italy)14 | HDU (COVID) | CPAP (Helmet) | Need of IMV as rescue therapy, Transfer to ICU and Death | 5 (1 hr) | 6.2 (4.7–7.7) (1hr) mROX 5.8 (3.8–8.9) (1 hr) | 38.4 % | 12.4 % | Age, Ischaemic Heart Disease, COPD, CPAP duration, Hospital LOS, WBC count, D-dimer, CRP, PEEP, FiO2, PF ratio, Respiratory rate, A-a O2 gradient, GCS, ROX index, mROX index, HACOR score PaCO2, |
| Chacko et al. 2022 (India)18 | ICU (COVID) | NIV | Need of IMV as rescue therapy or Death | 36.4 % | 30.1 % | Age, Disease Severity, Admission PF ratio, Respiratory Rate, High CK-MB, Need for organ support, Duration of continuous NIV, ICU LOS and hospital LOS |