
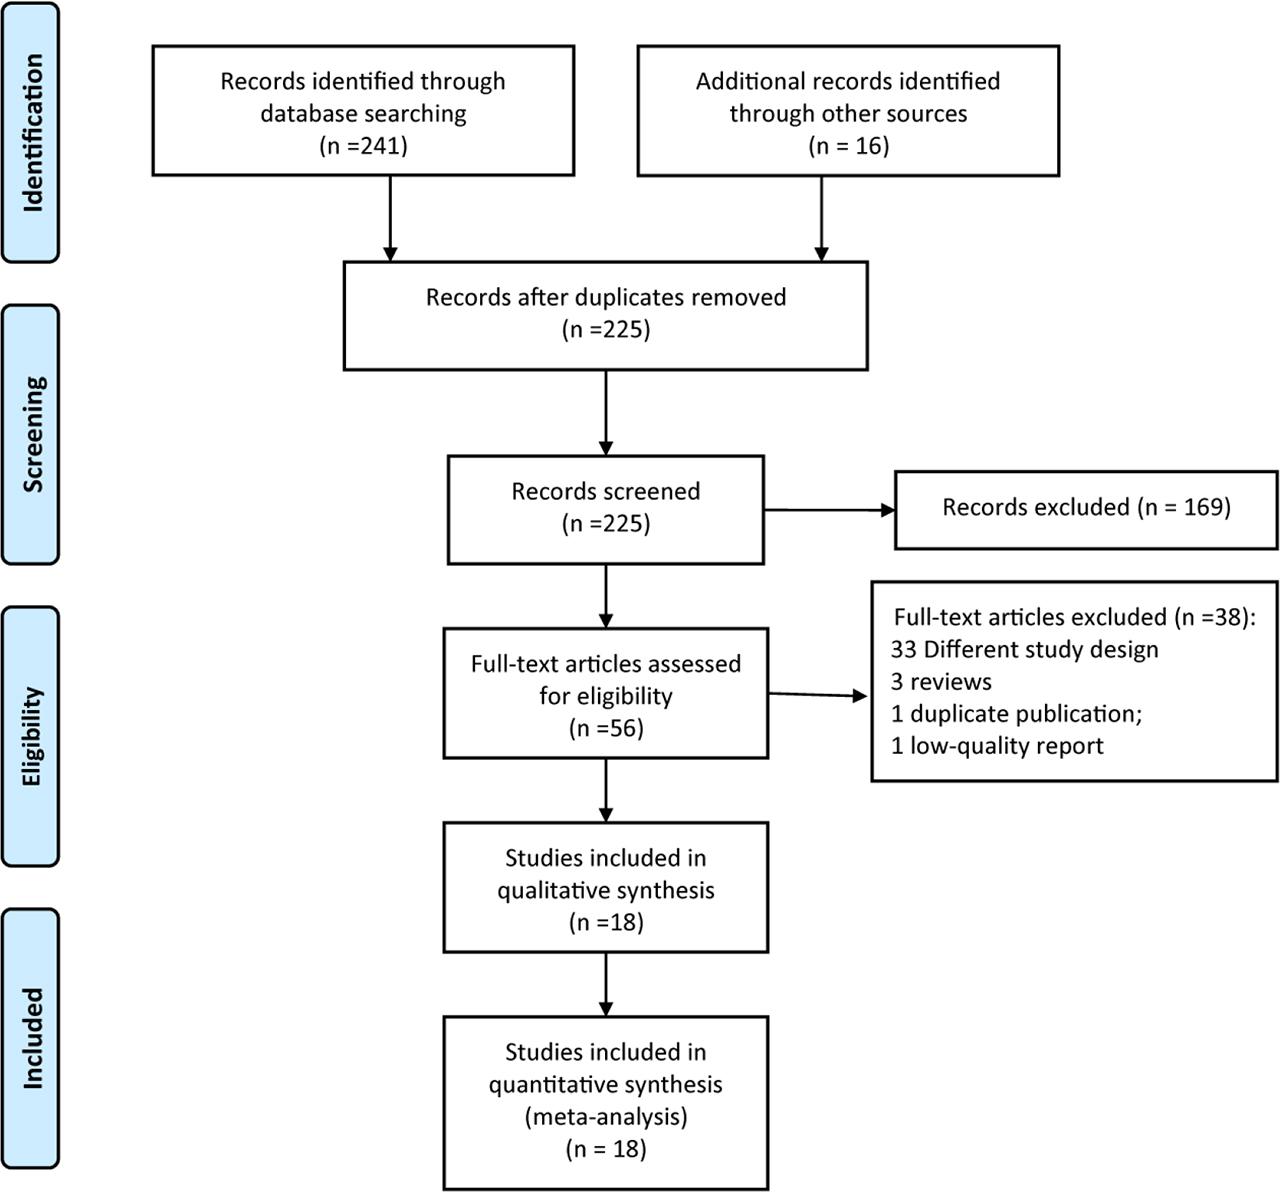
Fig. 1.
Egger’s test results for detecting publication bias of included studies
| Factors | Egger’s test | |
|---|---|---|
| t | P | |
| Age < 2 years old | 1.88 | 0.209 |
| Age > 60 years old | 2.47 | 0.113 |
| APACHE II score ≥ 20 | 1.14 | 0.265 |
| Hyperglycemia | −1.32 | 0.179 |
| Hypokalemia | 5.30 | 0.013 |
| Hypoproteinemia | −0.56 | 0.612 |
| Starting time of enteral nutrition > 72 hours | −1.88 | 0.312 |
| No dietary fiber | 1.89 | 0.131 |
| Intra-abdominal pressure > 15mmhg | 1.18 | 0.965 |
| Central venous pressure > 10cmh2o | 3.54 | 0.971 |
| Mechanical ventilation | 2.08 | 0.331 |
| Use of sedatives | −0.22 | 0.832 |
| Use of vasoactive drugs | −0.14 | 0.910 |
| Use of acidogenic agents | 10.58 | 0.060 |
| Blood purification | −0.16 | 0.572 |
The characteristics of included studies
| Study | Design | Sample size | Case/control | Incidence of feeding intolerance | Influencing factors |
|---|---|---|---|---|---|
| Bejarano 2012 | Cohort study | 82 | 21/51 | 29.17% | 2, 6, 12 |
| Chen 2017 | Case control study | 92 | 54/38 | 58.69% | 2, 4, 6, 7, 8, 9, 11, 12, 13 |
| Cai 2018 | Case control study | 373 | 155/218 | 41.55% | 1, 3, 7, 8, 10, 12, 13, 14 |
| Sun 2018 | Case control study | 295 | 121/174 | 41.02% | 3, 6, 9, 10, 12, 15, 16 |
| Liu 2018 | Case control study | 86 | 52/34 | 60.47% | 3, 4, 5, 7, 10, 13 |
| Jin 2018 | Case control study | 243 | 84/159 | 34.57% | 1, 3, 6, 7, 8, 9, 10, 11, 12, 13, 15 |
| Wang 2019 | Case control study | 118 | 49/69 | 41.53% | 3, 4, 5, 9, 11 |
| Zhou 2019 | Case control study | 84 | 33/51 | 39.29% | 3, 4, 6, 9, 11, 13, 16 |
| Liu 2020 | Case control study | 200 | 115/85 | 57.50% | 1, 7, 9, 10 |
| Deng 2020 | Case control study | 120 | 68/52 | 56.67% | 3, 12, 13 |
| Zhai 2020 | Case control study | 91 | 49/42 | 53.85% | 3, 4, 5, 6, 9, 10, 12, 13, 14 |
| Li 2019 | Case control study | 568 | 184/384 | 32.39% | 3, 6, 16 |
| Mentec 2001 | Cohort study | 153 | 59/94 | 38.56% | 3, 4, 5, 13, 15 |
| Gungabissoon 2014 | Cohort study | 1888 | 576/1312 | 30.51% | 4, 6, 9 |
| Li 2021 | Case control study | 70 | 29/41 | 41.43% | 1, 4, 5, 6, 10 |
| Geng 2022 | Case control study | 884 | 352/532 | 39.82% | 1, 6, 7, 9, 12 |
| Zhang 2022 | Cohort study | 83 | 36/47 | 43.37% | 2, 4, 5, 8, 10, 13 |
| Zheng 2021 | Case control study | 134 | 56/78 | 41.79% | 2, 5, 7, 9 |
The meta-analysis on the risk factors of feeding intolerance in critically ill patients undergoing enteral nutrition
| Factors | Number of synthesized studies | Heterogeneity | Model | Synthesized effects | |||
|---|---|---|---|---|---|---|---|
| I2(%) | P | OR | 95%CI | P | |||
| Age < 2 years old | 2 | 16 | 0.44 | Fixed | 1.84 | 1.32~2.05 | 0.015 |
| Age > 60 years old | 4 | 0 | 0.75 | Fixed | 2.04 | 1.45~2.61 | 0.007 |
| APACHE II score ≥ 20 | 6 | 11 | 0.18 | Fixed | 3.18 | 2.95~3.89 | 0.033 |
| Hyperglycemia | 4 | 59 | 0.03 | Random | 1.70 | 0.88~2.46 | 0.069 |
| Hypokalemia | 5 | 47 | 0.11 | Fixed | 1.59 | 1.24~2.03 | <0.001 |
| Hypoproteinemia | 5 | 89 | <0.01 | Random | 0.70 | 0.26~1.90 | 0.486 |
| Starting time of enteral nutrition > 72 hours | 3 | 0 | 0.87 | Fixed | 2.24 | 1.49~3.36 | <0.001 |
| No dietary fiber | 8 | 68 | 0.01 | Random | 3.72 | 2.23~6.19 | <0.001 |
| Intra-abdominal pressure > 15mmhg | 7 | 0 | 0.51 | Fixed | 2.95 | 2.10~3.85 | <0.001 |
| Central venous pressure > 10cmh2o | 4 | 45 | 0.15 | Fixed | 1.96 | 1.47~2.62 | <0.001 |
| Mechanical ventilation | 9 | 44 | 0.23 | Fixed | 1.37 | 1.19~1.89 | 0.012 |
| Use of sedatives | 7 | 74 | <0.01 | Random | 1.19 | 0.93~1.53 | 0.161 |
| Use of vasoactive drugs | 3 | 89 | <0.01 | Random | 0.95 | 0.56~1.61 | 0.854 |
| Use of acidogenic agents | 3 | 0 | 0.41 | Fixed | 0.84 | 0.52~1.38 | 0.506 |
| Blood purification | 4 | 97 | <0.01 | Random | 1.41 | 0.86~2.30 | 0.171 |
The NOS score of included studies
| Study | Patient selection | Comparability | Exposure assessment | NOS total score |
|---|---|---|---|---|
| Bejarano 2012 | 3 | 2 | 2 | 7 |
| Chen 2017 | 3 | 2 | 2 | 7 |
| Cai 2018 | 3 | 2 | 2 | 7 |
| Sun 2018 | 3 | 2 | 3 | 8 |
| Liu 2018 | 3 | 2 | 2 | 7 |
| Jin 2018 | 3 | 2 | 2 | 7 |
| Wang 2019 | 3 | 2 | 3 | 8 |
| Zhou 2019 | 3 | 2 | 2 | 7 |
| Liu 2020 | 3 | 2 | 2 | 7 |
| Deng 2020 | 3 | 1 | 3 | 7 |
| Zhai 2020 | 3 | 2 | 2 | 7 |
| Li 2019 | 3 | 2 | 3 | 8 |
| Mentec 2001 | 3 | 2 | 2 | 7 |
| Gungabissoon 2014 | 3 | 2 | 2 | 7 |
| Li 2021 | 3 | 2 | 3 | 8 |
| Geng 2022 | 3 | 2 | 3 | 8 |
| Zhang 2022 | 3 | 2 | 3 | 8 |
| Zheng 2021 | 3 | 2 | 2 | 7 |