
Table 1.
Patient demographic and biological parameters and scores with comparison between those with sepsis and septic shock.
| Parameter | Total (n=76) | Urosepsis (n= 61) | Septic Shock (n=15) | p= |
|---|---|---|---|---|
| Age (years) | 63.4 ±15.1 | 61.7 ±15.7 | 70.3 ±10.2 | 0.015* |
| Sex (M/F) | 52/24 | 43/18 | 9/6 | 0.433# |
| SOFA score | 6.1 ± 3.2 | 5.3 ± 2.3 | 9.4 ± 2.9 | < 0.001* |
| NEWS | 9.8 ± 2.9 | 9.1 ± 2.3 | 12.6 ± 3.4 | 0.0013* |
| GCS | 12.4 ±1.7 | 12.7 ±1.6 | 11.2 ±1.7 | 0.005* |
| MAP (mmHg) | 80 ± 11 | 83 ± 9 | 67 ± 6 | < 0.001* |
| HR (beats/min) | 82 ± 18 | 78 ± 13 | 98 ± 28 | 0.019* |
| RR (breaths/min) | 23 ± 7 | 23 ± 7 | 23 ± 7 | 0.027* |
| WBC (×103/mm3) | 18 [15–22] | 17 [14–20] | 21 [19–23] | 0.412^ |
| NEU (×103/mm3) | 15 [13–18] | 14 [12–17] | 18 [15–19] | 0.313^ |
| LYM (×103/mm3) | 1.6 [1.2–2.1] | 1.6 [1.3–2.1] | 1.5 [1.2–1.8] | 0.596^ |
| NLR | 10.3 ± 3.2 | 9.8 ± 3.0 | 12.2 ± 3.4 | 0.023* |
| PLT (×103/mm3) | 133 ± 49 | 140 ± 50 | 108 ± 32 | 0.042* |
| C-Reactive Protein (mg/l) | 124 [92–145] | 124 [94–143] | 136 [79–153] | 0.697^ |
| Procalcitonin (PCT) (ng/ml) | 13.0 ±5.7 | 11.8 ±4.6 | 18.0 ±7.4 | 0.007* |
| ESR (mm/h) | 40.4 ±16.4 | 38.9 ±16.9 | 42.3 ±14.9 | 0.587* |
| Lactate (mmol/l) | 1.8 ± 1.4 | 1.6 ± 1.2 | 2.7 ± 1.8 | 0.039* |
| Creatinine (mg/dl) | 1.9 ± 1.3 | 1.9 ± 1.4 | 2.1 ± 1.1 | 0.619* |
| Bilirubin (mg/dl) | 1.8 ± 1.0 | 1.7 ± 1.0 | 2.2 ± 0.9 | 0.085* |
[i] SOFA - Sequential Organ Failure Assessment, NEWS - National Early Warning Score, GCS – Glasgow Coma Scale, MAP – mean arterial pressure, HR – heart rate, RR – respiratory rate, WBC – white blood cells, NEU – neutrophils, LYM – lymphocytes, NLR – neutrophil-to-lymphocyte ratio, PLT – platelet, ESR – erythrocyte sedimentation rate, Data presented as mean and standard deviation, ratio or median and inter-quartile range depending on data type and distribution
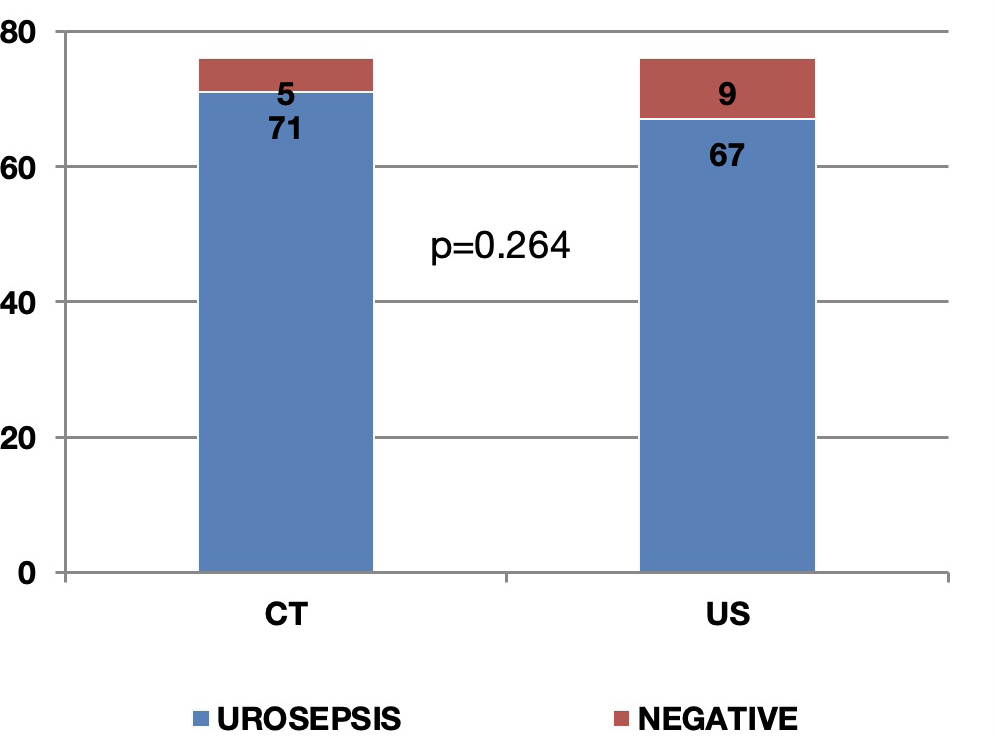
Fig. 1.
Comparison between computerised tomography (CT) and ultrasound evaluation (US) regarding the number of patients diagnosed with urosepsis shows the non-inferiority of US vs CT (RR=0.944, 95%CI = 0.852–1.045, p=0.264).
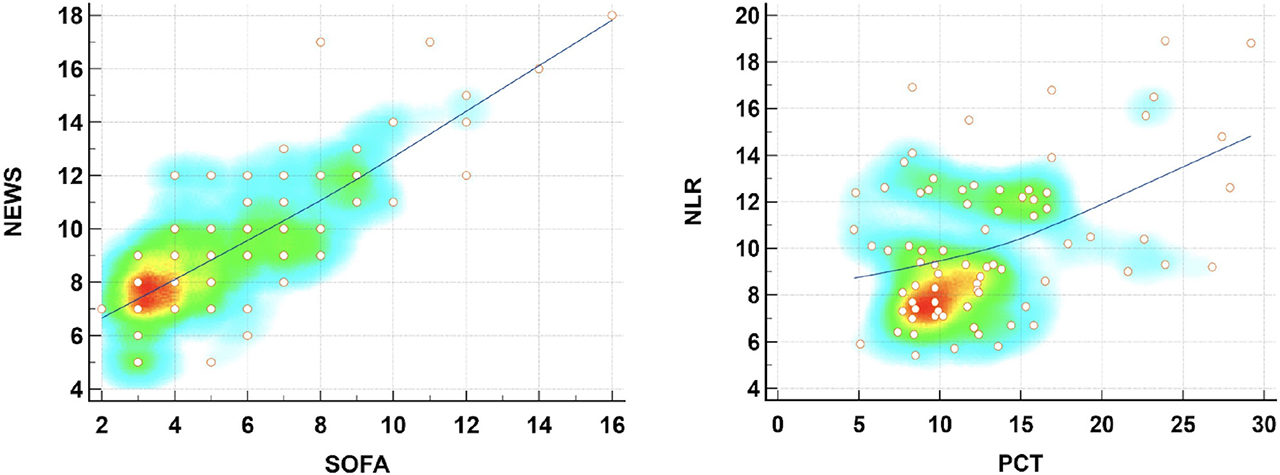
Fig. 2.
Correlation scatter graphs and heat-maps for the 2 prognostic scores (SOFA - Sequential Organ Failure Assessment and NEWS - National Early Warning Score, r = 0.793, 95%CI = 0.692 – 0.864, p < 0.0001) as well as the two important markers (PCT and NLR, r = 0.417, 95%CI = 0.211 – 0.587, p=0.0002) show strong and significant correlations.
Table 2.
Comparison of AUC values with standard error (SE), 95%CI of AUC, Sensitivity (Sn), Specificity (Sp), cut-off value and statistical significance (p) for all analysed parameters: SOFA - Sequential Organ Failure Assessment, NEWS - National Early Warning Score, PCT – procalcitonin, NLR - neutrophil-to-lymphocyte ratio, CRP – C-reactive protein.
| Variable | AUC | SE | 95% CI | Sn | Sp | Cut-off | p= |
|---|---|---|---|---|---|---|---|
| SOFA | 0.874 | 0.043 | 0.778 to 0.939 | 87% | 72% | 6 | <0.0001 |
| NEWS | 0.791 | 0.065 | 0.682 to 0.876 | 67% | 74% | 10 | <0.0001 |
| PCT | 0.743 | 0.080 | 0.629 to 0.836 | 67% | 74% | 13.6 | 0.0025 |
| NLR | 0.717 | 0.072 | 0.603 to 0.815 | 80% | 62% | 9.9 | 0.0023 |
| CRP | 0.543 | 0.099 | 0.425 to 0.658 | 67% | 59% | 127 | 0.664 |
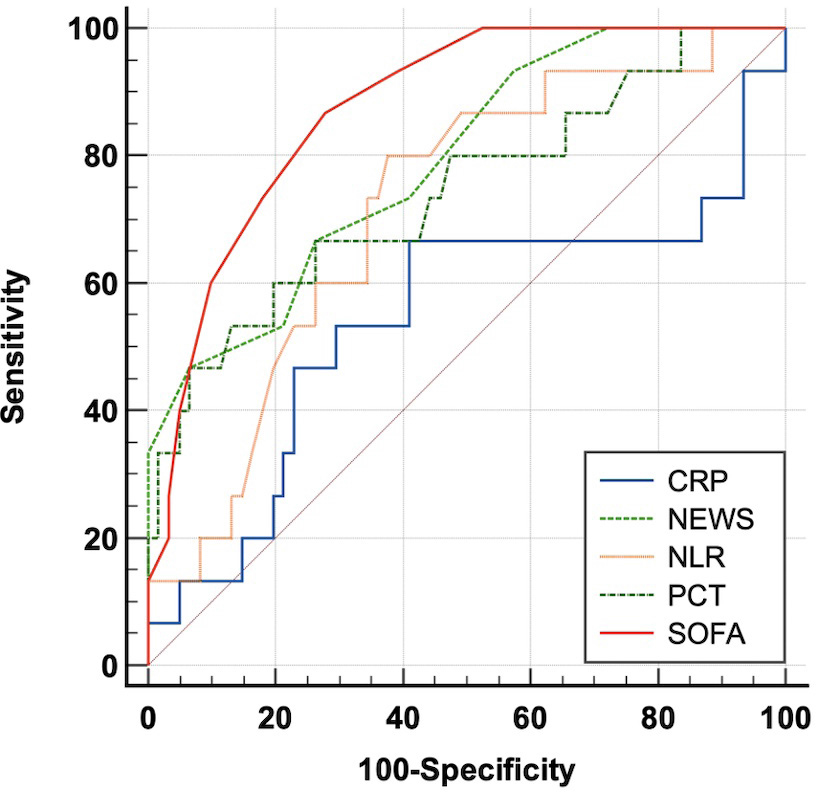
Fig. 3.
ROC curve comparison for all study parameters: SOFA, NEWS, PCT, NLR, CRP. (SOFA - Sequential Organ Failure Assessment, NEWS - National Early Warning Score, PCT – procalcitonin, NLR - neutrophil-to-lymphocyte ratio, CRP – C-reactive protein).