
Table 1.
Demographic, comorbid and top 10 acute conditions and outcome overall, survivors and non survivors of the patients admitted to Intermediate care medical units (N=923)
| Characteristic | N=923 (%) | Survivors N=864/923(%) | Non-survivors N=59/923 (%) | P-value |
|---|---|---|---|---|
| Age, Mean (SD), years | 62 | 61.2 | 63.6 | 0.86 |
| Age Groups | ||||
| Up to 20 years | 1.49% | 1.57% | 0 | |
| 20 – 40 years | 10.46% | 10.39% | 7.69% | |
| 40 – 60 years | 34.16% | 33.96% | 44.23% | |
| 60 – 80 years | 46.06% | 55.62% | 34.61% | |
| 80+ years | 11.86% | 11.62% | 13.46% | |
| Gender | ||||
| Male (%) | 454 (49.2%) | 421 (48.7%) | 33 (55.9%) | 0.284 |
| Female (%) | 469 (50.8%) | 443 (51.3%) | 26 (44.1%) | |
| Top 10 common diagnosis | ||||
| Sepsis, septic shock n, (%) | 130(13.1%) | 107(12.3%) | 23(38.9%) | 0.000 |
| Pneumonia n, (%) | 265(27.7 %) | 235(27.1%) | 30(50.8%) | 0.009 |
| UTI n, (%) | 201(21.8%) | 193(22.33%) | 8(13.55%) | 0.142 |
| AKI n, (%) | 373(40%) | 350(40.5%) | 23(38.9%) | 0.817 |
| MI and Pulmonary Edema n, (%) | 71(7.7%) | 62(7.17%) | 9(15.25%) | 0.038 |
| Stroke n, (%) | 28(3.0%) | 24(2.77%) | 4(6.77%) | 0.097 |
| Atrial Fibrillation n, (%) | 28(3.0 %) | 24(2.77%) | 4(6.77%) | 0.083 |
| Electrolyte Imbalance n, (%) | 170(18.4%) | 162(18.75%) | 8(13.55%) | 0.387 |
| Exacerbation of Obstructive Airway Disease n, (%) | 59(6.4 %) | 53(6.13%) | 6(10.16%) | 0.220 |
| Solid Tumors n, (%) | 26(2.8%) | 23(2.66%) | 3(5.08%) | 0.403 |
| Comorbid n, (%) | ||||
| Diabetes | 510 (55.3%) | 472(54.62%) | 34(57.62%) | 0.650 |
| Hypertension | 648 (70.2%) | 609(70.48%) | 39(66.10%) | 0.470 |
| Ischemic Heart Disease | 307(33.3%) | 230(26.62%) | 21(35.55%) | 0.134 |
| Chronic Kidney Disease | 474 (51%) | 216(25.00%) | 24(40.67%) | |
| Chronic Liver Disease | 66 (7.2%) | 56(6.48%) | 10(16.94%) | 0.003 |
| Thyroid Disorders | 37 (4.0%) | 36(4.16%) | 01(1.69%) | 0.349 |
| Malignancy | 26 (2.8%) | 24(2.77%) | 2(3.38%) | 0.783 |
| HIV/AIDS | 7 (0.7%) | 6(0.69%) | 01(1.69%) | 0.391 |
| Length of stay (mean ± SD) | 5.9 ± 4.7 | |||
| Mortality rate n, (%) | 59 (6.4%) | |||
Table 2.
Comparison of critical illness scores overall, among survivors and non-survivors in patients admitted to intermediate care units
| Critical Illness scales Median (interquartile range) | Overall (n=923) | Survived (n=864) | Not survived (n=59) | P-value |
|---|---|---|---|---|
| APACHE II | 16(11–21) | 16(11–21) | 20(13–25) | 0.002 |
| SOFA | 4(2–6) | 4(2–5) | 7(4–10) | 0.000 |
| SAPS II | 36(30–53) | 35(30–42) | 44(38–53) | 0.000 |
| MEWS | 3(2–4) | 3(2–4) | 5(3–6) | 0.000 |
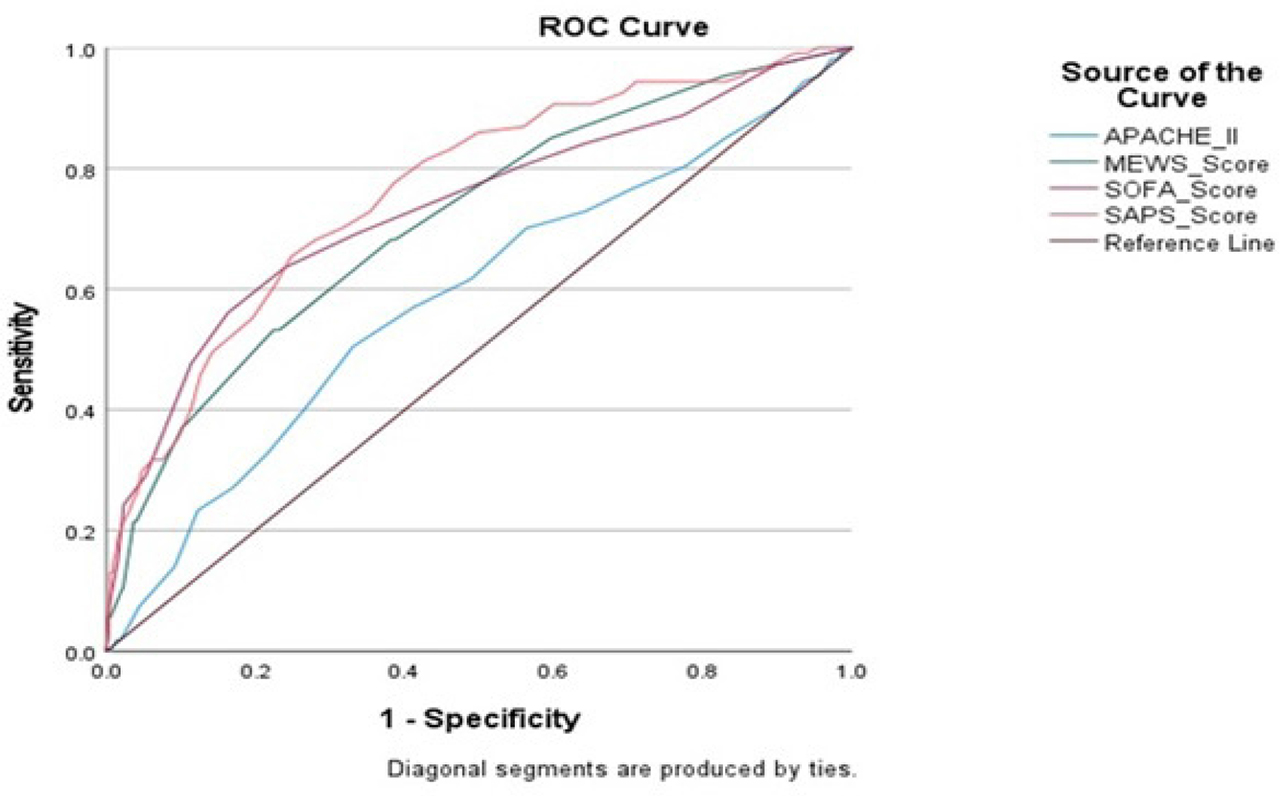
Fig. 1.
ROC Curve showing four different critical illness scores in patients admitted to IMCU
Table 3.
The area under the characteristic curve, sensitivity, and specificity data of critical illness scores in patients admitted to intermediate care units
| Scores | Cutoff values | AUC (95%CI) | P value | Sensitivity % | Specificity % | SMR (95%CI) |
|---|---|---|---|---|---|---|
| Acute Physiology and Chronic Health Evaluation II | ≥ 12 | 0.584 (0.52–0.64) | 0.004 | 70 | 76 | 0.25 (0.32–0.19) |
| Sequential Organ Failure Assessment | ≥ 6 | 0.735 (0.68–0.79) | 0.000 | 64 | 76 | 0.64 (0.80–0.48) |
| Simplified Acute Physiology Score II | ≥ 39 | 0.763 (0.71–0.81) | 0.000 | 78 | 62 | 0.35 (0.45–0.26) |
| Modified Early Warning Score | ≥ 3 | 0.714 (0.66–0.77) | 0.000 | 85 | 40 | 0.51 (0.64–0.38) |
| Score | Calculation | Interpretation | |
|---|---|---|---|
| SOFA |
| Score | Mortality |
|
|
| |
| |||
| |||
| |||
| |||
| MEWS |
| Score | Plan |
| 1–2 | 2 hour observation | |
| 3 | 1–2 hour observation | |
| ≥4 | 1/2hr observe & inform doctor | |
| |||
| |||
| APACHE II |
| Score | Mortality Rate |
| 0–4 | 4% | |
| 5–9 | 8% | |
| 10–14 | 15% | |
| 15–19 | 25% | |
| 20–24 | 40% | |
| 25–29 | 55% | |
| 30–34 | 75% | |
| >34 | 85% | |
| |||
| |||
| |||
| |||
| |||
| |||
| SAPS II |
| Score | Mortality Rate |
| 29 | 10% | |
| 40 | 25% | |
| 52 | 50% | |
| 64 | 75% | |
| 77 | 90% | |
| |||
| |||
| |||
| |||
| |||
| |||
| |||
| |||
| |||