
Fig.1.
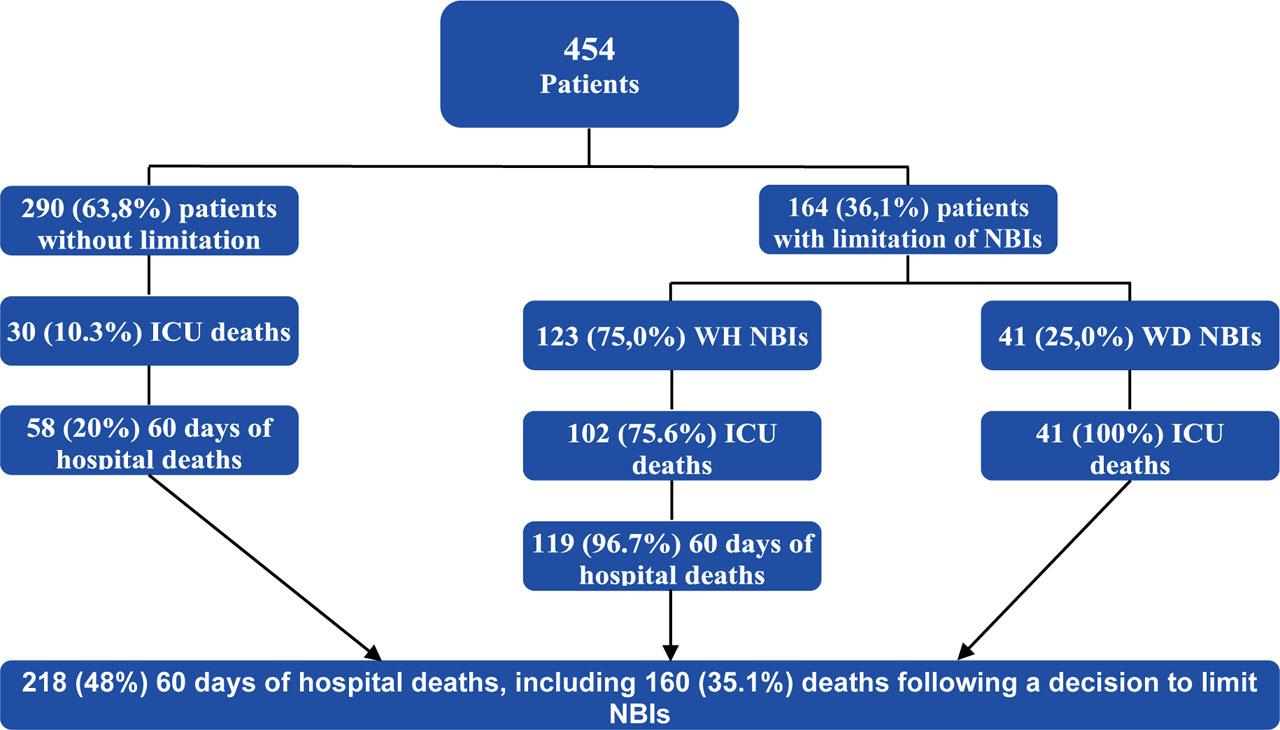
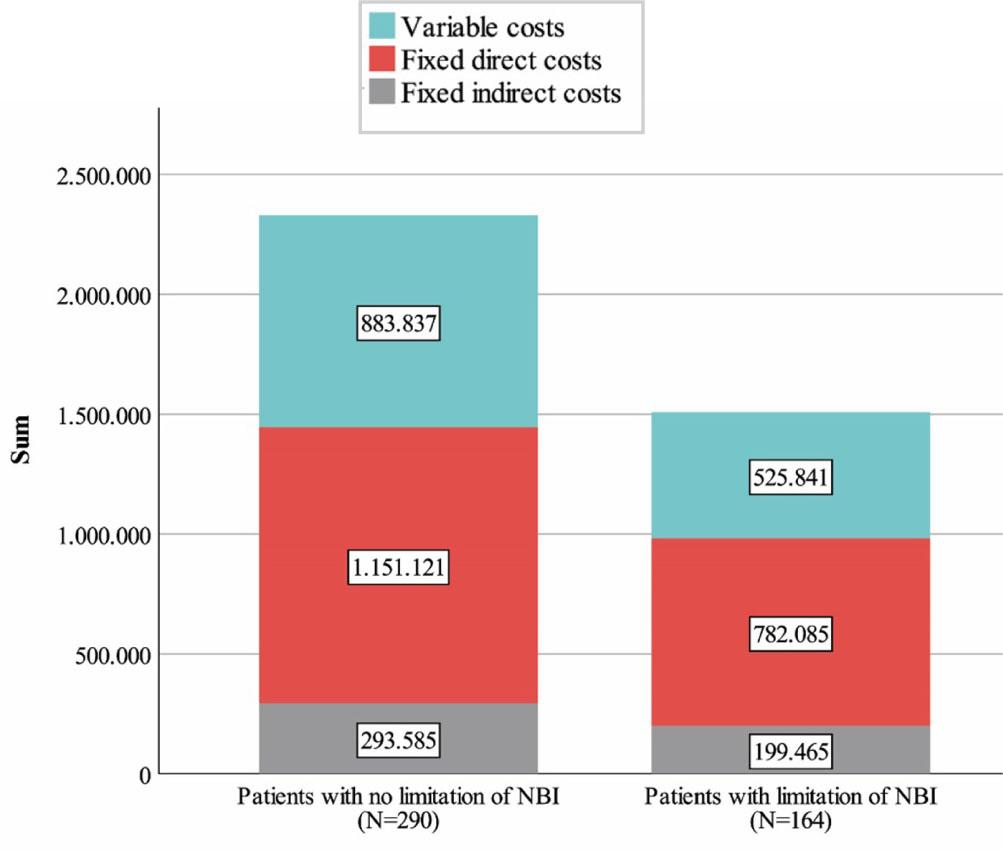
Fig.2.
Type of Limited NBIs
| Limited NBIs (n, %) | (N=164) |
|---|---|
| Vasoactive drugs | 128 (78,0) |
| Invasive mechanical ventilation | 95 (57,9) |
| Noninvasive mechanical ventilation | 27 (16,5) |
| Continuous renal replacement techniques | 17 (10,4) |
Cost category per patient before and after the limitation of NBIs
| Cost category per patient | Mean(SD) | P value |
|---|---|---|
| Variable cost (before) | 2666,13 (3306,89) | 0,001 |
| Variable cost (after) | 556,6 (735,3) | |
| Fixed direct costs (before) | 3269,52 (4173,84) | 0,001 |
| Fixed direct costs (after) | 1514,76 (1759,64) | |
| Fixed indirect costs (before) | 833,86 (1064,5) | 0,001 |
| Fixed indirect costs (after) | 366,33 (448,78) | |
| Total cost (before) | 6769,53 (8331,59) | 0,001 |
| Total cost (after) | 2457,7 (2652,68) | |
| Daily cost (before) | 767,31 (405,52) | 0,001 |
| Daily cost (after) | 649,12 (243,14) | |
Patients’ characteristics
| Patients’ characteristics | All patients(N=454) | Patients with no limitation of NBIs (N=290) | Patients with limited NBIs (N=164) | P-value |
|---|---|---|---|---|
| Gender–Male, n(%) | 304 (67,0) | 195 (67,2) | 109 (66,5) | 0,866 |
| Age, median (IQR) | 65 (21) | 62 (22) | 70 (14) | 0,000 |
| APACHE IV, median (IQR) | 58 (35) | 50 (31) | 71 (42) | 0,000 |
| APACHE IV PDR, median (IQR) | 28,4 (36,6) | 17,35 (27,2) | 48,9 (31,9) | 0,000 |
| LOS, median (IQR) | 5 (12) | 4,5 (11) | 7 (13) | 0,004 |
| Reason for admission n (%) | ||||
| Surgery | 99 (21,81) | 92 (31,7) | 7 (4,3) | 0,001 |
| Acute respiratory failure (COVID-19) | 95 (20,93) | 41 (14,1) | 54 (32,9) | 0,001 |
| Acute Respiratory Failure | 59 (13) | 41 (14,1) | 18 (11,0) | 0,385 |
| Traumatic brain injury | 43 (9,47) | 22 (7,6) | 21 (12,8) | 0,094 |
| Nontraumatic CNS injuries | 43 (9,47) | 25 (8,6) | 18 (11,0) | 0,409 |
| Cardiac arrest | 33 (7,27) | 11 (3,8) | 22 (13,4) | 0,001 |
| Sepsis | 25 (5,51) | 11 (3,8) | 14 (8,5) | 0,052 |
| Multiple trauma | 18 (3,96) | 17 (5,9) | 1 (0,6) | 0,005 |
| Multiple trauma (with TBI) | 14 (3,08) | 9 (3,1) | 5 (3,0) | 0,607 |
| Other | 25 (5,51) | 21 (7,2) | 4 (2,4) | 0,033 |
| Comorbidities at ICU admission n (%) | ||||
| Chronic pulmonary disease | 72 (15,9) | 36 (12,4) | 36 (22,0) | 0,011 |
| Cardiovascular disease | 134 (29,5) | 80 (29,5) | 54 (32,9) | 0,412 |
| Chronic kidney disease | 26 (5,7) | 8 (2,8) | 18 (11,0) | 0,001 |
| Hypertension | 170 (37,4) | 96 (33,1) | 74 (45,1) | 0,012 |
| Disorders of thyroid gland | 31 (6,8) | 20 (6,9) | 11 (6,7) | 0,553 |
| Diabetes mellitus | 88 (19,4) | 46 (15,9) | 42 (25,6) | 0,014 |
| Cancer | 39 (8,6) | 26 (9,0) | 13 (7,9) | 0,862 |
| Obesity | 22 (4,8) | 11 (3,8) | 11 (6,7) | 0,177 |
| Other | 186 (41,0) | 128 (44,1) | 58 (35,4) | 0.074 |
| ICU mortality, n (%) | 173 (38,1) | 30 (10,3) | 143 (87,2) | 0,000 |
| 60 days hospital mortality, n (%) | 218 (48,0) | 58 (20,0) | 160 (97,6) | 0,000 |
| SMR, 95% Confidence Interval (CI) | 1,18 (0.88–1.58) | 0,47 (0.28–0.78) | 1,74 (1.55–2.05) | |
| Variable costs per patient, mean (SD) | 3111,87 (4306,06) | 3047,71 (4661,21) | 3226,02 (3599,26) | 0,017 |
| Fixed direct costs per patient, mean (SD) | 4263,75 (5029,56) | 3969,38 (5010,92) | 4798,06 (5047,95) | 0.004 |
| Fixed indirect costs per patient, mean (SD) | 1087,44 (1282,75) | 1012,36 (1278,00) | 1223,72 (1287,44) | 0,004 |
| Total cost per patient, mean (SD) | 8467,85 (10179,37) | 8029,46 (10490,42) | 9247,79 (9582,97) | 0,004 |
| Average daily cost per patient, mean (SD) | 832,10 (163,82) | 832,59 (159,46) | 831,24 (171,80) | 0,716 |
Length of stay in ICU of patients with limitation of NBIs
| LOS (in ICU) | Withholding NBIs | Withdrawing NBIs | ||
|---|---|---|---|---|
| Before decision | After decision | Before decision | After decision | |
| N | 123 | 41 | ||
| Mean | 8,93 | 3,94 | 4,12 | 2,49 |
| SD | 10,94 | 4,44 | 3,68 | 2,94 |
| Median | 6 | 2 | 3 | 2 |
| IQR | 12 | 4 | 4 | 3 |
| Min | 1 | 1 | 1 | 1 |
| Max | 64 | 27 | 15 | 17 |
| Sum | 1098 | 485 | 169 | 102 |