
Fig. 1.
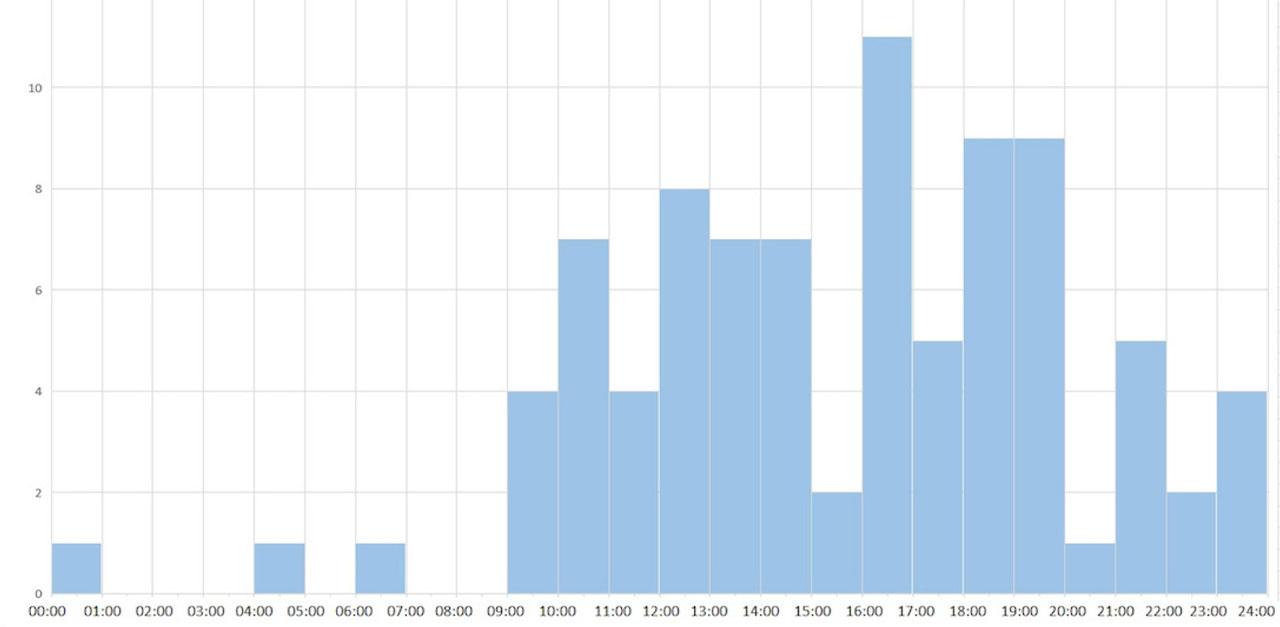
Fig. 2.
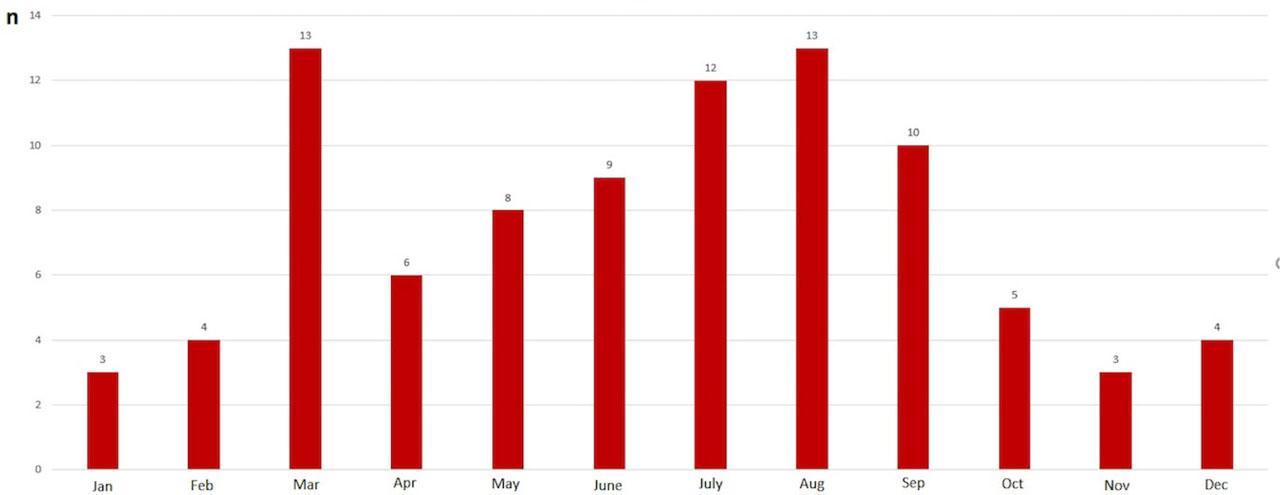
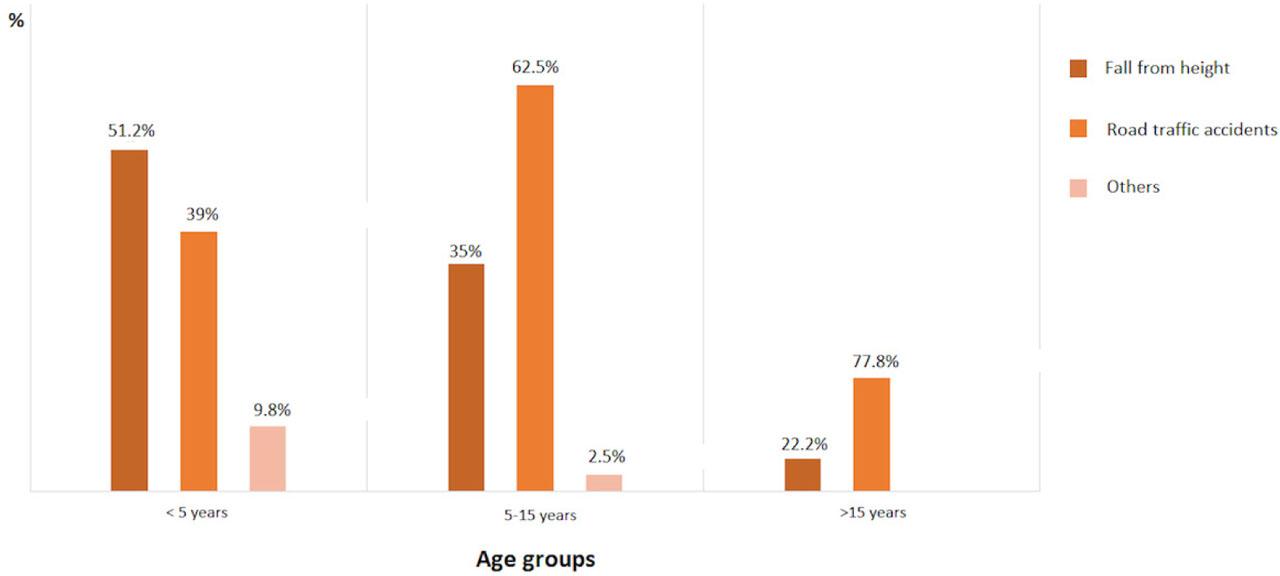
Fig. 3.
Comparison of different scoring systems of the TBI patients according to the presence of early, and late enteral feeding
| Parameter | Enteral feeding | p | |
|---|---|---|---|
| <48th hour of hospitalization (n=65) | >48th hour of hospitalization (n=25) | ||
| PRISM | 5 (0–25) | 6 (1–27) | 0.124 |
| PDR (%) | 1.6 (0.5–59) | 2.1 (0.4–52.8) | 0.296 |
| PIM3 | 2 (0.7–27) | 2.2 (0.9–11) | 0.182 |
| Pediatric Trauma Score | 10 (−1–12) | 9 (1–12) | 0.139 |
| Injury severity score | 5 (1–50) | 10 (2–41) | 0.001 |
| GCS | 13 (2–15) | 13 (5–15) | 0.985 |
| GOS at discharge | 5 (1–5) | 5 (3–5) | 0.340 |
| GOS at 3rd month | 5 (1–5) | 5 (3–5) | 0.238 |
| Favorable GOS at discharge | 46 (70.8) | 15 (60) | 0.327 |
| Favorable GOS at 3rd month | 50 (76.9) | 16 (64) | 0.214 |
Comparison of demographic and clinical properties between patients with favorable outcome and disability according to Glasgow Outcome Score (GOS) 3 months after TBI
| Parameter | GOS at 3rd month | p | |
|---|---|---|---|
| GOS=5 (n=66) | GOS≤4 (n=24) | ||
| Age | 4.9 (0.3–17.5) | 6.1 (0.2–17.5) | 0.942 |
| Gender (female) | 29 (43.9) | 8 (33.3) | 0.366 |
| Multisystemic trauma | 37 (56.1) | 19 (79.2) | 0.046 |
| Trauma localization in multisystemic trauma | |||
| Extremity trauma | 20 (30.3) | 6 (25) | 0.624 |
| Pelvic trauma | 6 (9.1) | 2 (8.3) | 0.911 |
| Thorax trauma | 14 (21.2) | 16 (66.7) | 0.001 |
| Abdominal trauma | 12 (18.2) | 9 (37.5) | 0.054 |
| Facial trauma | 17 (25.8) | 6 (25) | 0.942 |
| Vertebral trauma | 7 (10.6) | 1 (4.2) | 0.342 |
| Altered consciousness | 37 (56.1) | 22 (91.7) | 0.002 |
| Seizure | 5 (7.6) | 11 (45.8) | 0.001 |
| CT/MRI findings | |||
| Skull fracture | 46 (69.7) | 12 (50) | 0.084 |
| Brain contusion | 26 (39.4) | 23 (95.8) | 0.001 |
| Subarachnoid hemorrhage | 4 (6.1) | 5 (20.8) | 0.039 |
| Subdural hemorrhage | 9 (13.6) | 10 (41.7) | 0.004 |
| Epidural hemorrhage | 9 (13.6) | 5 (20.8) | 0.405 |
| Intraparenchymal hemorrhage | 7 (10.6) | 6 (25) | 0.086 |
| Brain edema | 31 (47) | 13 (54.2) | 0.546 |
| Diffuse axonal injury | 0 | 5 (28) | 0.001 |
| Shock treatment in ED | 5 (7.6) | 5 (20.8) | 0.077 |
| Inotropic drug in ED | 1 (1.5) | 3 (12.5) | 0.025 |
| Blood products in 48 h | 16 (24.2) | 16 (66.7) | 0.001 |
| Cranial surgery in 24 h | 4 (6.1) | 6 (25) | 0.011 |
| Other surgery in 24 h | 11 (16.7) | 6 (25) | 0.372 |
| CPR in the first 24h of hospitalization | 0 | 3 (12.5) | 0.003 |
| MV in the first 24h of hospitalization | 1 (1.5) | 15 (62.5) | 0.001 |
| Nosocomial infections | 2 (3) | 12 (50) | 0.001 |
| PICU stay | 2 (1–12) | 9 (2–47) | 0.001 |
| Length of hospitalization | 5 (2–33) | 16.5 (6–60) | 0.001 |
| MV duration | 1 (1–4) | 5 (1–28) | 0.061 |
| PRISM | 4 (0–18) | 16 (4–27) | 0.001 |
| PDR (%) | 1.5 (0.4–25.5) | 15.5 (0–59) | 0.001 |
| PIM3 | 1.8 (0.7–8) | 6.8 (1.2–27) | 0.001 |
| Pediatric Trauma score (PTS) | 10 (6–12) | 5 (−1–11) | 0.001 |
| Injury severity score (ISS) | 5 (1–24) | 15 (4–50) | 0.001 |
| GCS at admission | 15 (2–15) | 8 (4–15) | 0.001 |
Comparison of demographic and clinical parameters between patients according to the presence of early, and late enteral feeding
| <48th hour of hospitalization (n=65) | >48th hour of hospitalization (n=25) | p | |
|---|---|---|---|
| Age (year), median | 5.08 (0.25–17.5) | 7.58 (0.67–17.5) | 0.063 |
| Gender (female) | 25 (38.5) | 12 (48) | 0.410 |
| Trauma localization | |||
| Multisystemic trauma | 32 (49.2) | 24 (96) | 0.001 |
| Extremity trauma | 11 (16.9) | 15 (60) | 0.001 |
| Pelvic trauma | 1 (1.5) | 7 (28) | 0.001 |
| Thorax trauma | 20 (30.8) | 10 (40) | 0.405 |
| Abdominal trauma | 8 (12.3) | 13 (52) | 0.001 |
| Facial trauma | 11 (16.9) | 12 (48) | 0.002 |
| Vertebral trauma | 4 (6.2) | 4 (16) | 0.142 |
| CT/MRI findings | |||
| Skull fracture | 40 (61.5) | 18 (72) | 0.353 |
| Brain contusion | 7 (10.8) | 3 (12) | 0.868 |
| Subarachnoid hemorrhage | 5 (7.7) | 4 (16) | 0.239 |
| Subdural hemorrhage | 15 (23.1) | 4 (16) | 0.461 |
| Epidural hemorrhage | 11(16.9) | 3 (12) | 0.564 |
| Intraparenchymal hemorrhage | 10 (15.4) | 3 (12) | 0.682 |
| Brain edema | 31 (47.7) | 13 (52) | 0.714 |
| Diffuse axonal injury | 5 (7.7) | 0 | 0.067 |
| First 24 hours | |||
| Blood products | 19 (29.2) | 13 (52) | 0.043 |
| Cranial surgery | 8 (12.3) | 2 (8) | 0.560 |
| Other surgery | 6 (9.2) | 11 (44) | 0.001 |
| CPR | 1 (1.5) | 2 (8) | 0.128 |
| Mechanical ventilation | 11 (16.9) | 5(20) | 0.732 |
| Nosocomial infection | 10 (15.4) | 4 (16) | 0.943 |
| PICU stay | 3 (1–28) | 5 (1–47) | 0.272 |
| Length of hospitalization | 5 (2–43) | 10 (5–60) | 0.001 |
The causes, locations, and clinical features of traumatic brain injury in 90 children
| Causes | n | % | Locations | n | % |
|---|---|---|---|---|---|
| Road traffic accidents | 39 | 43.3 | Outdoor | 67 | 74.4 |
| Passenger | 12 | 13.3 | Home | 21 | 23.3 |
| Pedestrian | 27 | 30 | School | 2 | 2.2 |
| Fall from height | 34 | 37.8 | CT/MRI findings | n | % |
| Cyclist | 9 | 10 | Skull fracture | 58 | 64.4 |
| Falling object | 4 | 4.4 | Brain edema | 44 | 48.9 |
| Basic fall | 3 | 3.3 | Subdural hemorrhage | 19 | 21.1 |
| Other | 1 | 1.1 | Epidural hemorrhage | 14 | 15.6 |
| Sign and symptoms | n | % | Intraparenchymal hemorrhage | 13 | 14.4 |
| Altered consciousness | 59 | 65.6 | Brain contusion | 10 | 11.1 |
| Nausea/Vomiting | 28 | 31.1 | Subarachnoid hemorrhage | 9 | 10 |
| Seizure | 16 | 17.8 | Diffuse axonal injury | 5 | 5.6 |
| Headache | 9 | 10 | Minimal brain edema | 5 | 5.6 |
| Amnesia | 2 | 2.2 | |||
| Asymptomatic | 6 | 6.7 |
Multiple logistic regression analysis of variables associated with outcome according to the 3rd month GOS in traumatic brain injury patients
| Variables | B | S.E. | P | OR (95% CI) |
|---|---|---|---|---|
| Diffuse axonal injury | −0.281 | 0.243 | 0.001 | 2.62 (1.83–3.74) |
| CPR in the first 24h of hospitalization | −0.339 | 0.503 | 0.005 | 1.62 (1.13–2.74) |
| PIM3 | −0.285 | 0.023 | 0.023 | 1.56 (0.40–6.19) |