
Fig.1.
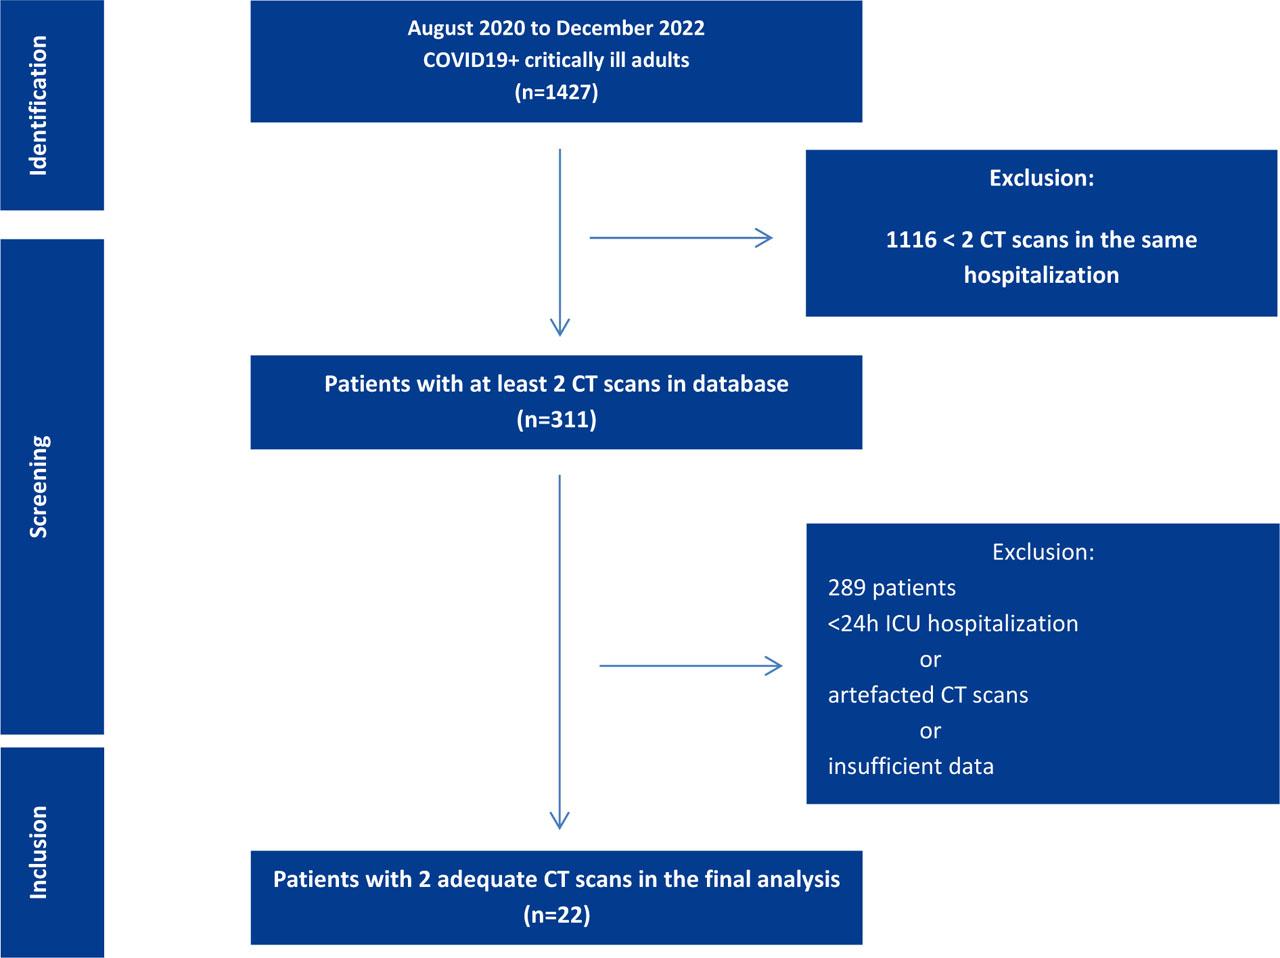
Fig. 2.
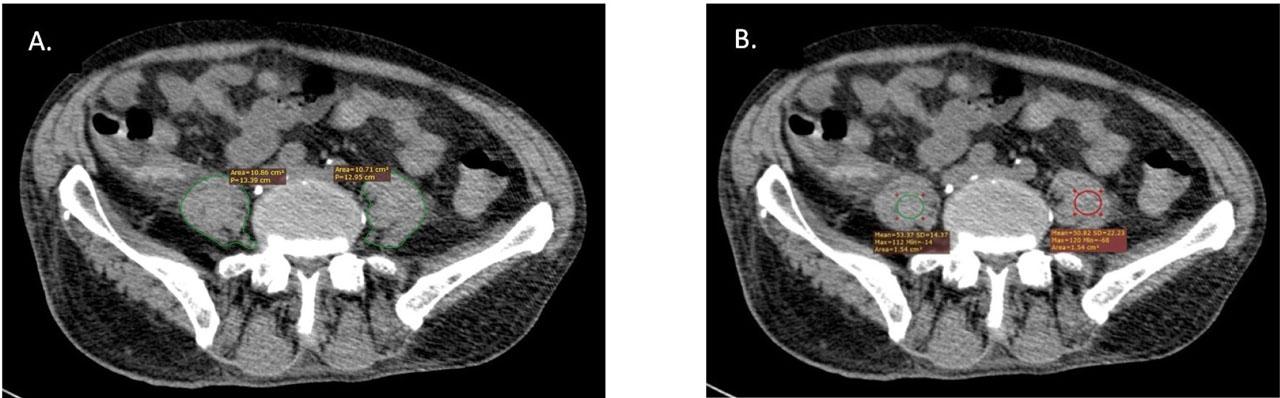
Fig. 3.
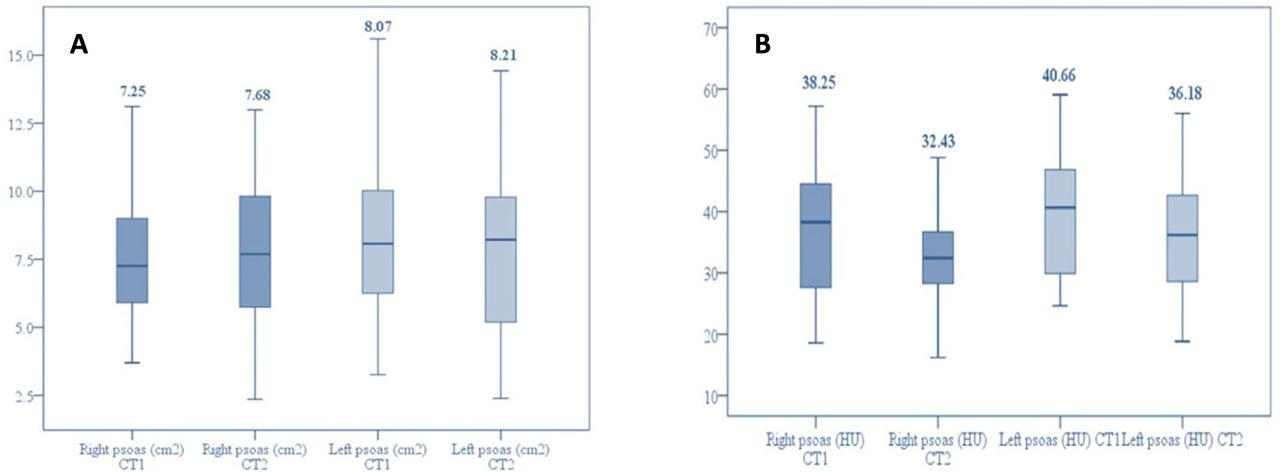
Fig. 4.
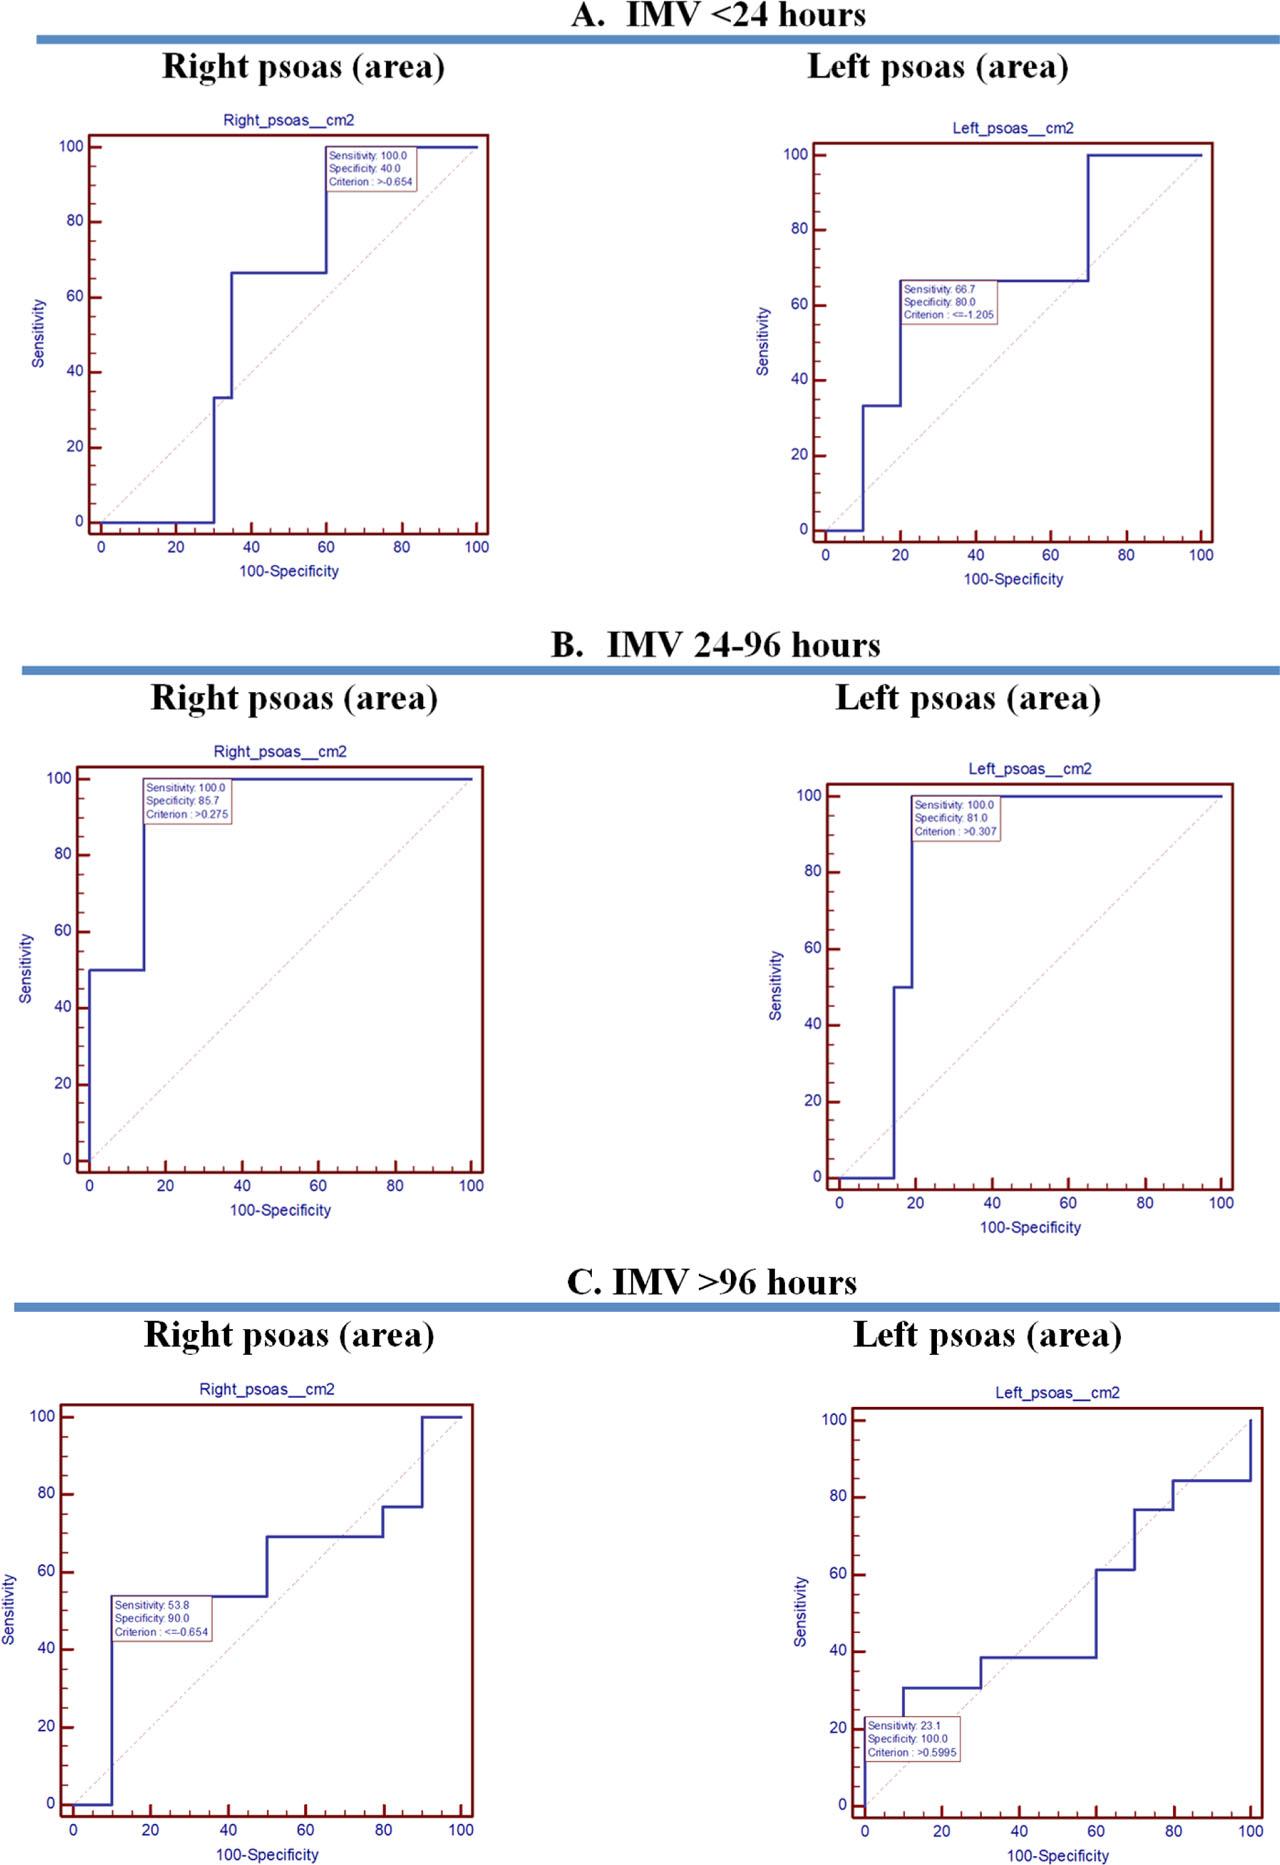
Fig. 5.
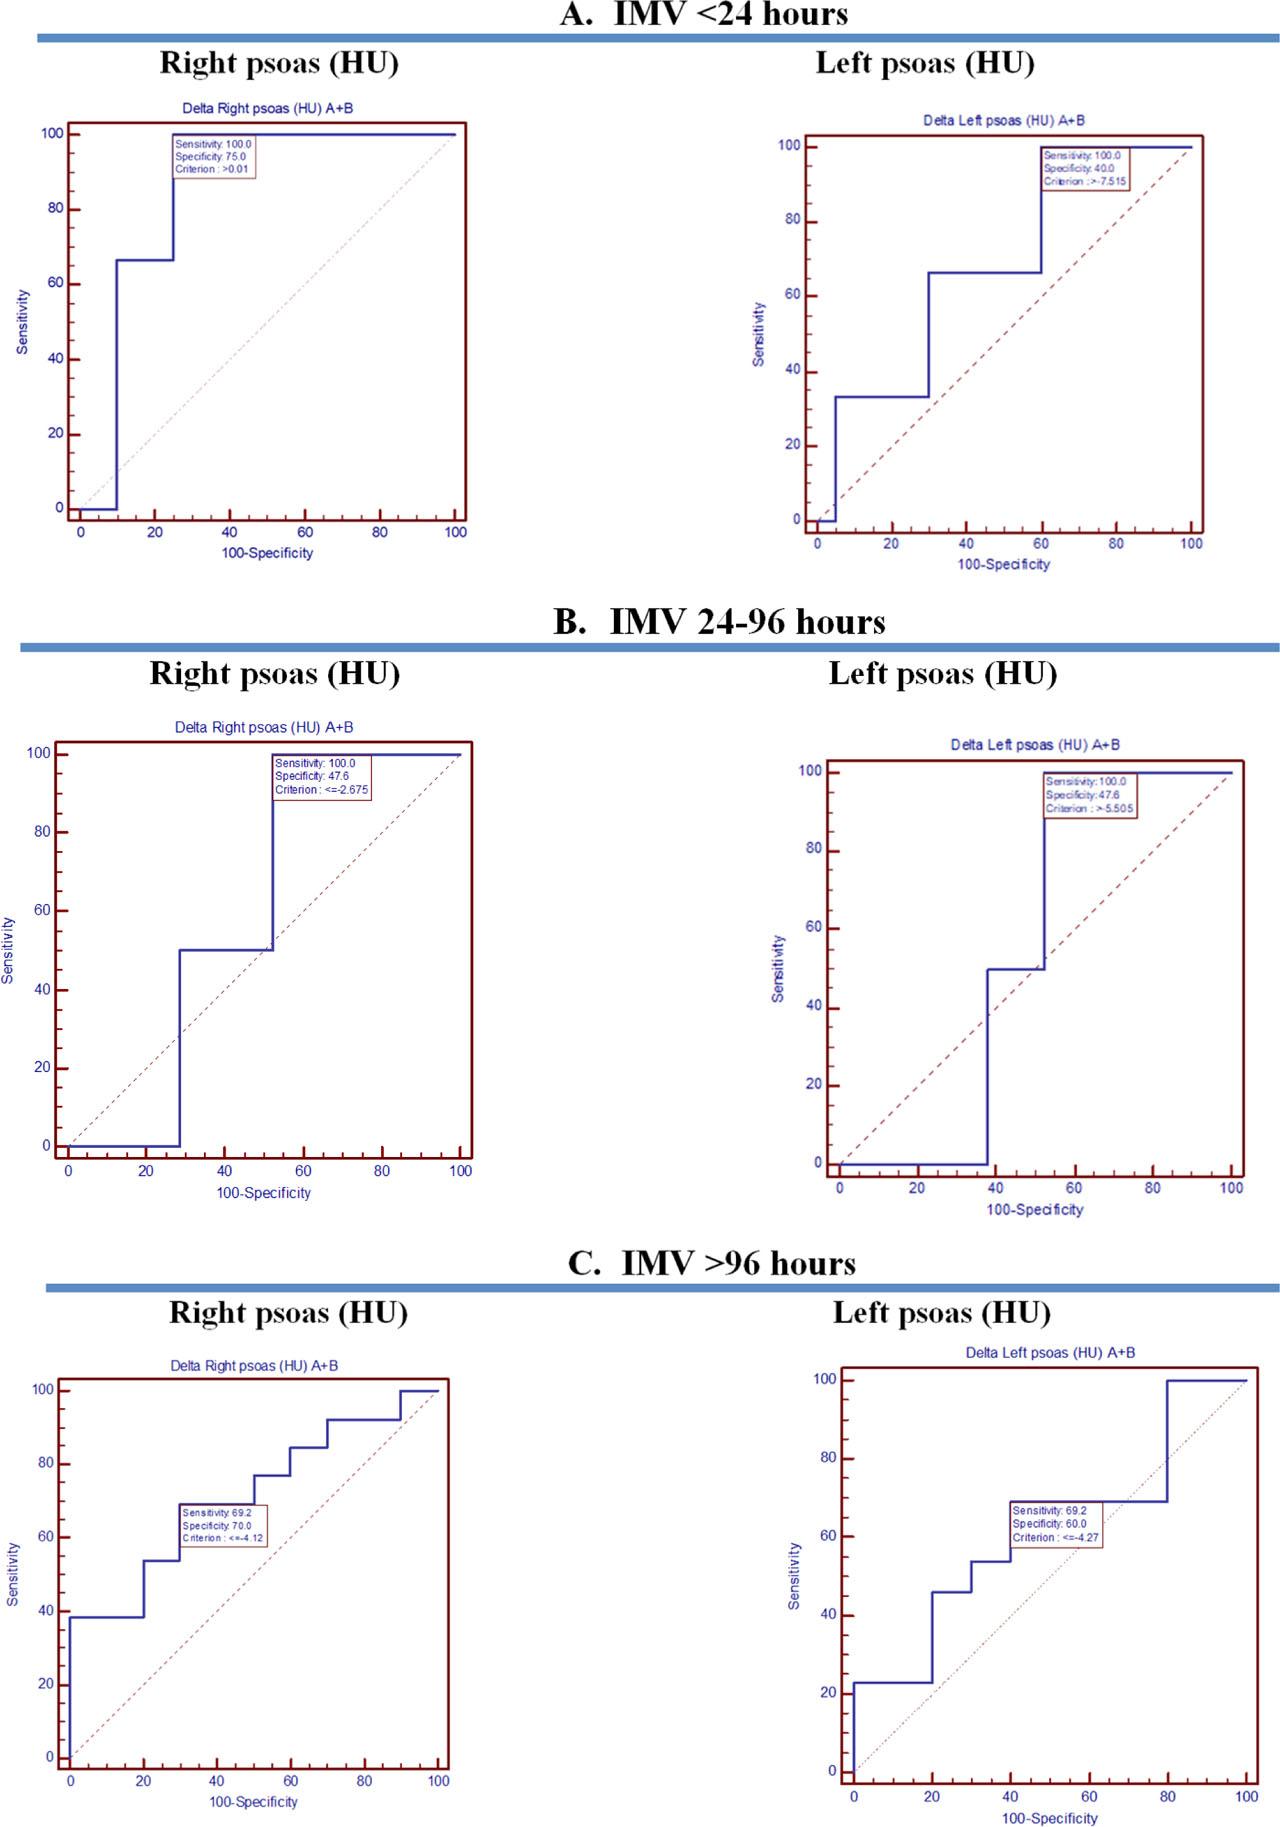
Fig. 6.
AUC-ROC for psoas HU and IMV duration
| IMV duration (hours) | Psoas (HU) | Criterion | AUC-ROC | 95% CI | P | Sn | 95% CI | Sp | 95% CI |
|---|---|---|---|---|---|---|---|---|---|
| <24 | Right | >−0.01 | 0.850 | 0.640–0.963 | 0.0001 | 100.00 | 29.2–100.0 | 75.00 | 50.9–91.3 |
| Left | >−7.515 | 0.683 | 0.458–0.859 | 0.29 | 100.00 | 29.2–100.0 | 40.00 | 19.1–63.9 | |
| 24–96 | Right | ≤−2.675 | 0.595 | 0.373–0.792 | 0.53 | 100.00 | 15.8–100.0 | 47.62 | 25.7–70.2 |
| Left | >−5.505 | 0.548 | 0.329–0.754 | 0.70 | 100.00 | 15.8–100.0 | 47.62 | 25.7–70.2 | |
| >96 | Right | ≤−4.12 | 0.715 | 0.491–0.882 | 0.049 | 69.23 | 38.6–90.9 | 70.00 | 34.8–93.3 |
| Left | ≤−4.27 | 0.623 | 0.399–0.814 | 0.31 | 69.23 | 38.6–90.9 | 60.00 | 26.2–87.8 | |
Dynamic changes in total psoas area and psoas HU in two CT scan evaluations
| CT scan parameter | CT1 (A+B) Mean±SD | CT2 (A+B) Mean±SD | Difference Mean | p difference 1st and 2nd |
|---|---|---|---|---|
| Right TPA(cm2) | 7.82±2.76 | 7.70±2.90 | −0.12 | 0.88 |
| Left TPA(cm2) | 8.52±3.56 | 7.92±3.20 | −0.59 | 0.56 |
| Right psoas HU | 37.4±10.21 | 33.16±10.31 | −4.24 | 0.17 |
| Left psoas HU | 39.9±10.06 | 35.93±9.33 | −3.99 | 0.17 |
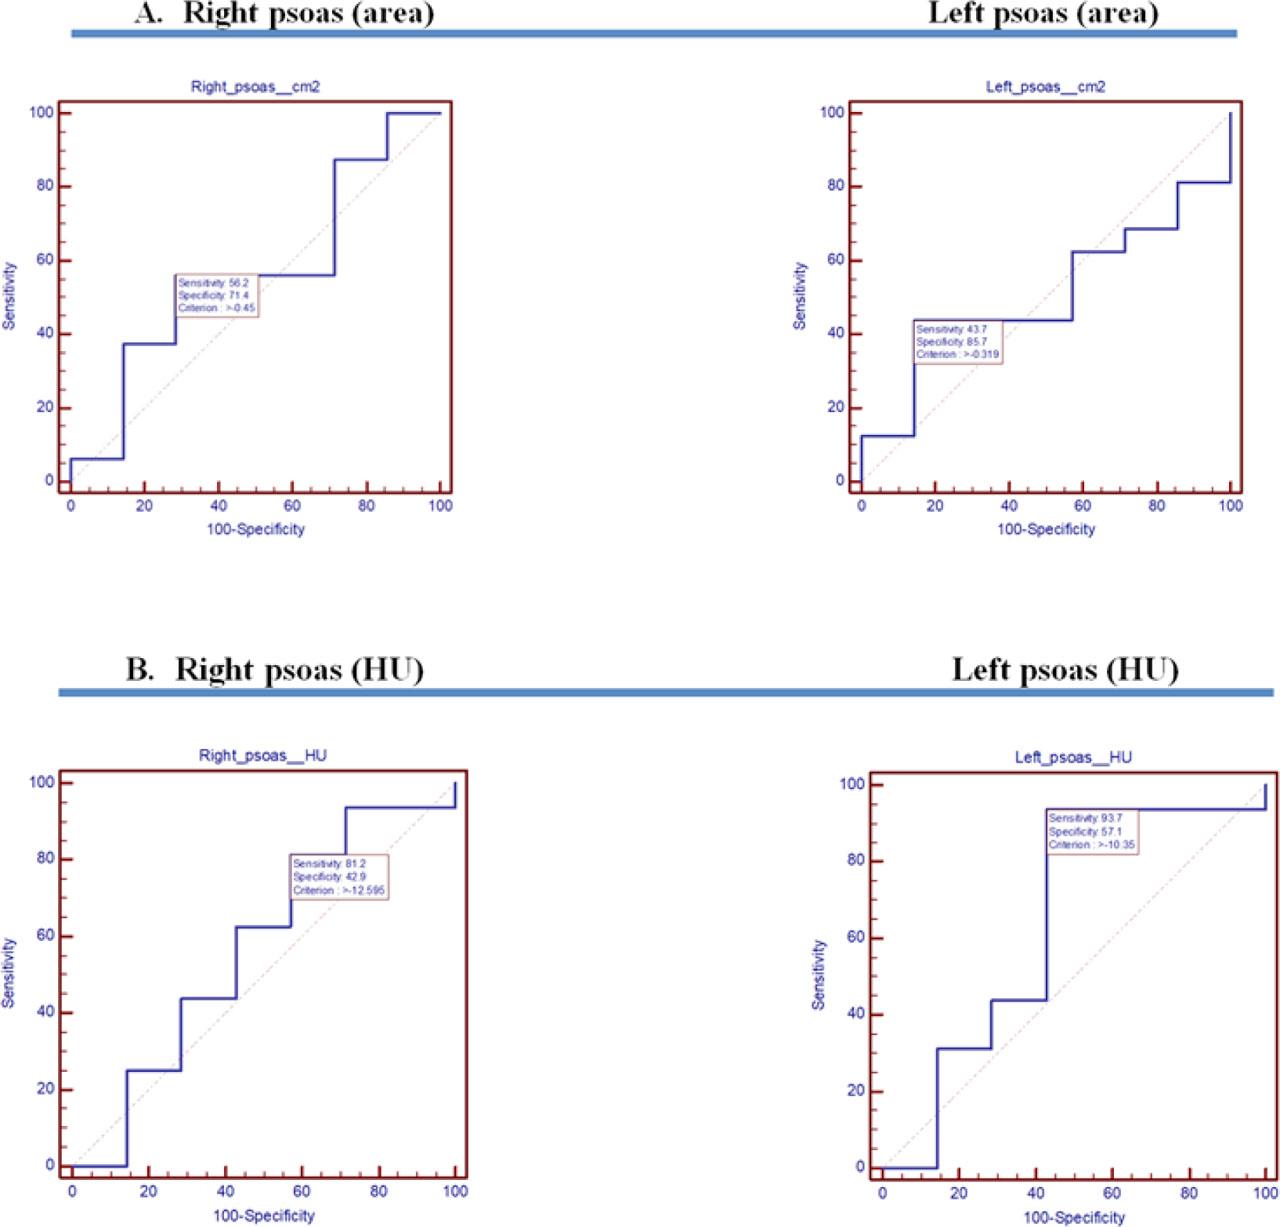
AUC-ROC for the Psoas area and IMV duration
| IMV duration (hours) | Psoas area (cm2) | Criterion | AUC-ROC | 95% CI | p | Sn | 95% CI | Sp | 95% CI |
|---|---|---|---|---|---|---|---|---|---|
| <24 | Right | >−0.654 | 0.583 | 0.362–0.783 | 0.53 | 100.00 | 29.2–100.0 | 40.00 | 19.1–63.9 |
| Left | ≤−1.205 | 0.667 | 0.442–0.847 | 0.39 | 66.67 | 9.4–99.2 | 80.00 | 56.3–94.3 | |
| 24–96 | Right | >0.275 | 0.929 | 0.741–0.994 | 0.0001 | 100.00 | 15.8–100.0 | 85.71 | 63.7–97.0 |
| Left | >0.307 | 0.833 | 0.621–0.954 | 0.0001 | 100.00 | 15.8–100.0 | 80.95 | 58.1–94.6 | |
| >96 | Right | ≤−0.654 | 0.600 | 0.377–0.796 | 0.43 | 53.85 | 25.1–80.8 | 90.00 | 55.5–99.7 |
| Left | >0.599 | 0.508 | 0.294–0.720 | 0.951 | 23.08 | 5.0–53.8 | 100.00 | 69.2–100.0 | |
AUC-ROC for the negative outcome (deceased patients)
| CT scan parameter | Criterion | AUC-ROC | 95% CI | P | Sn | 95% CI | Sp | 95% CI |
|---|---|---|---|---|---|---|---|---|
| Right psoas area | >−0.45 | 0.571 | 0.351–0.773 | 0.610 | 56.2 | 29.9–80.2 | 71.4 | 29.0–96.3 |
| Right psoas HU | >−12.59 | 0.571 | 0.350–0.773 | 0.633 | 81.2 | 54.4–96.0 | 42.9 | 9.9–81.6 |
| Left psoas area | >−0.319 | 0.509 | 0.295–0.721 | 0.944 | 43.7 | 19.8–70.1 | 85.7 | 42.1–99.6 |
| Left psoas HU | >−10.35 | 0.643 | 0.418–0.829 | 0.362 | 93.7 | 69.8–99.8 | 57.1 | 18.4–90.1 |
Patients’ characteristics
| Demographics | All patients (n=22) |
|---|---|
| Male sex (n, %) | 8 (36.4%) |
| Age (years, mean±SD) | 71.09±10.57 |
| ICU admission diagnostics | |
| ARF (n, %) | 11 (50%) |
| Other (n, %) | 11 (50%) |
| Severity scores | |
| qCSI (mean±SD) | 8.73±2.27 |
| CHOSEN score (median (min-max)) | 13 (1–44) |
| modified CHOSEN score (mean±SD) | 19.33±9.81 |
| Hospital stay characteristics | |
| LOS in Hospital (days) (median (min-max)) | 18 (10–91) |
| LOS in ICU (days) (median (min-max)) | 11 (2–91) |
| Time period between CTpsoas1 and CT psos2 (days) (medain (min-max)) | 10 (3–19) |
| ICU admission oxygenation | |
| Facial mask (n, %) | 9 (40.9%) |
| NIV-CPAP (n, %) | 2 (9.1%) |
| IMV (n, %) | 11 (50%) |
| ICU stay oxygenation | |
| Need for NIV-CPAP (n, %) | 5 (22.7%) |
| Need for IMV (n, %) | 18 (81.8%) |
| IMV <24 hours | 3 (13.6%) |
| IMV 24–96 hours | 2 (9.1%) |
| IMV >96 hours | 13 (59.1%) |
| Admission laboratory report | |
| WBC (mean±SD) | 12.307±8.421 |
| Neutrophils (mean±SD) | 10.381±7.924 |
| Lymphocytes (mean±SD) | 0.958±0.783 |
| Platelets (median (min-max)) | 262.500 (90.000–1081.000) |
| NLR (median (min-max)) | 10.537 (3.758–66.631) |
| PLR (median (min-max)) | 382.907 (59.644–1184.2100) |
| SII (median (min-max)) | 2361.589 (474.000–42981.947) |
| CRP (median (min-max)) | 106.810 (5.660–353.300) |
| Creatinine (median (min-max)) | 1.025 (0.140–8.160) |
| Glucose (mean±SD) | 149.136±73.879 |
Assessment of total psoas area and psoas HU in the first and second CT scan
| CT scan parameter | Investigator A Mean±SD | Investigator B Mean±SD | Mean Difference | p difference A and B |
|---|---|---|---|---|
| Right TPA1(cm2) | 8.01±2.70 | 7.72±2.97 | −0.29 | 0.73 |
| Right TPA2(cm2) | 8.39±3.19 | 7.08±2.92 | −1.31 | 0.15 |
| Left TPA1(cm2) | 8.71±3.80 | 8.41±3.42 | −0.29 | 0.78 |
| Left TPA2(cm2) | 8.19±3.20 | 7.70±3.27 | −0.48 | 0.61 |
| Right psoasHU1 | 35.95±10.86 | 39.34±10.27 | 3.38 | 0.28 |
| Right psoasHU2 | 30.55±13.00 | 36.40±10.65 | 5.83 | 0.10 |
| Left psoasHU1 | 38.49±10.35 | 41.86±10.99 | 3.37 | 0.29 |
| Left poasHU2 | 34.68±11.99 | 37.86±9.69 | 3.18 | 0.33 |
STROBE checklist for the study’s methods
| Study design | Cohort, observational, retrospective and monocentric |
|---|---|
| Setting |
|
| Participants | Eligibility criteria: ≥ 18 years of age admitted in the ICU for at least 24 hours, positively tested for SARS-COV2 by real-time polymerase chain reaction (RT-PCR), and who had two eligible CT scans for psoas analysis |
| Variables |
|
| Data sources/measurement |
|
| Study size | Inclusion of critically ill patients who were hospitalized in the ICU for more than 24h, adults, that had two eligible CT scans for psoas assessment |
| Statistical methods |
|
LOS in hospital and LOS ICU correlations with psoas area and HU
| CT scan (mean A+B) | LOS | Right psoas (cm2) | Right psoas (HU) | Left psoas (cm2) | Left psoas (HU) | ||||
|---|---|---|---|---|---|---|---|---|---|
| Correlation coefficient | P | Correlation coefficient | p | Correlation coefficient | p | Correlation coefficient | p | ||
| CT scan1 | Hospital | 0.015 | 0.94 | 0.202 | 0.36 | −0.054 | 0.810 | 0.362 | 0.09 |
| ICU | −0.349 | 0.11 | 0.417 | 0.02 | −0.322 | 0.11 | 0.666 | 0.01 | |
| CT scan2 | Hospital | −0.087 | 0.70 | −0.198 | 0.37 | −0.069 | 0.76 | −0.007 | 0.97 |
| ICU | −0.307 | 0.16 | 0.007 | 0.97 | −0.263 | 0.23 | 0.250 | 0.26 | |