
Fig. 1.
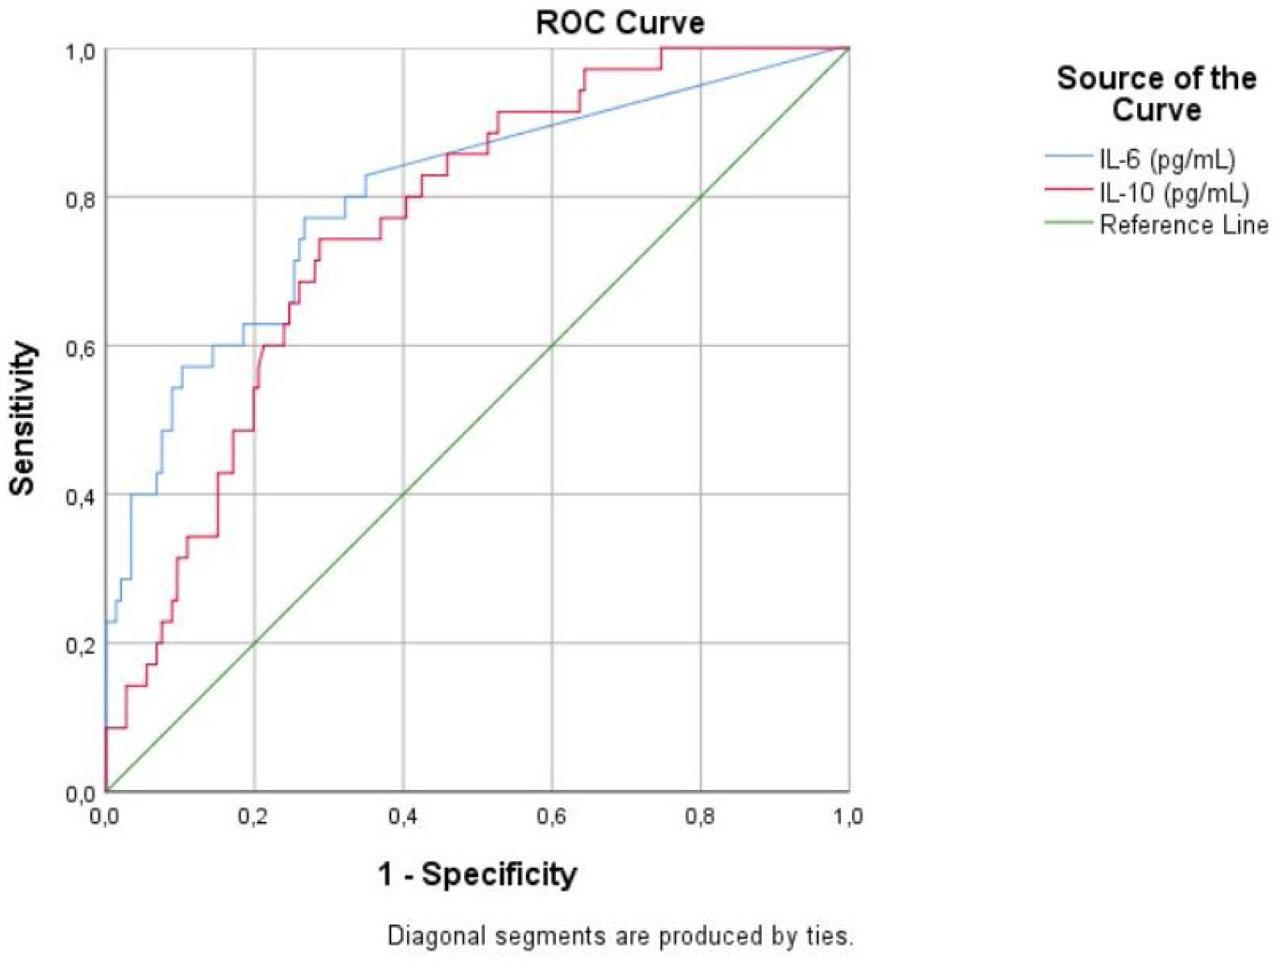
Fig. 2.
Serum cytokine levels in patients with COVID-19 according to the need for ICU transfer
| ICU transfer (n = 35) | No ICU transfer (n = 146) | p value | |
|---|---|---|---|
| IFN-γ (pg/ml) | 0.78 (0.64–2.98) | 0.64 (0.64–1.84) | 0.403 |
| IL-6 (pg/ml) | 29.08 (4.69–189.1) | 0.64 (0.64–7.7) | <0.0001 |
| IL-8 (pg/ml) | 11.99 (2.41–37.81) | 1.15 (0.64–5.54) | <0.0001 |
| IL-10 (pg/ml) | 30.45 (13.16–70.25) | 6.29 (1.16–23.78) | <0.0001 |
| IL-12 (pg/ml) | 0.64 (0.55–1.48) | 0.64 (0.61–1.21) | 0.591 |
| TNF-α (pg/ml) | 21.72 (15.47–33.69) | 19.73 (11.78–30.77) | 0.147 |
Results of the logistic regression analysis regarding the outcome
| Variable | Outcome | ||
|---|---|---|---|
| Odds Ratio | 95% CI | p value | |
| IFN-γ | 0.8594 | 0.7494 to 0.9856 | 0.0302 |
| IL-10 | 1.0122 | 1.0026 to 1.0219 | 0.0126 |
| IL-12 | 1.0513 | 0.9849 to 1.1223 | 0.1330 |
| IL-6 | 1.0046 | 1.0008 to 1.0093 | 0.0399 |
| IL-8 | 1.0430 | 1.0175 to 1.0693 | 0.0009 |
| TNF-α | 1.0054 | 0.9626 to 1.0501 | 0.8085 |
Clinical and demographic characteristics of the cohort, grouped by disease severity
| Parameter | Non-severe (n = 94) | Severe (n = 87) | p value |
|---|---|---|---|
| Female sex | 44 | 35 | 0.229 |
| Male sex | 50 | 52 | |
| Age (median) | 64 (21–86) | 64 (24–90) | 0.575 |
| Length of stay (days) | 12 (1–32) | 14 (4–36) | <0.001 |
| Hypoxemia requiring oxygen therapy | 49 (52.12%) | 85 (97.7%) | <0.001 |
| Comorbidities | |||
| Arterial hypertension | 56 (59.57%) | 54 (62%) | 0.424 |
| Cardiovascular diseases | 22 (23.4%) | 18 (20.68%) | 0.398 |
| Insulin-dependent diabetes | 6 (6.38%) | 15 (17.24%) | 0.230 |
| Non-insulin-dependent diabetes | 14 (14.89%) | 11 (12.64%) | 0.413 |
| COPD | 3 (3.19%) | 2 (2.29%) | 0.537 |
| Asthma | 4 (4.25%) | 4 (4.59%) | 0.596 |
| Hyperlipidemia | 30 (31.91%) | 25 (28.73%) | 0.381 |
| Obesity | 25 (26.59%) | 38 (43.67%) | 0.012 |
| Chronic renal disease | 3 (3.19%) | 8 (9.19%) | 0.083 |
| ICU transfer | 8 (8.51%) | 27 (31.03%) | <0.001 |
| Outcome | |||
| Discharged | 87 (92.55%) | 70 (80.45%) | 0.014 |
| Died | 7 (7.44%) | 17 (19.54%) | |
Results of the logistic regression analysis regarding ICU transfer
| Variable | ICU transfer | ||
|---|---|---|---|
| Odds Ratio | 95% CI | p value | |
| IFN-γ | 0.9212 | 0.8257 to 1.0278 | 0.1419 |
| IL-10 | 1.0114 | 1.0018 to 1.0210 | 0.0196 |
| IL-12 | 0.9977 | 0.9287 to 1.0719 | 0.9503 |
| IL-6 | 1.0080 | 1.0006 to 1.0164 | 0.0409 |
| IL-8 | 1.0353 | 1.0121 to 1.0590 | 0.0026 |
| TNF-α | 0.9871 | 0.9508 to 1.0248 | 0.4959 |
Results of the logistic regression analysis regarding the disease severity
| Variable | Disease severity | ||
|---|---|---|---|
| Odds Ratio | 95% CI | p value | |
| IFN-γ | 0.9505 | 0.8830 to 1.0232 | 0.1769 |
| IL-10 | 1.0070 | 0.9980 to 1.0161 | 0.1297 |
| IL-12 | 1.0395 | 0.9661 to 1.1184 | 0.2995 |
| IL-6 | 0.9994 | 0.9974 to 1.0015 | 0.5799 |
| IL-8 | 1.0364 | 1.0008 to 1.0743 | 0.0414 |
| TNF-α | 1.0072 | 0.9797 to 1.0355 | 0.6103 |
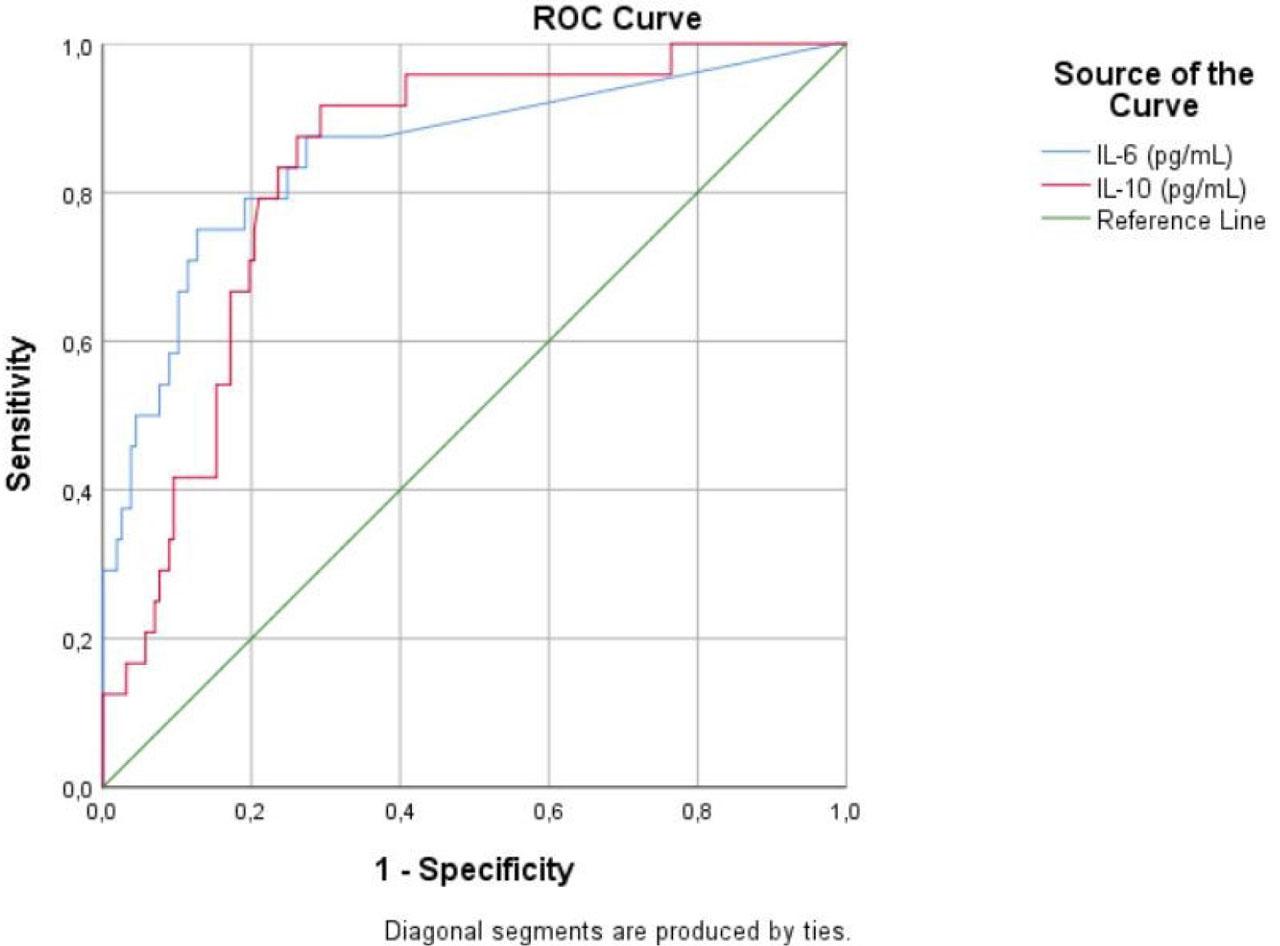
Cut-off values and ROC analysis for biomarkers with statistical significance in predicting outcome in COVID-19 patients
| Parameter | Cut-off value | AUC (95% CI) | p value | Sensitivity (%) | Specificity (%) |
|---|---|---|---|---|---|
| IL-6 | 20.14pg/ml | 0.853 (0.793–0.901) | <0.0001 | 75.00 | 87.26 |
| IL-10 | 18.00pg/ml | 0.831 (0.768–0.882) | <0.0001 | 91.67 | 70.70 |
Serum cytokine levels in survivors vs_ non-survivors
| Survivor (n = 157) | Non-survivor (n = 24) | p value | |
|---|---|---|---|
| IFN-γ (pg/ml) | 0.64 (0.64–1.87) | 0.94 (0.57–2.97) | 0.662 |
| IL-6 (pg/ml) | 0.64 (0.64–7.85) | 38.56 (15.24–714.3) | <0.0001 |
| IL-8 (pg/ml) | 1.1 (0.64–5.41) | 18.89 (7.49–54.89) | <0.0001 |
| IL-10 (pg/ml) | 6.76 (0.64–23.82) | 42.45 (27.19–80.85) | <0.0001 |
| IL-12 (pg/ml) | 0.64 (0.59–1) | 0.93 (0.57–2.54) | 0.054 |
| TNF-α (pg/ml) | 18.98 (12.29–29.47) | 25.8 (18.65–35.97) | 0.013 |