
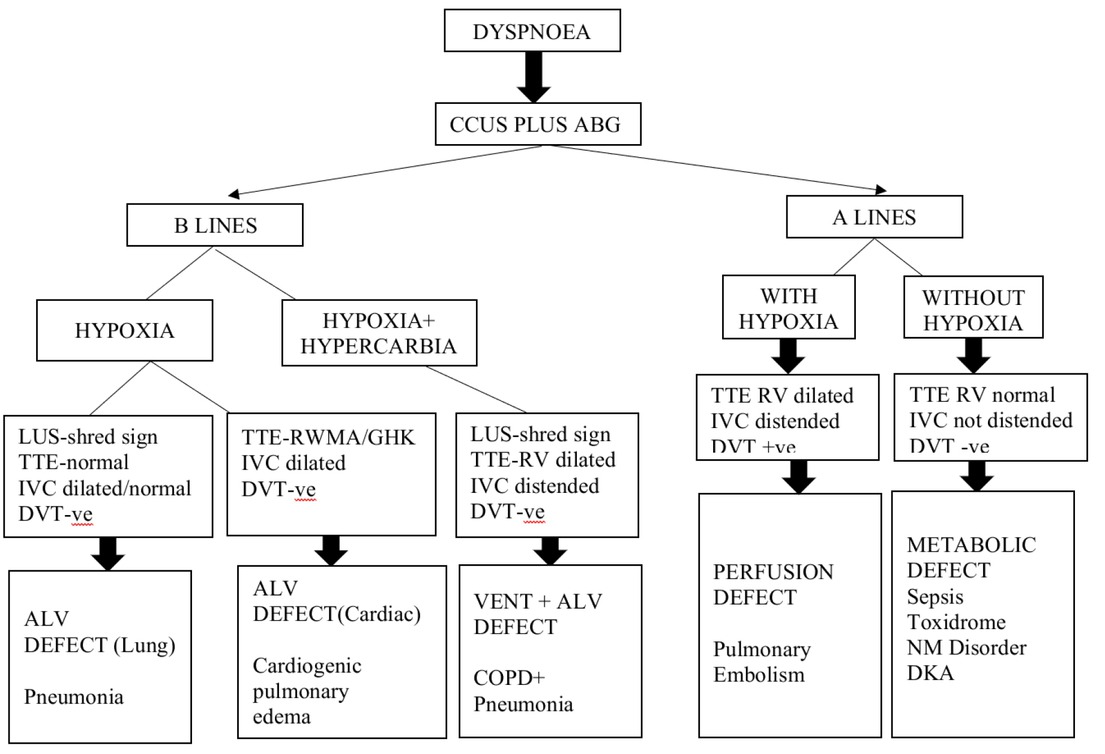
Fig. 1
Critical Care Ultrasonography plus arterial blood gas analysis based algorithm
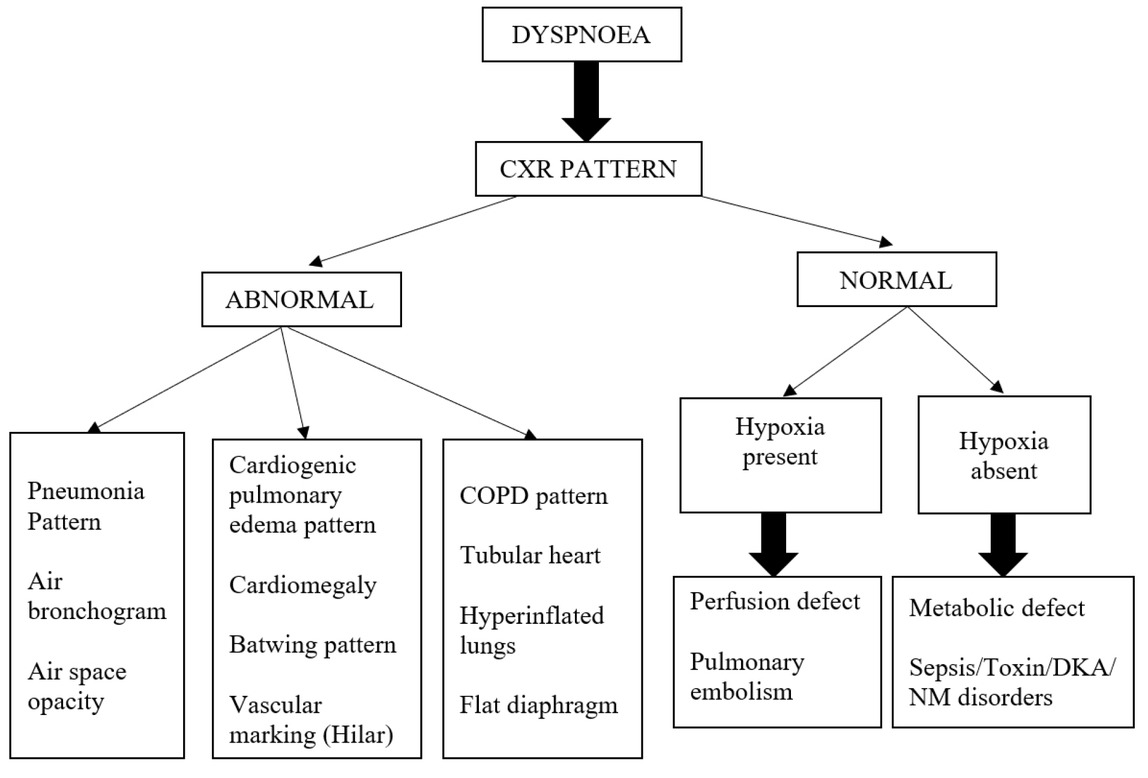
Fig. 2
Chest X ray based algorithm
Table 1
Distribution of participants by their demographic and other characteristics
| Characteristic | N = 174 |
|---|---|
| Gender n (%) | |
| F -n (%) | 67 (38.5%) |
| Source n(%) | |
| CCU (Coronary care unit) | 4 (2.3%) |
| CTVS surgery) (Cardiothoracic ward vascular | 2 (1.1%) |
| ED (Emergency department) | 105 (60.3%) |
| ENT (Ear nose throat) ward | 1 (0.6%) |
| EW (Eye ward) | 1 (0.6%) |
| MW (Medicine ward) | 51 (29.3%) |
| Mode of ventilation n (%) | |
| Facemask/NRBM/HFNO | 11 (6.3%) |
| NIV | 74 (42.5%) |
| CCUS based DX n (%) | |
| Alveolar (lung) defect | 69 (39.7%) |
| Alveolar (cardiac) defect | 60 (34.5%) |
| Ventilation plus alveolar defect | 19 (10.9%) |
| Perfusion defect | 4 (2.3%) |
| CXR based DX n (%) | |
| Alveolar (lung) defect | 71 (40.8%) |
| Alveolar(cardiac) defect | 69 (39.7%) |
| Ventilation plus alveolar defect | 5 (2.9%) |
| Perfusion defect | 24 (13.8%) |
| Metabolic defect | 5 (2.9%) |
| Need of vasopressors on day 1 n (%) | 137 (78.7%) |
| Composite diagnosis n (%) | |
| Alveolar (lung) defect | 63 (36.2%) |
| Alveolar(cardiac) defect | 55 (31.6%) |
| Ventilation plus alveolar defect | 18 (10.3%) |
| Perfusion defect | 6 (3.4%) |
| Outcome n (%) | |
| Discharged | 115 (66.1%) |
| Death | 59 (33.9%) |
Table 2
Agreement of CCUS and CXR with Composite Diagnosis
| Characteristic | Alveolar (lung) defect N = 63 | Alveolar (cardiac) defect N = 55 | Ventilation plus alveolar defect N = 18 | Perfusion defect N = 6 | Metabolic defect N = 32 |
|---|---|---|---|---|---|
| CCUS based DX | |||||
| Alveolar (lung) defect | 54 (85.7%) | 3 (5.5%) | 3 (16.7%) | 0 (0.0%) | 9 (28.1%) |
| Alveolar(cardiac) defect | 5 (7.9%) | 52 (94.5%) | 0 (0.0%) | 0 (0.0%) | 3 (9.4%) |
| Ventilation plus alveolar defect | 2 (3.2%) | 0 (0.0%) | 15 (83.3%) | 2 (33.3%) | 0 (0.0%) |
| Perfusion defect | 0 (0.0%) | 0 (0.0%) | 0 (0.0%) | 4 (66.7%) | 0 (0.0%) |
| CXR based DX | |||||
| Alveolar (lung) defect | 53 (84.1%) | 5 (9.1%) | 10 (55.6%) | 0 (0.0%) | 3 (9.4%) |
| Alveolar(cardiac) defect | 8 (12.7%) | 50 (90.9%) | 3 (16.7%) | 3 (50.0%) | 5 (15.6%) |
| Ventilation plus alveolar defect | 1 (1.6%) | 0 (0.0%) | 4 (22.2%) | 0 (0.0%) | 0 (0.0%) |
| Perfusion defect | 1 (1.6%) | 0 (0.0%) | 1 (5.6%) | 3 (50.0%) | 19 (59.4%) |
| Metabolic defect | 0 (0.0%) | 0 (0.0%) | 0 (0.0%) | 0 (0.0%) | 5 (15.6%) |
Table 3
Agreement of CCUS with CXR
| Characteristic | Alveolar (lung) defect N = 69 | Alveolar (cardiac) defect N = 60 | Ventilation plus alveolar defect N = 19 | Perfusion defect N = 4 | Metabolic defect N = 22 |
|---|---|---|---|---|---|
| CXR based DX | |||||
| Alveolar (lung) defect | 53 (76.8%) | 8 (13.3%) | 8 (42.1%) | 0 (0.0%) | 2 (9.1%) |
| Alveolar(cardiac) defect | 12 (17.4%) | 50 (83.3%) | 5 (26.3%) | 2 (50.0%) | 0 (0.0%) |
| Ventilation plus alveolar defect | 1 (1.4%) | 0 (0.0%) | 4 (21.1%) | 0 (0.0%) | 0 (0.0%) |
| Perfusion defect | 2 (2.9%) | 2 (3.3%) | 2 (10.5%) | 2 (50.0%) | 16 (72.7%) |
| Metabolic defect | 1 (1.4%) | 0 (0.0%) | 0 (0.0%) | 0 (0.0%) | 4 (18.2%) |
Table 4
Correlation of CCUS based algorithm/ Chest X ray based algorithm vs Composite diagnosis
| Sensitivity | Specificity | PPV | Cohn’s Kappa | ||
|---|---|---|---|---|---|
| 1 | CCUS vs Composite diagnosis (Alveolar- Pneumonia) | 85.71% (75.03-92.3) | 86.49% (78.9-91.64) | 78.26 (67.18-86.36) | 0.7074 (0.5593-0.8566) |
| 2 | CxR vs Composite diagnosis (Alveolar- Pneumonia) | 84.13% (73.91-91.14) | 83.78% (75.82-89.94) | 74.65 (63.45-83.30) | 0.661 (0.5131-0.8088) |
| 3 | CCUS vs CxR (Alveolar- Pneumonia) | 0.59 (0.44-0.74) | |||
| 4 | CCUS vs Composite diagnosis (Alveolar- Cardiogenic Pulmonary Edema) | 94.55% (85.15-98.13) | 93.28% (87.28-98.55) | 86.67 (75.83-93.08) | 0.8573 (0.709-1.006) |
| 5 | CxR vs Composite diagnosis (Alveolar- Cardiogenic Pulmonary Edema) | 90.91% (80.42-96.05) | 84.03% (76.4-89.53) | 72.46 (60.95-81.61) | 0.7014 (0.551-0.8477) |
| 6 | CCUS vs CxR (Alveolar- Cardiogenic Pulmonary Edema) | 0.6438 (0.49-0.75) | |||
| 7 | CCUS (Ventilation vs Composite with Alveolar diagnosis defect) | (60.7883.33-94.16% ) | (93.5997.44-% 99) | (56.6778.95 -91.49) | (0.13980.7883 -0.9368) |
| 8 | CxR vs Composite diagnosis (Ventilation with Alveolar defect) | 22.22% (9.001-45.22) | 99.36% (96.46-99.89) | 80 (37.55-96.38) | 0.3171 (0.1973-0.4369) |
| 9 | CCUS vs CxR (Ventilation with Alveolar defect) | 0.3016 (0.18-0.41) | |||
| 10 | CCUS vs Composite diagnosis ( Perfusion defect) | 66.67% (30-90.32) | 100% (97.76-100) | 100 (51.01-100) | 0.7943 (0.6489-0.9397) |
| 11 | CxR vs Composite diagnosis ( Perfusion defect) | 50% (18.78-81.24) | 87.5% (81.65-91.68) | 12.5 (4.344-31) | 0.1553 (0.0385-0.2681) |
| 12 | CCUS vs CxR (Perfusion defect) | 0.10 (0.08-0.207) | |||
| 13 | CCUS vs Composite diagnosis (Metabolic defect) | 62.65% (45.25-77.07) | 98.59% (95.01-99.69) | 90.91 (72.98-97.47) | 0.695 (0.55-0.840) |
| 14 | CxR vs Composite diagnosis (Metabolic defect) | 15.63% (6.864-31.75) | 100 (97.37-100) | 100 (96.55-100) | 0.2321 (0.1369-0.3273) |
| 15 | CCUS vs CxR (Metabolic defect) | 0.28 (0.15-0.37) |