
Table 1
Univariate analysis and cohort description according burnout
| Characteristics | Low and moderate BOS N = 167 | Severe BOS N = 41 | p-value | Total N = 208 | |
|---|---|---|---|---|---|
| Sex | |||||
| Women | 116 (69.9) | 36 (87.8) | 0.033 | 152 (73.4) | |
| Men | 50 (30.1) | 5 (12.2) | 55 (26.6) | ||
| Marital status | |||||
| Single | 71 (43.3) | 8 (19.5) | 0.009 | 79 (38.5) | |
| Engaged | 93 (56.7) | 33 (80.5) | 126 (61.5) | ||
| Job | |||||
| Other | 63 (37.7) | 12 (29.3) | 75 (36.1) | ||
| Reinforcement | 9 (5.4) | 7 (17.1) | 0.012 | 16 (7.7) | |
| Nurse | 71 (42.5) | 21 (52.1) | 92 (44.2) | ||
| Doctors | 24 (14.4) | 1 (2.4) | 25 (12) | ||
| Initial Department | |||||
| Other | 22 (13.3) | 2 (4.9) | 24 (11.7) | ||
| Operatory room | 34 (20.6) | 10 (24.4) | 44 (21.4) | ||
| Trauma room | 4 (2.4) | 0 (0) | 0.028 | 4 (2) | |
| Intensive Care Unit | 84 (50.9) | 23 (56.1) | 107 (51.9) | ||
| Recovery room | 1 (0.6) | 4 (9.8) | 5 (2.4) | ||
| Intermediate care unit | 20 (12.2) | 2 (4.9) | 22 (10.7) | ||
| Volunteer | |||||
| Yes | 63 (38.7) | 3 (7.3) | <0.001 | 66 (32.4) | |
| Not concerned | 73 (44.8) | 22 (53.7) | 95 (46.6) | ||
| Medical history of psychological disorders | |||||
| Yes, before COVID-19 | 13 (7.8) | 2 (4.9) | 0.029 | 15 (7.2) | |
| Yes, after COVID-19 | 2 (1.2) | 4 (9.8) | 6 (2.9) | ||
| Fear of being infected | |||||
| Yes | 71 (43.3) | 26 (63.4) | 0.033 | 97 (47.3) | |
| Management of dead patient during 1st wave | |||||
| Yes | 84 (77.8) | 24 (22.2) | 0.44 | 108 (51.9) | |
| Thinks he might needs psychological help | <0.001 | ||||
| Yes | 10 (6.1) | 17 (42.5) | 27 (13.2) | ||
| Thinks that institutional psychological supports are sufficient | 0.113 | ||||
| Yes | 69 (85.2) | 12 (14.8) | 81 (44.3) | ||
| Consult a psychologist in town | |||||
| Yes | 4 (2.4) | 6 (14.6) | 0.005 | 10 (4.8) | |
| Describe ICU experience as a trauma | <0.001 | ||||
| Yes | 9 (20.9) | 8 (88.9) | 17 (32.7) | ||
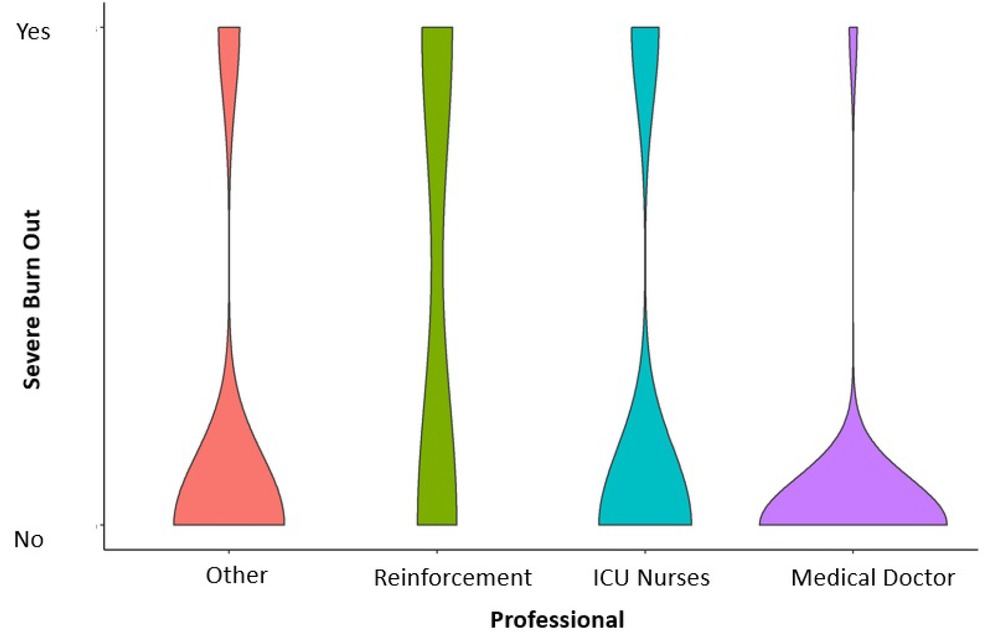
Fig. 1
Distribution of severe bornout syndrom according to job occupation
Table 2
Multivariate analysis
| Variable | Units | Odds Ratio | CI.95 | p-value | |
|---|---|---|---|---|---|
| Marital status | Single | Ref | |||
| Engaged | 3.61 | [1.44 ;9.09] | 0.006303 | ||
| Job | Doctors | Ref | |||
| Other | 6.13 | [0.70;53.90] | 0.102214 | ||
| Reinforcement | 37.71 | [3.13;454.35] | 0.004254 | ||
| Nurses | 7.09 | [0.85;59.30] | 0.070504 | ||
| Management of dead patient during 1st wave | No | Ref | |||
| Yes | 1.94 | [0.88;4.30] | 0.100296 | ||
| Thinks that institutional psychological supports are sufficient | Yes | Ref | |||
| No | 1.87 | [0.84;4.17] | 0.123360 | ||
| Volunteer | Not concerned | Ref | |||
| No | 1.02 | [0.41;2.50] | 0.970734 | ||
| Yes | 0.10 | [0.02;0.46] | 0.002885 | ||
Table 3
Correlation table between Anxiety, Depression, Post Traumatic Stress Disorder and Emotional Exhaustion (EE), Depersonalization (DP), and the personal accomplishment (AP).
| PTSD | Anxiety | Depressive symptomatology | ||
|---|---|---|---|---|
| EE | 0.67 | [0.59;0.74] | 0.69 [0.61;0.76] | 0.67 [0.59;0.74] |
| DP | 0.47 [0.35;0.57] | 0.46 [0.35;0.56] | 0.37 [0.24;0.48] | |
| AP | -0.25 [-0.37;-0.11] | -0.24 [-0.37;-0.11] | -0.41 [-0.51;-0.28] |