
Table 1
Characteristics of patients
| All patients N=310 | VTE N=41 | No VTE N=269 | P value | |
|---|---|---|---|---|
| Age (years), mean±SD | 60.1±15.1 | 58.8±15.7 | 60.3±15.1 | 0.56 |
| Male gender, N (%) | 233 (75.2) | 30 (73.2) | 203 (75.5) | 0.75 |
| Body mass index* (kg/m2), median (Q1, Q3) | 28.9 (25.0, 34.1) | 27.1 (24.4, 33.3) | 29.1 (25.1, 34.2) | 0.32 |
| No obesity < 30 kg/m2, N (%) | 169 (55.6) | 25 (62.5) | 144 (54.5) | |
| Obesity 30-39.9 kg/m2, N (%) | 110 (36.2) | 10 (25.0) | 100 (37.9) | 0.22 |
| Obesity ≥ 40 kg/m2, N (%) | 25 (8.2) | 5 (12.5) | 20 (7.6) | |
| Comorbid conditions, N (%) | ||||
| Hypertension | 173 (56.0) | 22 (53.7) | 151 (56.3) | 0.75 |
| Diabetes | 173 (56.0) | 22 (53.7) | 151 (56.3) | 0.75 |
| Congestive heart failure | 22 (7.1) | 1 (2.4) | 21 (7.8) | 0.21 |
| COPD | 10 (3.2) | 0 (0) | 10 (3.7) | 0.21 |
| Bronchial asthma | 18 (5.8) | 6 (14.6) | 12 (4.5) | 0.02 |
| Chronic kidney disease | 36 (11.7) | 3 (7.3) | 33 (12.3) | 0.35 |
| Hemodialysis | 11 (3.6) | 11 (3.6) | 9 (3.4) | 0.63 |
| Previous VTE, N (%) | 11 (3.5) | 1 (2.4) | 10 (3.7) | 1.0 |
| History of thrombophilia | 9 (2.9) | 1 (2.4) | 8 (3.0) | 1.0 |
| Prior anticoagulation | 20 (6.5) | 2 (4.9) | 18 (6.7) | 1.0 |
| GCS on admission, mean±SD | 12.3±4.5 | 11.5±4.9 | 12.5±4.4 | 0.21 |
| SOFA on admission, mean±SD | 6.1±3.9 | 6.5±3.9 | 6.0±3.9 | 0.52 |
| SOFA at day 7, mean±SD | 6.8±4.3 | 7.2±3.6 | 6.7±4.4 | 0.45 |
| Pertinent laboratory findings on admission | ||||
| Creatinine (μmol/L), median (Q1, Q3) | 93.0 (73.0, 144.5) | 103.0 (71.5, 139.5) | 93.0 (73.0, 146.8) | 0.97 |
| WBC x 109/L, median (Q1, Q3) | 9.82 (6.65, 13.80) | 10.80 (7.37, 16.10) | 9.81 (6.51, 13.75) | 0.22 |
| Neutrophils | 7.94 (4.95, 11.55) | 7.82 (5.45, 11.70) | 7.95 (4.88, 11.54) | 0.51 |
| Lymphocytes | 0.93 (0.63, 1.41) | 0.89 (0.62, 1.32) | 0.94 (0.64, 1.42) | 0.54 |
| Admission hemoglobin (g/L), mean±SD | 129±24 | 132±25 | 128±24 | 0.37 |
| Admission platelets x 109/L, mean±SD | 279±120 | 291±137 | 278±117 | 0.51 |
| PTT in seconds, median (Q1, Q3) | 29.1 (26.5, 32.6) | 28.5 (26.0, 32.8) | 29.3 (26.5, 32.6) | 0.61 |
| INR, median (Q1, Q3) | 1.10 (1.04, 1.18) | 1.12 (1.06, 1.30) | 1.10 (1.03, 1.18) | 0.12 |
| Lactate (mmol/L), mean±SD | 2.6±2.4 | 3.1±3.2 | 2.5±2.3 | 0.31 |
| Lactate dehydrogenase (U/L), median (Q1, Q3) | 553.0 (430.0, 749.0) | 615.0 (412.0, 837.0) | 544.5 (437.5, 731.5) | 0.23 |
| Fibrinogen (g/L), median (Q1, Q3) | 5.22 (3.81, 6.92) | 4.05 (2.62, 6.07) | 5.49 (3.97, 7.06) | 0.003 |
| D-Dimer (mg/L), median (Q1, Q3) | 1.70 (0.80, 4.05) | 3.86 (1.28, 14.43) | 1.47 (0.77, 3.72) | 0.001 |
| D-Dimer/fibrinogen ratio | 1.9±5.3 | 4.2±8.7 | 1.5±4.5 | 0.14 |
| Key interventions in the ICU before VTE | ||||
| Central venous catheter | 206 (66.5) | 33 (80.5) | 173 (64.3) | 0.04 |
| Internal jugular | 156 (50.3) | 26 (63.4) | 130 (48.3) | |
| Subclavian | 13 (4.2) | 3 (7.3) | 10 (3.7) | 0.20 |
| Femoral | 34 (11.0) | 4 (9.8) | 30 (11.2) | |
| Vasopressor use, N (%) | 138 (44.7) | 27 (67.5) | 111 (41.3) | 0.002 |
| Invasive mechanical ventilation, N (%) | 208 (67.1) | 33 (80.5) | 175 (65.1) | 0.05 |
| PaO2/FiO2 ratio before intubation, median (Q1, Q3) | 92.5 (66.5, 164.3) | 90.0 (78.7, 214.5) | 95.8 (63.0, 153.0) | 0.17 |
| Renal replacement therapy, N (%) | 67 (21.6) | 11 (26.8) | 56 (20.8) | 0.38 |
[i] APACHE: Acute Physiology and Chronic Health Evaluation; COPD: chronic obstructive pulmonary disease; CT: computed tomography; GCS: Glasgow Coma Scale; INR: International Normalized Ratio; PaO2/ FiO2 ratio is the ratio of arterial oxygen partial pressure (PaO2 in mmHg) to fractional inspired oxygen; PTT: Partial Thromboplastin Time; Q1: first quartile; Q3: third quartile; SD: standard deviation; SOFA: Sequential Organ Failure Assessment; VTE: venous thromboembolism. Variables with skewed distribution were presented as median with the first third quartiles. The Mann-Whitney U test was used to compare the two groups. *6 patients had missing BMI.
Table 2
VTE prophylaxis practices
| Variables | All patients N=310 | VTE N=41 | No VTE N=269 | P value |
|---|---|---|---|---|
| UFH, N (%) | 115 (37.1) | 15 (36.6) | 100 (37.2) | 0.94 |
| Standard dose (5000 U 12 hrly) | 53 (46.1)* | 8 (53.3)* | 45 (45.0)* | 0.59 |
| standard dose (5000 U 8 hrly) | 53 (46.1)* | 4 (26.7)* | 49 (49.0)* | 0.16 |
| LMWH, N (%) | 185 (59.7) | 23 (56.1) | 162 (60.2) | 0.62 |
| standard dose* | 104 (56.2)* | 11 (47.8)* | 93 (57.4)* | 0.50 |
| Intermediate dose*¶ | 57 (30.8)* | 3 (13.0)* | 54 (33.3)* | 0.055 |
| Therapeutic dose* | 24 (13.0)* | 9 (39.1)* | 15 (9.3)* | <0.001 |
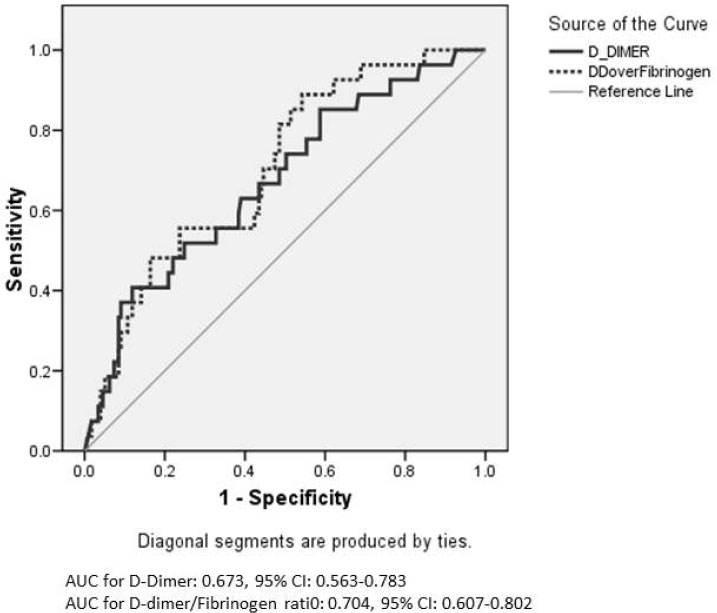
Fig. 1
Receiver operating characteristic (ROC) curve for admission D-dimer and D-dimer/fibrinogen ratio for the diagnosis of clinically suspected and confirmed venous thromboembolism
Table 3
Outcomes of patients in the cohort
| Variables | All patients N=310 | VTE N=41 | No VTE N=269 | P value |
|---|---|---|---|---|
| ICU LOS (days), median (Q1, Q3) | ||||
| All patients | 10.0 (5.0, 18.0) | 13.0 (7.0, 25.5) | 10.0 (4.5, 17.0) | 0.04 |
| ICU Mortality, N (%) | 123 (39.8) | 12 (29.3) | 111 (41.4) | 0.14 |
| Hospital mortality, N (%) | 147 (47.4) | 13 (31.7) | 134 (49.8) | 0.03 |
[i] ICU: intensive care unit; LOS: length of stay; MV: mechanical ventilation; Q1: first quartile; Q3: third quartile; RRT: renal replacement therapy; VTE: venous thromboembolism; Variables with skewed distribution were presented as median with the first third quartiles. The Mann-Whitney; U test was used to compare the two groups.