
Fig.1
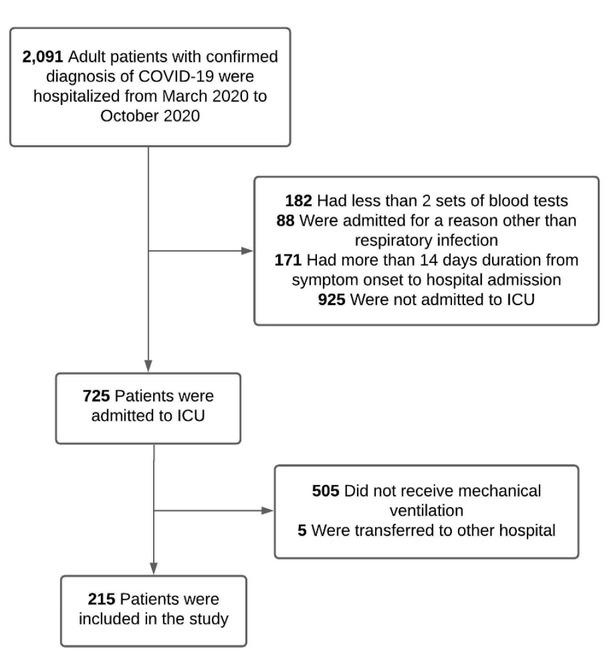
Fig. 2
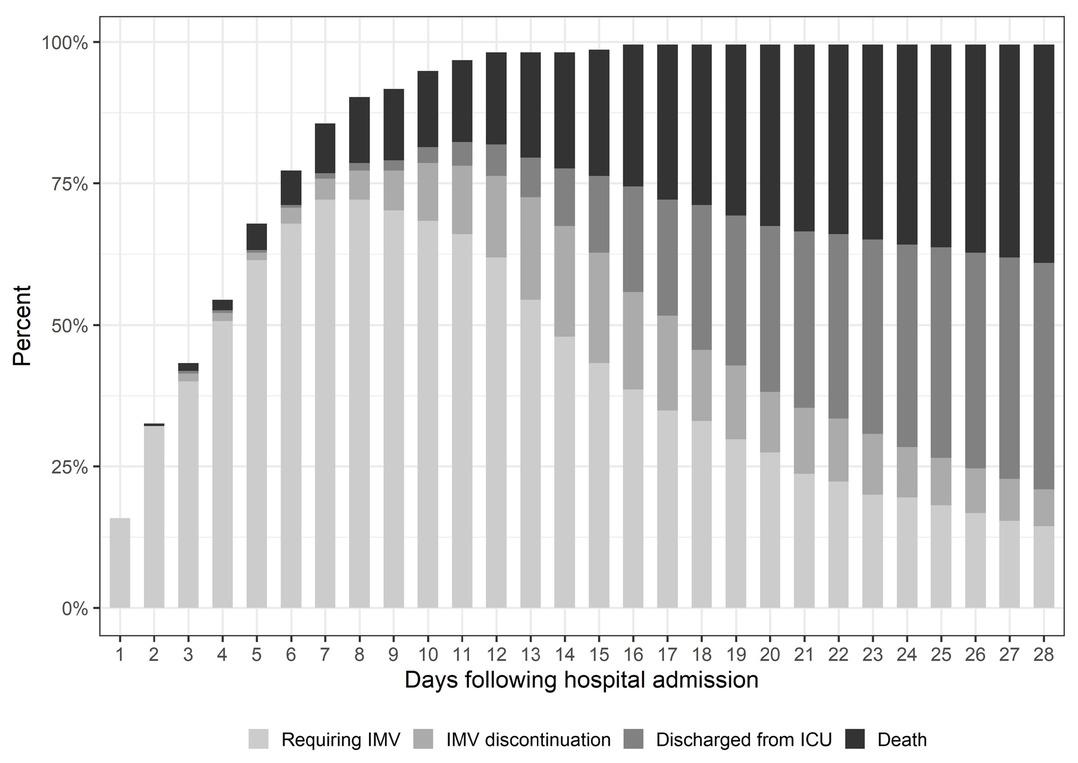
Fig. 3
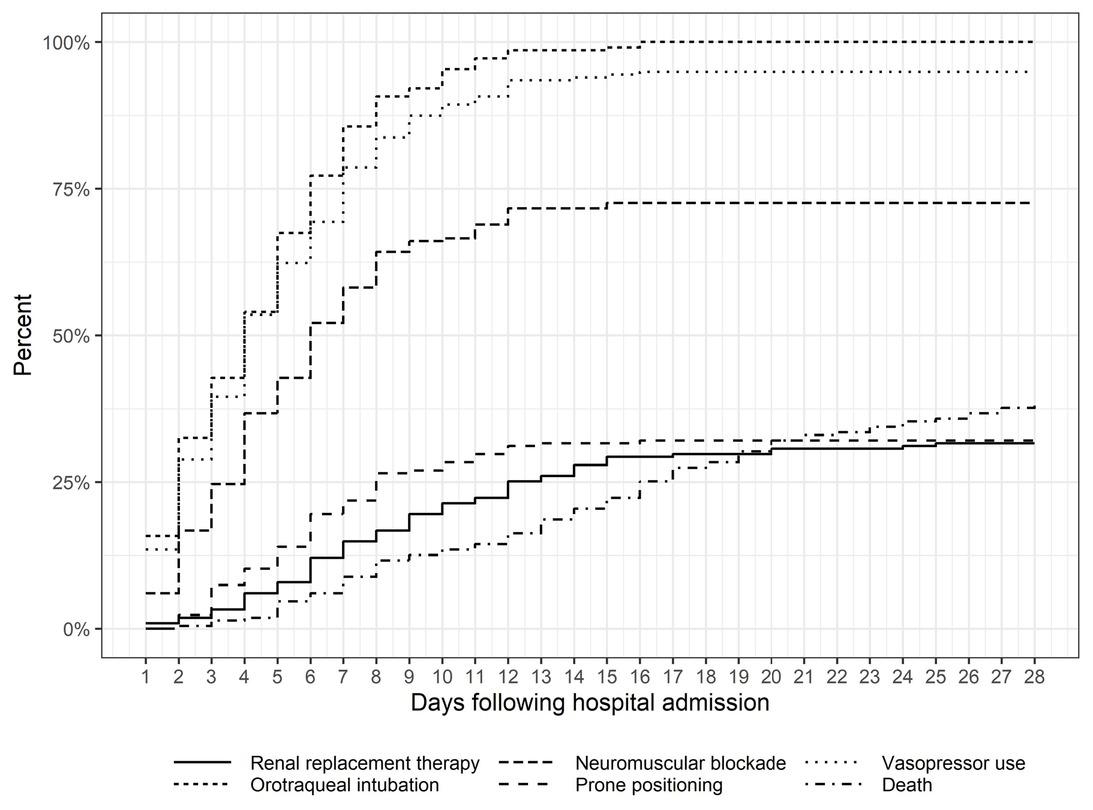
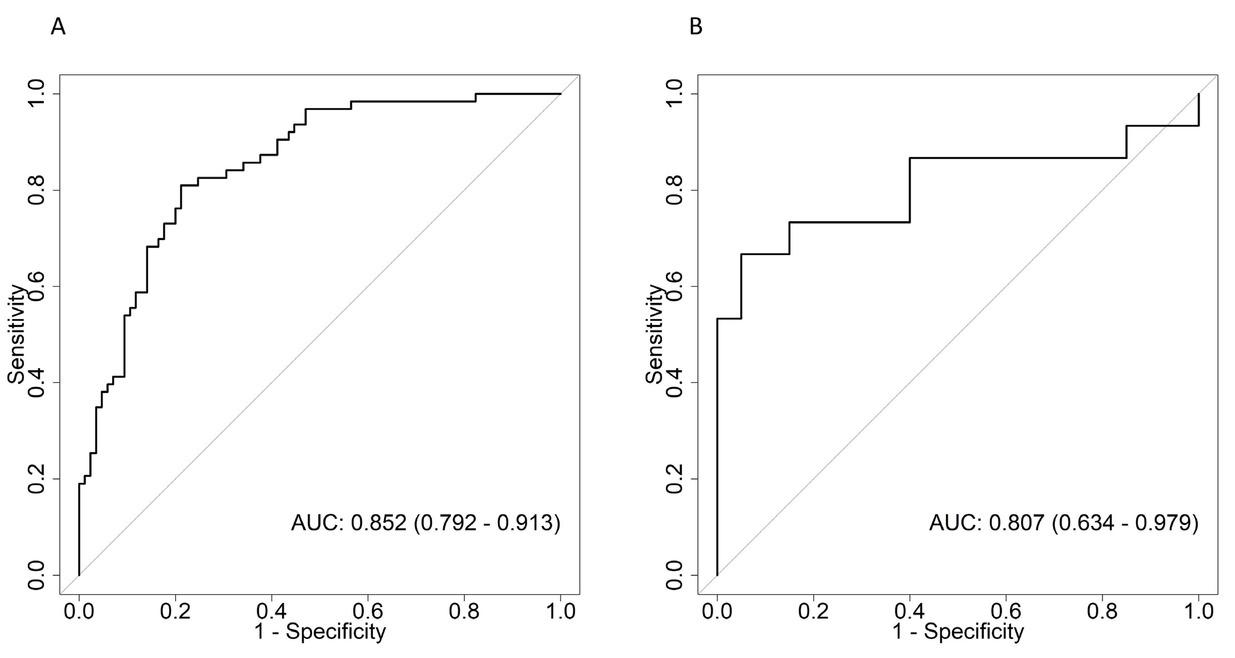
Fig. 4
Laboratory biomarkers measurements obtained at hospital admission_
| Variable | Overall | Discharged from | Died in ICU | P-value |
|---|---|---|---|---|
| CRP | 113 [55; 201] | 112 [44; 184] | 118 [58; 221] | 0.165 |
| LDH | 380 [281; 510] | 364 [269; 460] | 416 [294; 536] | 0.177 |
| Creatinine | 1.0 [0.9; 1.4] | 1.0 [0.8; 1.2] | 1.1 [0.9; 1.6] | 0.002 |
| Lymphocyte count | 904 [651; 1266] | 932 [718; 1284] | 829 [545; 1244] | 0.021 |
| Neutrophil count | 5050 [3462; 7480] | 4812 [3407; 6860] | 5346 [3497; 9044] | 0.301 |
| Platelet count | 180 [138; 232] | 186 [142; 231] | 172 [136; 240] | 0.356 |
| D-dimer | 0.6 [0.4; 1.0] | 0.5 [0.3; 0.8] | 0.7 [0.4; 1.7] | 0.003 |
| LCR | 8 [4; 18] | 9 [4; 25] | 6 [3; 14] | 0.019 |
| NLR | 6 [3; 11] | 5 [3; 9] | 7 [4; 14] | 0.005 |
Baseline characteristics of study patients_
| Variable | Overall | Discharged from | Died in ICU | P-value |
|---|---|---|---|---|
| Female gender | 69 (32.1) | 34 (28.6) | 35 (36.5) | 0.242 |
| Age, years | 62.7 ± 15.4 | 56.9 ± 13.9 | 69.9 ± 14.2 | < 0.001 |
| Comorbidities | ||||
| Hypertension | 135 (62.8) | 68 (57.1) | 67 (69.8) | 0.066 |
| Diabetes | 86 (40.0) | 41 (34.5) | 45 (46.9) | 0.070 |
| COPD | 15 (7.0) | 3 (2.5) | 12 (12.5) | 0.006 |
| Smoking | 3 (1.4) | 0 (0.0) | 3 (3.1) | 0.087 |
| Obesity | 109 (50.7) | 75 (63.0) | 34 (35.4) | <0.001 |
| Heart failure | 15 (7.0) | 2 (1.7) | 13 (13.5) | < 0.001 |
| Cirrhosis | 1 (0.5) | 0 (0.0) | 1 (1.0) | 0.447 |
| Stroke | 6 (2.8) | 0 (0.0) | 6 (6.2) | 0.007 |
| Bariatric surgery | 2 (0.9) | 2 (1.7) | 0 (0.0) | 0.503 |
| Hyperlipidemia | 47 (21.9) | 23 (19.3) | 24 (25.0) | 0.325 |
| Dementia | 5 (2.3) | 1 (0.8) | 4 (4.2) | 0.175 |
| Autoimmune disorder | 1 (0.5) | 1 (0.8) | 0 (0.0) | 1.000 |
| HIV | 4 (1.9) | 3 (2.5) | 1 (1.0) | 0.630 |
| Solid neoplasm | 5 (2.3) | 3 (2.5) | 2 (2.1) | 1.000 |
| Hematological neoplasm | 3 (1.4) | 1 (0.8) | 2 (2.1) | 0.587 |
| Asthma | 12 (5.6) | 8 (6.7) | 4 (4.2) | 0.554 |
| Non-dialysis CKD | 14 (6.5) | 6 (5.0) | 8 (8.3) | 0.408 |
| CKD on dialysis | 6 (2.8) | 2 (1.7) | 4 (4.2) | 0.411 |
| Coronary artery disease | 24 (11.2) | 10 (8.4) | 14 (14.6) | 0.192 |
| Duration from symptom onset to hospital admission, days | 7 [5; 9] | 7 [5; 9] | 6 [5; 8] | 0.084 |
| BMI | 30.1 [26.6; 34.2] | 31.2 [28.3; 35] | 28.3 [25.5; 31.6] | <0.001 |
| SpO2 at hospital presentation | 91 [86; 95] | 92 [88; 96] | 90 [82.5; 95] | 0.075 |
| SAPS 3 score | 49 [44; 55] | 47 [42; 51] | 54 [48; 59] | < 0.001 |
| Duration from hospital admission to intubation date | 3 [1; 5] | 4 [1; 6] | 3 [1; 5] | 0.107 |
Laboratory biomarkers obtained at the date of intubation_
| Variable | Overall | Discharged from ICU | Died in ICU | P-value |
|---|---|---|---|---|
| CRP | 221 [143; 293] | 199 [139; 270] | 235 [155; 329] | 0.069 |
| LDH | 493 [400; 643] | 485 [387; 573] | 528 [429; 676] | 0.073 |
| Creatinine | 1.1 [0.8; 1.5] | 1.0 [0.8; 1.3] | 1.3 [1.0; 2.0] | < 0.001 |
| Limphocyte count | 866 [560; 1238] | 884 [586; 1264] | 793 [520; 1142] | 0.310 |
| Neutrophil count | 8039 [5322; 11509] | 6850 [5054; 10847] | 10014 [6690; 12617] | 0.005 |
| Platelet count | 228 [179; 300] | 240 [196; 302] | 206 [161; 284] | 0.025 |
| D-dimer | 1.1 [0.6; 2.3] | 0.9 [0.6; 1.6] | 1.2 [0.7; 2.4] | 0.301 |
| LCR | 4 [3; 8] | 4 [3; 8] | 4 [2; 7] | 0.124 |
| NLR | 10 [6; 16] | 8 [6; 13] | 12 [7; 19] | 0.004 |
Risk factors for in-hospital mortality_
| Variable | Estimate | Standard Error | Odds ratio (OR) | 95% CI | P value |
|---|---|---|---|---|---|
| Age, per year | 0.065 | 0.016 | 1.07 | 1.47 to 7.33 | < 0.001 |
| Creatinine at intubation day | 1.188 | 0.410 | 3.28 | 0.84 to 0.99 | 0.004 |
| BMI | -0.089 | 0.042 | 0.91 | 0.979 to 0.997 | 0.033 |
| Lowest PF ratio 48 hours post intubation | -0.012 | 0.005 | 0.988 | 1.14 to 23.65 | 0.011 |
| Barotrauma | 1.646 | 0.774 | 5.18 | 0.76 to 0.95 | 0.034 |
| Duration from symptom onset to intubation | -0.161 | 0.059 | 0.85 | 1.03 to 1.1 | 0.006 |
Suportive treatment received while in ICU and clinical outcomes_
| Variable | Overall | Discharged from ICU | Died in iCU | P-value |
|---|---|---|---|---|
| Non-invasive strategies prior to IMV | ||||
| NIV | 115 (53.5) | 69 (58.0) | 46 (47.9) | 0.182 |
| HFNC | 75 (34.9) | 38 (31.9) | 37 (38.5) | 0.386 |
| Prone positioning | 69 (32.1) | 36 (30.3) | 33 (34.4) | 0.619 |
| Neuromuscular blockade | 158 (73.5) | 88 (73.9) | 70 (72.9) | 0.988 |
| Nitric oxide | 6 (2.8) | 2 (1.7) | 4 (4.2) | 0.016 |
| ECMO | 7 (3.3) | 2 (1.7) | 5 (5.2) | 0.010 |
| Worst parameters within 48 hours post-IMV | ||||
| PEEP | 12 [10; 14] | 12 [10; 14] | 12 [10; 14] | 0.852 |
| P/F ratio | 126 [93.5; 162] | 140 [104; 174] | 110 [87; 138] | <0.001 |
| Renal replacement therapy | 71 (33) | 17 (14.3) | 54 (56.2) | <0.001 |
| Vasopressor use | 206 (95.8) | 113 (95.0) | 93 (96.9) | 0.722 |
| Pharmacological treatment | ||||
| Tocilizumab | 31 (14.4) | 25 (21) | 6 (6.3) | 0.004 |
| Corticosteroid | 109 (50.7) | 64 (53.8) | 45 (46.9) | 0.384 |
| Hydroxycloroquine | 71 (33) | 46 (38.7) | 25 (26) | 0.070 |
| Tracheostomy | 39 (18.1) | 20 (16.8) | 19 (19.8) | 0.699 |
| Reintubation | 22 (10.2) | 10 (8.4) | 12 (12.5) | 0.448 |
| Barotrauma | 18 (8.4) | 4 (3.4) | 14 (14.6) | 0.007 |
| Duration of NIV before IMV, days | 1 [1.0; 3.0] | 2 [1.0; 3.0] | 2 [1.0; 3.0] | 0.861 |
| Duration of HFNC before IMV, days | 1 [1.0; 2.0] | 1 [1.0; 3.0] | 1 [1.0; 2.0] | 0.677 |
| Duration of IMV, days | 10 [7; 18] | 10 [7; 16] | 11 [6; 19] | 0.876 |
| ICU length of stay, days | 15 [10; 24] | 17 [11.5; 25.5] | 13 [7; 21.2] | 0.002 |
| Hospital length of stay, days | 21 [15; 30] | 27 [19.5; 39.5] | 14.5 [7; 22.2] | <0.001 |
| Days from hospital admission to intubation | 3 [1.0; 5.0] | 4 [1.0; 5.5] | 3 [1.0; 5.0] | 0.111 |
| Days from symptom onset to intubation | 9 [7 – 12] | 10 [8.0 – 12.5] | 8.5 [6 – 12] | 0.005 |
| Ventilator-free days | 9 [3; 16] | 15 [11; 23.5] | 2 [0; 4.0] | <0.001 |