
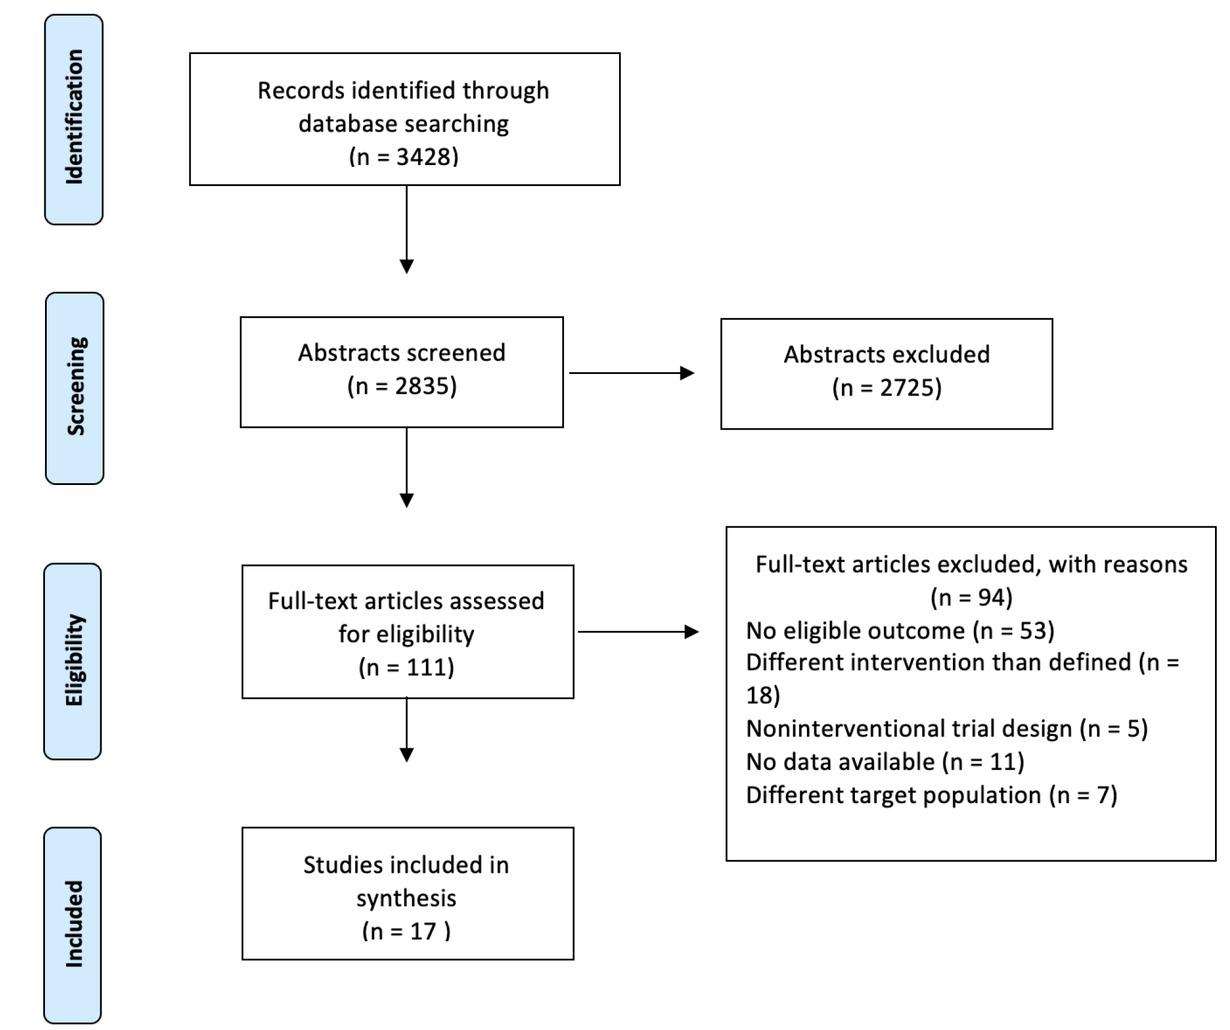
Fig 1
Included Adult Studies with outcome measures by intervention type, Not Passive or Passive
| Setting/ Year | Author | Emotional Outcome Tool mean result, control (95% CI) versus experimental (95% CI) | Satisfaction Outcomes Mean Results, control (SD) versus experimental (SD) | Resource Utilization Mean Results, control (SD) vs experimental (SD) | |||||||
|---|---|---|---|---|---|---|---|---|---|---|---|
| Adult- Not Passive | STAI | HADS | PHQ-9 | GAD-7 | C-DASS | IES-r PCL PPPC | FSICU-24 | LOS: ICU | LOS: Hospital | Cost of care (thousands) | |
| 2018 | White D, et al | 12.1 (11.54- 12.66) vs 11.7 (11.0412.36) | 20.7 (19.53 - 21.87) vs 1.8 (0.7) vs 20.5 (18.981.6 (0.6) 22.02) | 8.8 , (8.229.38) vs 8.1 (7.38- 8.82) ' ' | 15.5 (14.23 - 16.77) vs 11.8 (10.712.9) | ||||||
| 2016 | Curtis JR, et al | 4.7 vs 2.4 (-0.431-0.43) | 2.7 vs 1.8 (-3.11.32) | 30.6 vs 27.1 (-7.12- 0.10) | 21.4 vs 17.4 (-0.14- 0.46) | 32.6 vs 24.1 (0.24- 0.86) | ICU: 75.85 vs 51.1 (48.68--0.9) Hospital: 170.7 vs 123.1 (-90.48--4.67) | ||||
| 2007 | Lautrette A, et al | 17 (IQR 11-25) vs 11 (IQR 8-18) | 39 (IQR 25-48) vs 27 (IQR 18-42) | ||||||||
| 2008 | Kloos J and Daly B | 39.53 (36.23 - 42.83) vs 40.42 (37.83 - 43.01) | |||||||||
| 2020 | Amass T et al | 12.31 (10.94- 13.67) vs 13.16 (12.214.13) | 27.2 (23.56- 30.84) vs 12.3 (10.94- 13.67) | 85.44 (87.31- 91.95) vs 89.63 (83.14- 87.74) | |||||||
| Adult - Passive | |||||||||||
| 2004 | Moreau D, et al | Total 21 (ND) vs 22 (ND) Anxiety 13 (ND) vs 9 (ND) Depression 8 (ND) vs 9 (ND) | |||||||||
| 2016 | Carson S, et al | Anxiety: 6.4 (5.72 - 7.08) vs 7.2 (6.54 - 7.84) Depression: 5 (4.34- 5.66) vs 4.9 (4.29- 5.51) | 25.6 (23 - 28.2) vs 20.7 (18.03-23.37) | 81.1 (78.3- 83.9) vs 84.3 (81.387.3) | |||||||
| 2017 | Chiang V, et al | Anxiety: 7.71 (4.92- 10.5) vs 7.23 (4.9-9.56) Depression: 7.94 (4.84- 11.04) vs 6.1 (3.88-8.32) | |||||||||
| 2016 | Garrouste- Orgeas M, et al | Anxiety: 8 (IQR 4.5 - 12) vs 4 (IQR 1-9) Depression: 5.5 (IQR 1- 11.5) vs 2 (IQR 0- 6) | 24 (ND) vs 21 (ND) | ||||||||
Instruments for measurement of stress and emotional affect
| Tool Name | Intended Assessment | Scale Range | Scale Interpretation | Population | #Questions | Style | Comments |
|---|---|---|---|---|---|---|---|
| Parental Stressor Scale (PSS) | parent stress, negative feelings about children/ parenting | 18-90 | higher score indicates greater stress | Parents | 18 | self-reported | |
| Parenting Stress Index (PSI) | parent stress, positive and negative feelings about children/ parenting | 0-100 | higher score indicates greater stress, conflict | Parents | 101 | self-reported | |
| Neonatal Index of Parental Satisfaction (NIPS) | infant behavior | 0-7 | higher score indicates higher levels of satisfaction | Parents | 30 | self-reported | |
| Patient-Health Questionnaire (PHQ-9) | Depression | 0-27 | higher score indicates depression: Stratified according to severity- 0-4 Minimal or none Monitor; may not require treatment 5-9 Mild Use clinical judgment (symptom duration, functional impairment) to determine necessity of treatment 10-14 Moderate 15-19 Moderately severe Warrants active treatment with psychotherapy, medications, or combination 20-27 Severe | Adults | 9 | self-reported | |
| Generalized Anxiety Disorder Scale (GAD-7) | Generalized Anxiety Disorder | 0-21 | higher score indicates greater likelihood of clinically significant anxiety disorder Score Symptom Severity 5-9 Mild Monitor 10*-14 Moderate Possible clinically significant condition >15 Severe Active treatment probably warranted | Adults | 7 | self-reported | |
| Posttraumatic Stress Disorder Checklist (PCL) | PTSD | 0-80 | higher score indicates higher likelihood of PTSD provisional PTSD diagnosis can be made by treating each item rated as 2 = "Moderately" or higher as a symptom endorsed, then following the DSM-5 diagnostic rule which requires at least: 1 B item (questions 1-5), 1 C item (questions 6-7), 2 D items (questions 8-14), 2 E items (questions 15-20). Preliminary validation work is sufficient to make initial cut-point score suggestions, but this information may be subject to change. A PCL-5 cut-point score of 33 appears to be a reasonable value | Adults | 20 | self-reported | for civilians and military (not relevant for our study) |
| Hospital Anxiety and Depression Scales (HADS) | Anxiety and Depression | 0-21 (for each scale-full HADS provides two separate scales) | higher score indicates higher likelihood of generalized anxiety or depression | Adults | 14 | self-reported | |
| State-Trait Anxiety Inventory (STAI) | Anxiety and Depression | 20-80 (for each State and Trait) | higher score indicates higher likelihood of anxiety and stress | Adults, Care-givers | 40 | self-reported | 20 trait-focused and 20 state-focused questions. Requires 6th grade reading level |
| Nurse Parent Support Tool (NPST) | parent perceptions of support, stress | 1-5 per item | higher score indicates higher perceived support | Parents | 21 | self-reported | |
| Impact of Event Scale (IES) | subjective distress caused by traumatic events | 0-88 | higher score indicates higher likelihood of PTSD | Adults | 22 | self-reported | |
Included Studies with outcome measures by intervention type, Not Passive or Passive
| Setting/Year | Author | Emotional Outcome Tool mean result, control (95% Cl) versus experimental (95% Cl) | Satisfication Outcomes Mean Results, control (95% Cl) versus experimental (95% Cl) | ||||
|---|---|---|---|---|---|---|---|
| Pediatric - Not Passive | PSS:NICU | PSS | NIPS | STAI | PSI-P | NPST | |
| 2005 | Browne J, Talmi A | ||||||
| 2017 | Kadivar M, et al | 102.2 (94- 110) VS 137 (132- 142) | |||||
| 1988 | Curley M | 2.66 vs 1.92 (Cl unable to calculate) | |||||
| 2004 | Melnyk B, et al | 39.1 (36-42.2) vs 36(33.7- 38.3) | 7.4(6.12-8.68) vs 5.6(4.76-6.44) | ||||
| Pediatric - Passive | |||||||
| 2011 | Franck L, et al | 2.57 (2.44- 2.7) VS 2.58 (2.44- 2.72) | |||||
| 2015 | Abdel-Latif M, et al | 3.47 (3.3- 3.64) VS 3.47(3.26-3.61) | |||||
| 2015 | Clarke-Pounder J, et al | Anxiety change -4.2 (-6.89-1.51) vs 0.33 (-5.67-6.34) | |||||
| 2013 | Weiss J, et al | 2.84(2.61-3.07) VS 2.7 (2.52-4.47) | 4.16 (3.97-4.35) vs 4.14 (4.01-4.27) | ||||