
Table 1
Demographic, information, comorbidities, laboratory test results during admission in patients received empirical anidulafungin or no empirical antifungal therapy
| Characteristics | Variables (N = 149) | P value | |
|---|---|---|---|
| EAT group (Case) (n = 77) | NEAT group (Control) (n = 72) | ||
| Age (year) | |||
| Mean ± SD | 60.4 ± 17.5 | 61.3 ± 17.6 | |
| Range (min-max) | 20 - 85 | 22 - 90 | 0.762 |
| Gender | |||
| Male | 41 | 40 | |
| Female | 36 | 32 | 0.870 |
| Comorbidities | |||
| Diabetes, n (%) | 64 (83.11) | 59 (81.94) | 0.001 |
| Hypertension, n (%) | 68 (88.31) | 57 (79.16) | 0.001 |
| CVD, n (%) | 37 (48.05) | 40 (55.55) | 0.842 |
| BA, n (%) | 23 (29.87) | 26 (36.11) | 0.577 |
| CKD, n (%) | 25 (32.46) | 26 (36.11) | 0.565 |
| COPD, n (%) | 14 (18.18) | 12 (16.66) | 0.784 |
| CLD, n (%) | 11 (14.28) | 8 (11.11) | 0.685 |
| PUD, n (%) | 9 (11.68) | 11 (15.27) | 0.723 |
| Arthritis, n (%) | 4 (5.19) | 3 (4.16) | 0.067 |
| PD, n (%) | 6 (7.79) | 4 (5.55) | 0.023 |
| C-reactive protein (<10.0 mg/mL) | |||
| Mean ± SD | 210.2 ± 112.5 | 221.9 ± 105 | |
| Range (min-max) | 11.7 - 390.4 | 30.4 – 388.4 | 0.515 |
| Procalcitonin (<0.1 ng/mL) | |||
| Mean ± SD | 8 ± 25.9 | 10.8 ± 27.2 | |
| Range (min-max) | 0.02 - 114 | 0.08 - 129 | 0.522 |
| White blood cell (4-11 K/μL) | |||
| Mean ± SD | 18.3 ± 4.7 | 18.1 ± 4.9 | 0.998 |
| Range (min-max) | 12.4 - 32.6 | 11.5 – 30.2 | |
| Serum creatinine (0.8-1.4 mg/dL) | |||
| Mean ± SD | 1.7 ± 0.6 | 1.6 ± 0.6 | 0.900 |
| Range (min-max) | 0.6 - 3.3 | 0.7 – 2.9 | |
| SpO2 (%), Mean ± SD | 92 ± 2 | 91 ± 3 | 0.586 |
| Range (min-max) | 86 - 96 | 87 - 98 | |
| RSO, Mean ± SD | 7 ± 6 | 7 ± 5 | 0.644 |
| Range (min-max) | 2 - 14 | 2 - 15 | |
| Respiratory rate, (breaths/min), Mean ± SD | 24 ± 3 | 25 ± 5 | 0.144 |
| Range (min-max) | 19 - 31 | 17 - 29 | |
| Heart rate (beat/min), Mean ± SD | 98 ± 14 | 98 ± 9 | 0.062 |
| Range (min-max) | 72 - 112 | 72 - 109 | |
| LDH ((U/L), Mean ± SD | 432 ± 189.4 | 467 ± 167.1 | |
| Range (min-max) | 389.4 – 526.7 | 376.3 – 632.4 | 0.048 |
| ALT (U/L), Mean ± SD | 67 ± 36.6 | 73 ± 41.2 | 0.058 |
| Range (min-max) | 59.8 – 88.3 | 56.2 – 92.6 | |
| AST (U/L), Mean ± SD | 39 ± 16.7 | 36 ± 19.3 | 0.264 |
| Range (min-max) | 32.4 – 59.7 | 33.7 – 72.3 | |
| APACHE II Score (0-30) | |||
| Mean ± SD | 18.7 ± 4.4 | 17.2 ± 4.4 | 0.005 |
| Range (min-max) | 10 - 24 | 10 - 30 | |
[i] SD = standard deviation; n = number; % = percentage; min = minimum; max = maximum; CVD = cardiovascular disease; BA = bronchial asthma; CKD = chronic kidney disease; COPD = chronic obstructive pulmonary disease; CLD = chronic liver disease; PUD = peptic ulcer disease; PD = parkinson’s disease; SpO2 = oxygen saturation in blood; min = minute; RSO = requirement of supplemental oxygen; CRP = C-reactive protein; mg = milligram; L = liter; FEU = fibrinogen equivalent units; mg = milligram; ng = nanogram; dL = deciliter; K/μL = thousand cells per micro liter; LDH = lactate dehydrogenase; U/L = units per liter; dL = deciliter; ALT = alanine aminotransferase; AST = aspartate aminotransferase; APACHE = Acute physiology and chronic health evaluation.
Table 2
Incidences of invasive candidiasis and mortality rate in patients
| Group | IC* occurred during hospital-stay (%) | P value | 30-day mortality rate (n) | P value | ||
|---|---|---|---|---|---|---|
| EAT group (n = 77) | Candida pneumonia 3 (3.8) | Candida UTI 1 (1.2) | 10.39 % (8) | |||
| 1 (CA*); 2 (NAC) | 1 (NAC*) | |||||
| NEAT group (n = 72) | Candida pneumonia 16 (22.2) | Candida UTI 3 (4.1) | Candidemia 2 (2.7) | 19.44 % (14) | ||
| 11 (CA); 5 (NAC) | 2 (CA); 1 (NAC) | 1 (CA); 1 (NAC) | ||||
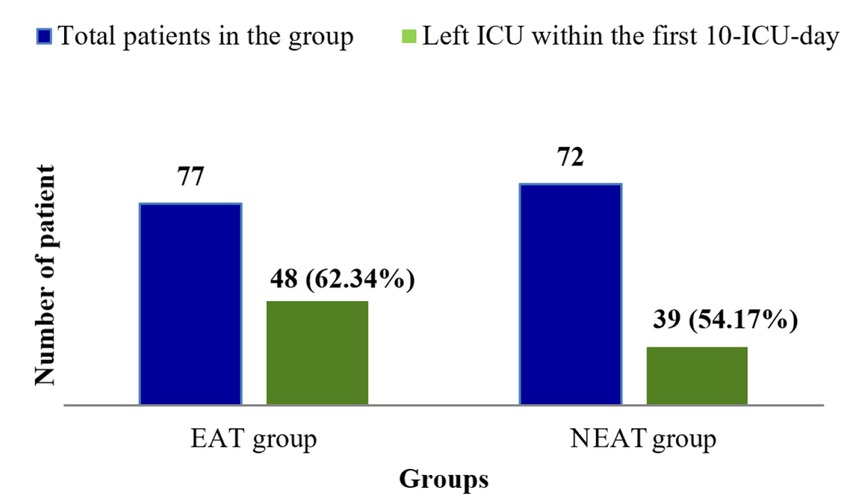
Fig. 1
ICU leaving rate within the first 10 day of ICU admission
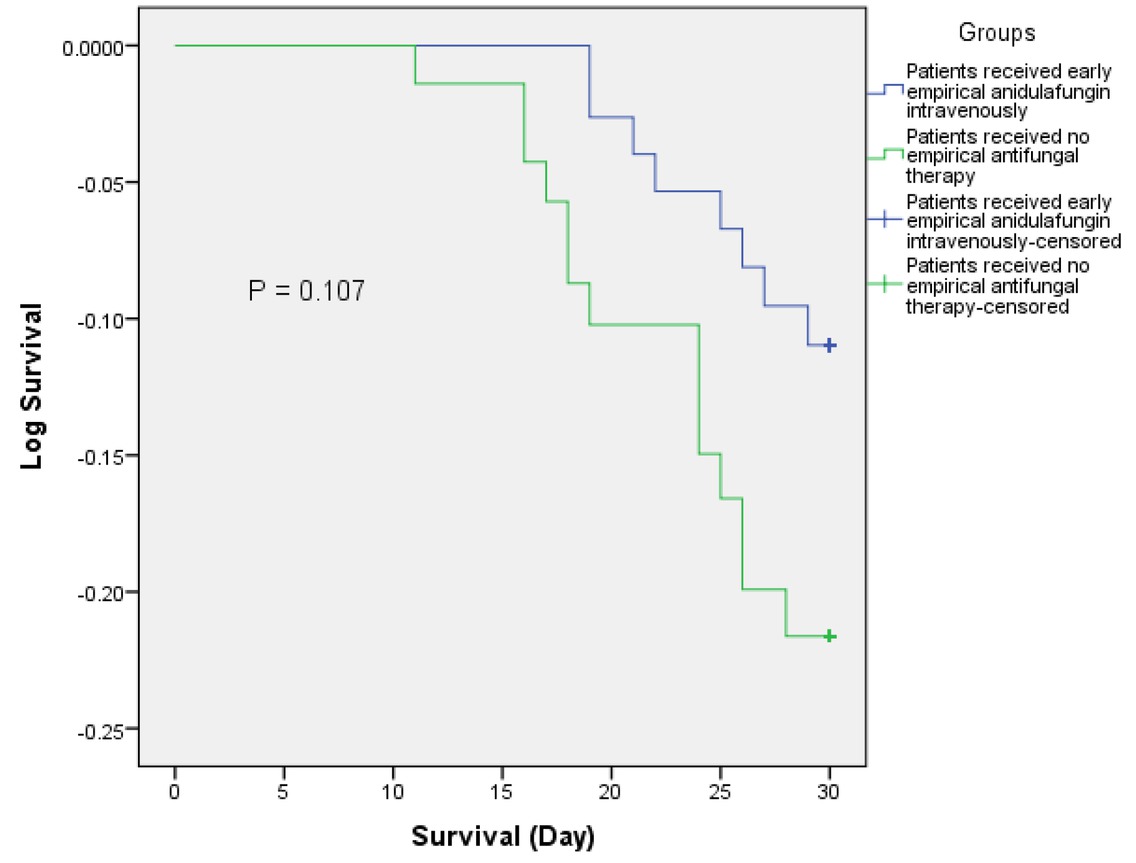
Fig. 2
Kaplan-Meier survival curve for EAT group (received intravenous anidulafungin empirically) (blue line) and NEAT group (received no antifungal therapy empirically) (green line). Analysis run using groups (EAT vs. NEAT) as factor; death as event and time to death as time variable.