
Fig. 1
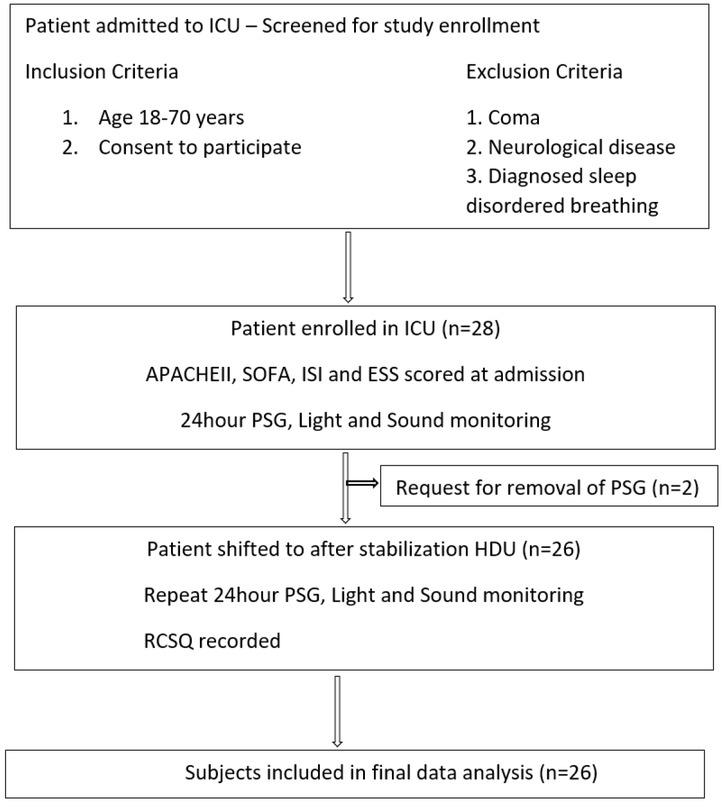
Fig. 2
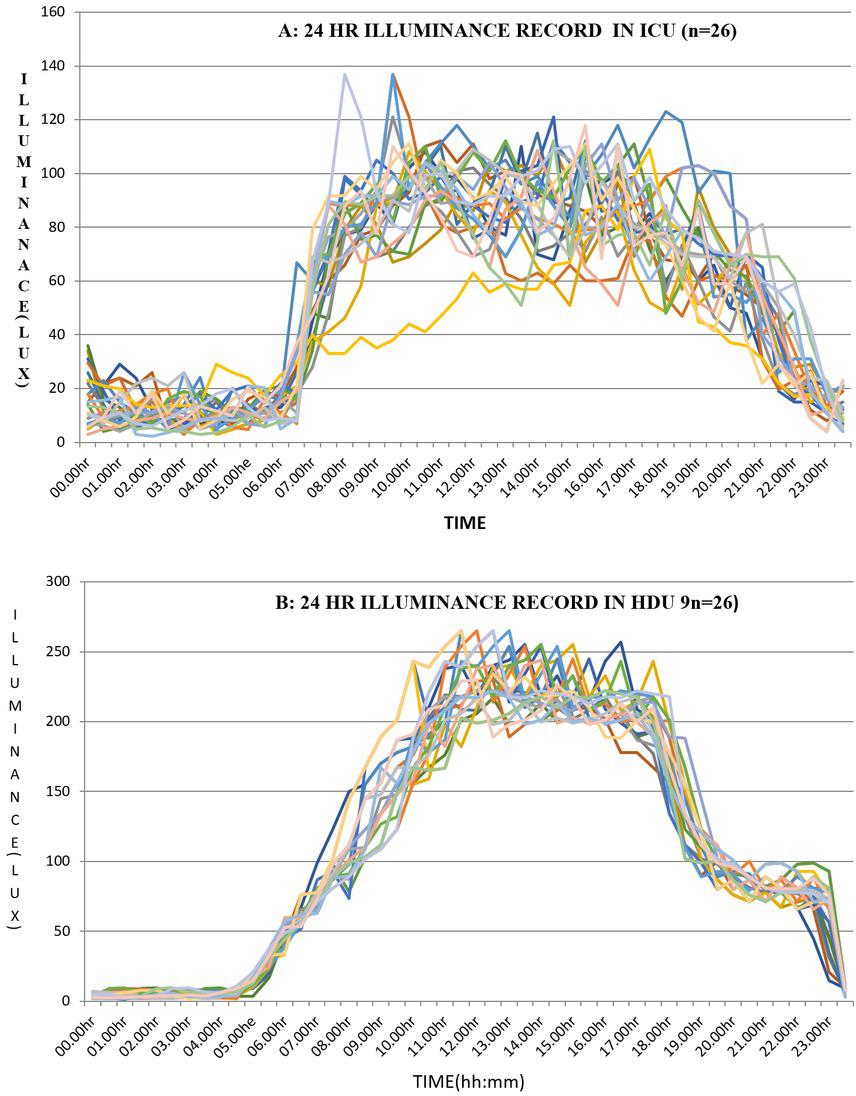
Fig. 3
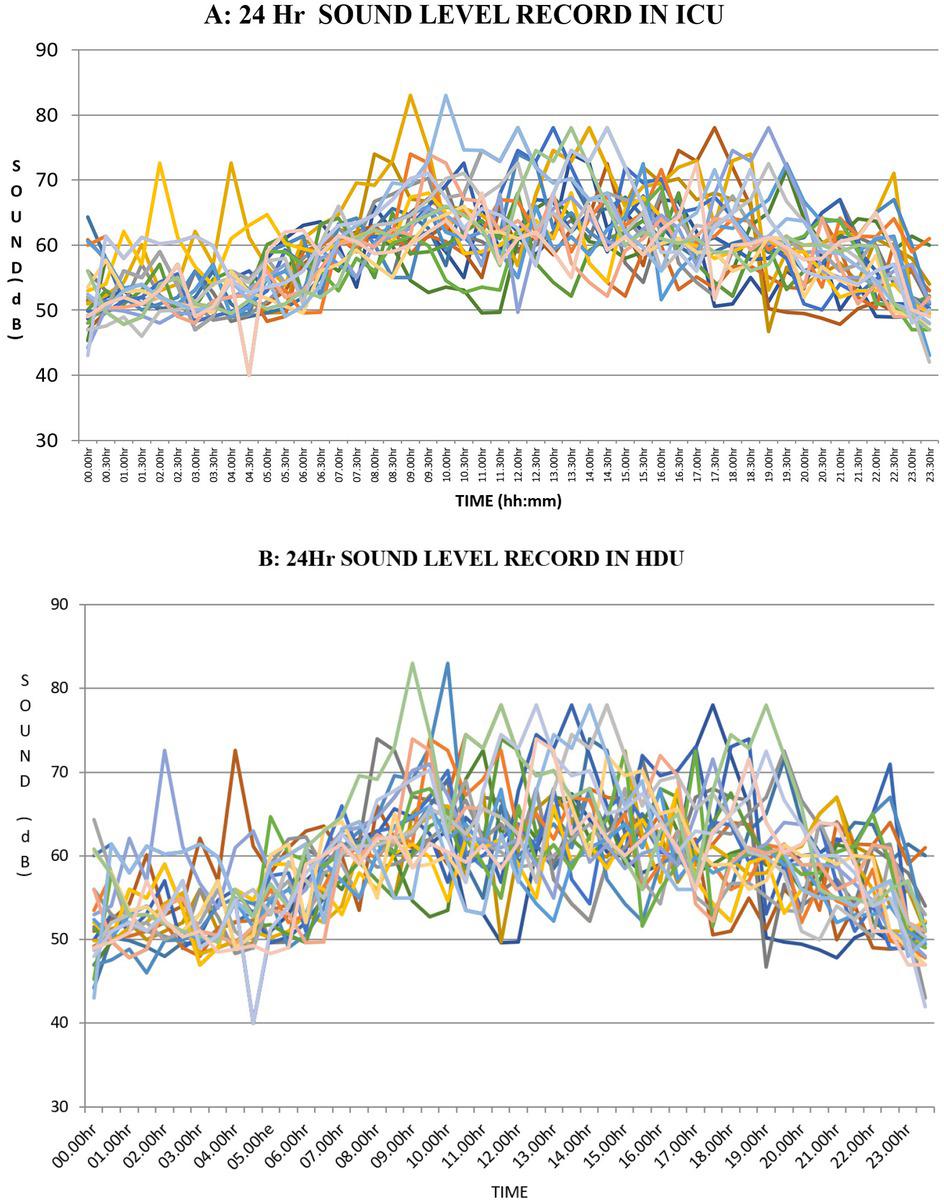
Comparison of Illuminance and Sound levels in Intensive Care Units (ICU) and High Dependency Units (HDU) (paired t-test)
| ICU | HINDU | P-value | |
|---|---|---|---|
| Light (Illuminance)(Lux) | |||
| Mean illuminance | 55.06 (4.68) | 112.06 (3.66) | <0.0001 |
| Mean day illuminance | 77.09 (3.66) | 160.52 (6.07) | <0.0001 |
| Mean night illuminance | 14.98 (2.04) | 23.67(2.62) | <0.0001 |
| Sound (Noise) level (decibel-dB)- A-weighted | |||
| Mean sound level | 59.17 (1.69) | 59.12 (1.49) | 0.904 |
| Mean day sound level | 62.08 (2.11) | 62.07 (2.13) | 0.988 |
| Mean night level | 53.64 (2.11) | 53.67 (1.67) | 0.968 |
The demographic and clinical characteristics of the study population
| Variable | Values |
|---|---|
| Age (mean years) | 35.96 |
| Sex | |
| Male, n(%) | 14 (53.8%) |
| Female, n(%) | 12 (46.2%) |
| Diagnosis | |
| Respiratory failure | |
| Snakebite envenomation | |
| Organophosphate poisoning | |
| ARDS | |
| COPD | |
| Fat embolism | |
| Acute severe asthma with | |
| pneumothorax | |
| Sepsis | |
| Comorbidity (n) | |
| Hypertension | |
| Diabetes Mellitus | |
| Chronic Kidney Disease | |
| Hypothyroidism | |
| Smoking | 9 |
| Insomnia Severity Index (mean) | 6.88(2.58) |
| Epworth Sleepiness Score(mean) | 4.92(1.99) |
| SOFA (mean) | 5.1(1.27) |
| APACHE II (mean) | 19.38(3.72) |
| RASS (median) | 0 (-1 – 1) |
| Ventilator days (mean) | 5.38(2.11) |
| Intensive care unit (ICU) stay in days (mean) | 7.38(1.74) |
Comparison of PSG data of Intensive Care Units (ICU) and High Dependency Units (HDU) (paired t-test)
| PSG parameters in ICU | PSG parameters in HDU | P-value | |
|---|---|---|---|
| TRT | 1320.40 (87.76) | 1337.31 (65.66) | 0.44 |
| SPT | 1090.60 (107.85) | 1042 (74.22) | 0.11 |
| TEST | 520.25 (89.59) | 499.06 (57.72) | 0.25 |
| WASO | 579.25 (137.43) | 530.73 (98.93) | 0.18 |
| N1 | 148.2 (42.8) | 109.36 (25.79) | 0.0002 |
| N1% | 28.80 (7.30) | 21.88 (4.30) | 0.0001 |
| N2 | 315.73 (74.56) | 278.71 (38.99) | 0.027 |
| N2% | 60.3 (8.65) | 55.86 (4.00) | 0.021 |
| N3 | 34.19 (12.51) | 71.55 (20.53) | <0.0001 |
| N3% | 6.66 (2.30) | 14.34 (3.87) | <0.0001 |
| REM | 22.88 (21.03) | 38.44 (19.42) | 0.01 |
| REM% | 4.20 (3.68) | 8.20 (3.54) | 0.001 |
| Arousal index | 22.65 (10.49) | 16.55 (5.15) | 0.006 |
| Sleep w/o wake | 3.18 (1.35) | 4.01 (1.39) | 0.03 |
| Day sleep | 256.32 (57.33) | 188.09 (36.82) | <0.0001 |
| Day sleep % | 49.55 (9.29) | 37.71 (5.91) | <0.0001 |
| Night sleep | 263.72 (68.09) | 310.81 (21.02) | 0.0016 |
| Night sleep% | 50.46 (9.36) | 62.28 (8.01) | 0.0001 |