
Fig. 1
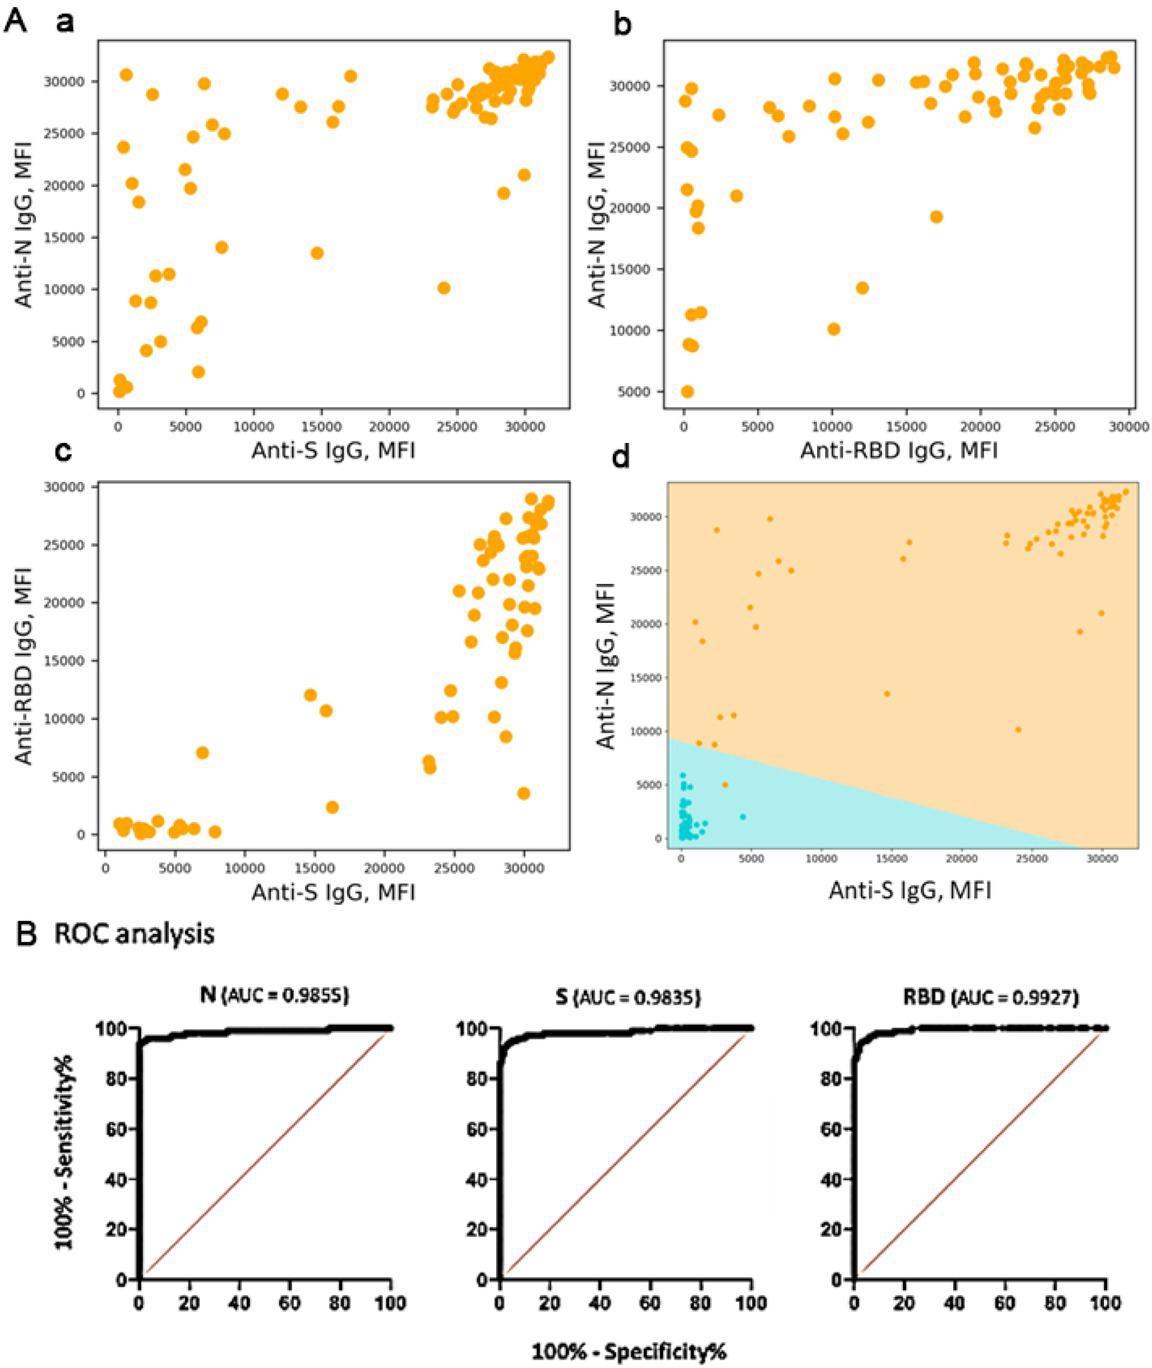
Fig. 2
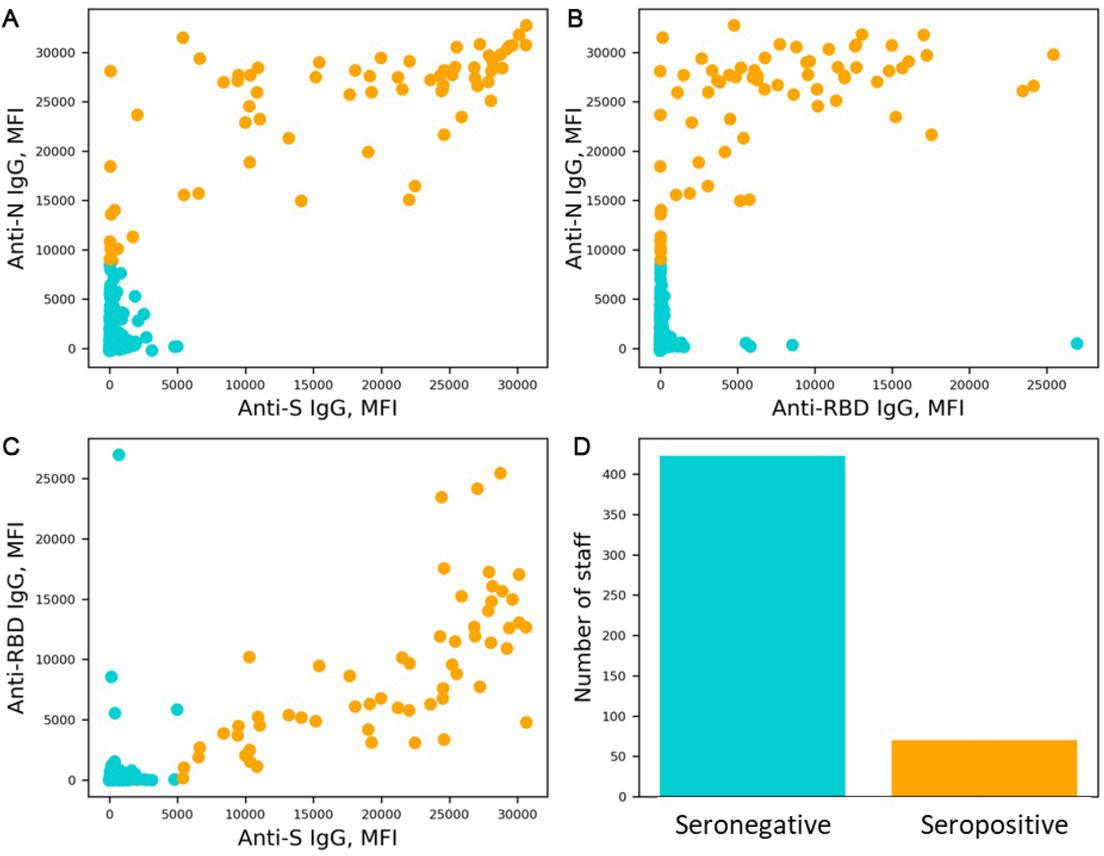
Fig. 3
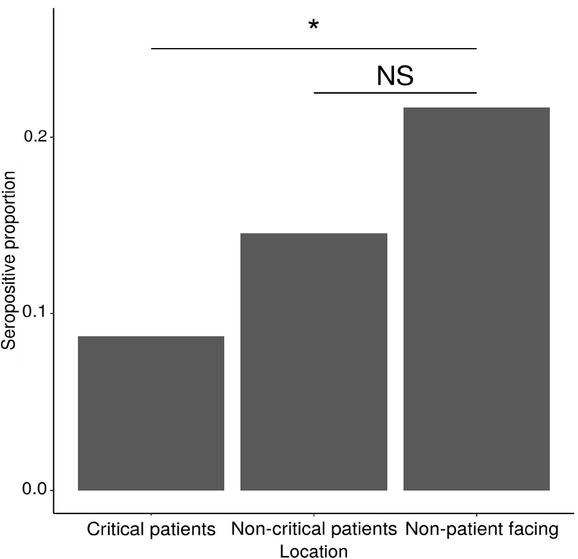
Fig. 4
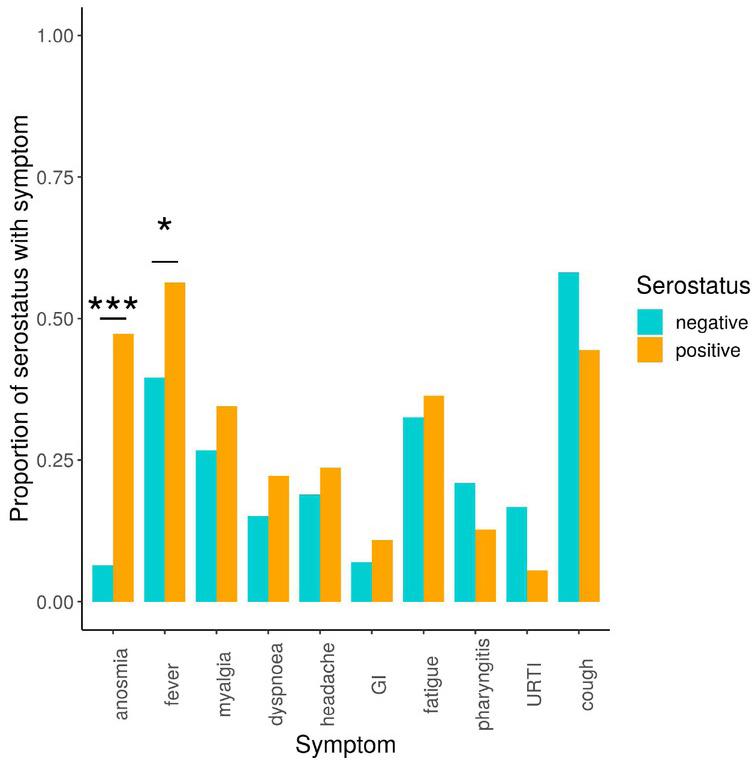
Fig. 5
Cohort demographic for age, sex, ethnicity and work location and by serostatus by multiplex (N=498 classified)_ Values: N= (% of total and of cohort by demographic classification to nearest whole number)_ Age: years_*p=0_017 : age of seropositive and seronegative cohort (MW-U)_
| Total (%) | Seropositive (%) | Seronegative (%) | ||
|---|---|---|---|---|
| Number recruited | 500 | 70 (14) | 428 (86) | |
| Age (yrs, median with IQR) | 42 (33-51) | 40 (32-50) | 47 (36-53)* | |
| Sex | male | 146 (29) | 20 (14) | 126 (86) |
| female | 352 (70) | 50 (14) | 302 (86) | |
| Ethnicity group | 1:white | 390 (78) | 45 (12) | 345 (88) |
| 2:mixed | 16 (3) | 4 (25) | 12 (75) | |
| 3:asian | 79 (16) | 16 (20) | 63 (80) | |
| 4:black | 11 (2) | 2 (18) | 9 (82) | |
| 5: other | 1 (0.2) | 0 | 1 (0.2) | |
| NA | 3 (1) | 0 | ||
| Work location | Critical Care patient facing | 126 (25) | 10 (7.9) | 116 (92) |
| Non-Critical Care patient facing | 284 (57) | 40 (14) | 244 (86) | |
| Non-patient facing | 63 (13) | 12 (19) | 51 (81) | |
| NA | 27 (5) | |||
PCR Swab Positive and Symptom Severity Score by Serostatus_ N= (% of total and of each cohort by severity score)_
| Total | Seropositive | Seronegative | ||
|---|---|---|---|---|
| PCR positive nasal swab | 12 (2) | 9 (75) | 3 (25) | |
| Symptom Severity Score | 1: asymptomatic | 275 (55) | 17 (6) | 258 (94) |
| 2: mild | 195 (39) | 39 (20) | 156 (80) | |
| 3: moderate | 26 (5) | 9 (35) | 17 (65) | |
| 4: severe | 1 (0.2) | 1 | 0 | |
| NA | 3 (0.6) |