
Table 1
Demographic and epidemiologic characteristics of the two cohort groups
| Group N | Group F | p-value | |
|---|---|---|---|
| Sample size (n) 224 | 45 | 179 | |
| Males (%) | 27 (60) | 106 (59.2) | 1.0 |
| Age in months [median IQR] | 5 [2-12] | 4 [2-9] | 0.42 |
| PICU LOS in days [median IQR] | 6 [4-8] | 10 [7-13] | < 0.001 |
| #HD MV [median IQR] | 1 [1] | 1 [1-2] | 1 |
| Duration of MV [median IQR] | 4 [3-5] | 6 [5-9] | < 0.001 |
| Admission weight in kg [median IQR] | 7.7 [4-10] | 6.2 [4.2-9.15] | 0.48 |
| Discharge weight in kg [median IQR] | 7.6 [4-10] | 6.10 [4.4-9.2] | 0.58 |
| CFB1 in ml [median IQR] | 376 [200-700] | 573 [298.50-797.25] | 0.03 |
| FO1 [median IQR] | 6.16 [3.12-8.24] | 9.03 [5.29-12.87] | 0.003 |
| Initial FiO2 [median IQR] | 0.40 [0.35-0.50] | 0.45 [0.40-0.55] | 0.014 |
| Initial PEEP [median IQR] | 5 [5-8] | 7 [5-8] | 0.195 |
| PRISM IV [median IQR] | 1 [1-2] | 1 [1-2] | 1.0 |
| Bronchodilator (%) | 23 (51.1) | 123 (68.7) | 0.04 |
| Corticosteroids (%) | 12 (26.7) | 82 (45.8) | 0.03 |
[i] IQR = interquartile range; PICU = pediatric intensive care unit; LOS = length of stay; #HD MV = PICU day for initiation of mechanical ventilation MV = mechanical ventilation; CFB1 = cumulative fluid balance for 24 hours after invasive mechanical ventilation; FO1 = percent fluid overload after 24 hours of mechanical ventilation; FiO2 = fraction of inspired oxygen; PEEP = positive end-expiratory pressure; PRISM IV = Pediatric Risk of Mortality score
Table 2
Pre and post 24 hour clinical and laboratory variables among patients who received intravenous furosemide
| N = 179 | Pre diuretic | Post diuretic | p-value |
|---|---|---|---|
| CFB in ml [median IQR] | 891 [588.50-1263] | 807 [565-1368] | 0.47 |
| FO per cent [median IQR] | 14 [9.30-19.02] | 13.87 [10.55-19.06] | 0.59 |
| Weight in kg [median IQR] | 6.10 [4.4-9.20] | 6.55 [4.4-9.40] | 0.73 |
| FiO2 [median IQR] | 0.45 [0.3-0.45] | 0.35 [0.3-0.4] | 0.007 |
| PEEP [median IQR] | 7 [5-8] | 6 [5-8] | 0.47 |
| SpO2:FiO2 [median IQR] | 270 [214-321] | 280 [242-330] | 0.034 |
| Serum creatinine [median IQR] | 0.2 [0.2-0.3] | 0.2 [0.2-0.3] | 1.0 |
| Serum blood urea nitrogen [median IQR] | 5 [2-7] | 5 [3-9] | 1.0 |
| Serum bicarbonate [median IQR] | 26 [23-29] | 32 [28-36] | < 0.001 |
Table 3
Viral and bacterial isolate profile
| Virus, n = 224 (%) | |
|---|---|
| RSV | 65 |
| Non-RSV | 25 |
| 2 non-RSV | 7 |
| 3 or more | 3 |
| Bacteria from mini-BAL, n = 135 (%) | |
|---|---|
| H. influenzae | 40 |
| M. catarrhalis | 21.5 |
| S. pneumoniae | 15 |
| A. streptococcus | 4 |
| P. aeruginosa | 1.5 |
| S. aureus (MSSA) | 1.5 |
| S. aureus (MRSA) | 1.5 |
| E. coli | 1.5 |
| Acinetobacter | 1.5 |
| 2 or more organisms | 12 |
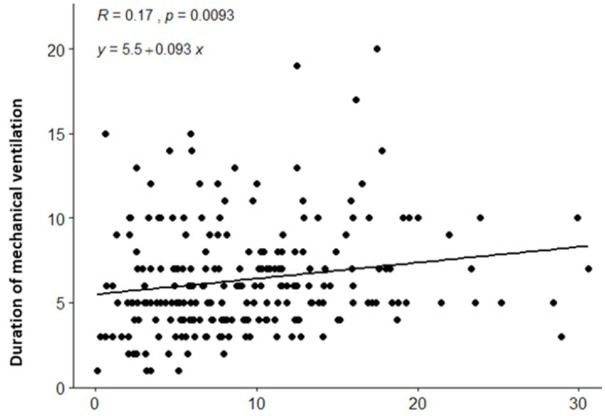
Fig. 1
Correlation plot of percent fluid overload after 24 hours of mechanical ventilation (FO1) and duration of mechanical ventilation
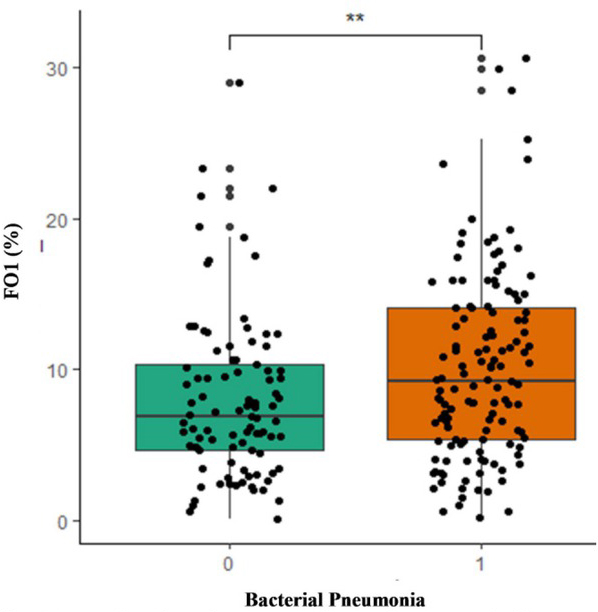
Fig. 2
Box plot showing comparison of percent fluid overload after 24 hours of mechanical ventilation (FO1) and pneumonia status in patients