
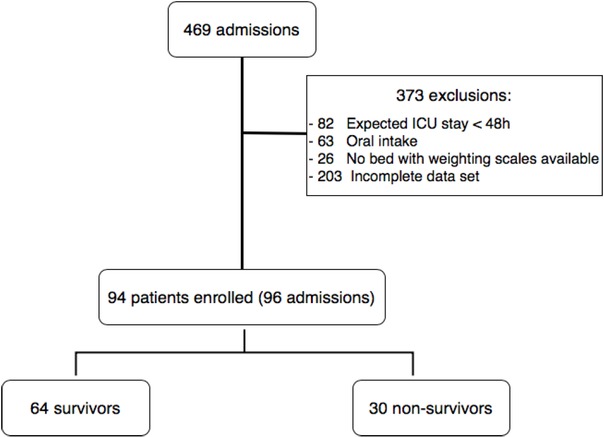
Fig. 1
Study flow.
Table 1
Characteristics of the study cohort
| All patients | Survivors | Non-survivors | p Value | |
|---|---|---|---|---|
| (n = 94) | (n= 64) | (n= 30) | ||
| Age; years (SD) I | 57.36 (17.20) | 57.83(17.92) | 56.37 (15.78) | 0.70 |
| Female gender (%) | 48 (51.06) | 32 (50) | 16 (53.3) | 0.83 |
| SAPS3; points (SD) | 69.03 (18.46) | 67.78 (16.17) | 71.67 (22.60) | 0.34 |
| BMI; kg/m2 (SD) | 27.81 (7.25) | 28.54 (7.49) | 26.26 (6.54) | 0.16 |
| Origin (%) | ||||
| Emergency room | 47 (50) | 34 (53.12) | 13 (43.33) | 0.35 |
| Hospital ward | 34 (36.17) | 20 (31.25) | 14 (46.67) | |
| Other hospital | 13 (13.83) | 10 (15.62) | 3 (10) | |
| Energy delivered on 3rd day of ICU stay; kcal/day (SD) | 21.05 (6.47) | 22.12 (6.42) | 18.50 (5.98) | 0.014 |
| Protein delivered on 3rd day of ICU stay; g/kg (SD) | 1.42 (0.52) | 1.49 (0.44) | 1.25 (0.65) | 0.045 |
| Comorbidities (%) | ||||
| COPD | 13 (13.83) | 9 (14.06) | 4 (13.33) | 1.0 |
| EF < 35% | 11 (11.70) | 8 (12.50) | 3 (10) | 1.0 |
| Cirrhosis | 9 (9.57) | 6 (9.38) | 3 (10) | 1.0 |
| Cancer | 23 (24.47) | 16 (25) | 7 (23.33) | 1.0 |
| End-stage renal disease | 7 (7.45) | 4 (6.25) | 3 (10) | 0.68 |
| Immunosuppression | 15 (15.96) | 8 (12.50) | 7 (23.33) | 0.23 |
| Reason for ICU admission (%) | ||||
| Respiratory sepsis | 29 (30.85) | 18 (28.12) | 11 (36.67) | |
| Non respiratory sepsis | 7 (7.45) | 3 (4.69) | 4 (13.33) | |
| Cardiovascular disease | 5 (5.32) | 5 (7.81) | 0 (0) | |
| Coma | 18 (19.15) | 11 (17.19) | 7 (23.33) | 0.13 |
| Postoperative ARF | 7 (7.45) | 4 (6.25) | 3 (10) | |
| COPD/Asthma | 3 (3.19) | 2 (3.12) | 1 (3.33) | |
| Pulmonary Embolism | 2 (2.13) | 1 (1.56) | 1 (3.33) | |
| ARDS | 23 (24.47) | 20 (31.25) | 3 (10) | |
| Organ dysfunction at ICU admission* | ||||
| Hemodynamic | 74 (78.72) | 50 (78.12) | 24 (80) | 1.0 |
| Lung | 86 (91.49) | 59 (92.19) | 27 (90) | 0.71 |
| Renal | 35 (37.23) | 24 (37.5) | 11 (36.67) | 1.00 |
| Hematologic | 25 (26.60) | 13 (20.31) | 12 (40) | 0.078 |
| Liver | 8 (8.33) | 3 (4.55) | 5 (16.67) | 0.10 |
| Neurological | 39 (41.49) | 23 (35.94) | 16 (53.33) | 0.12 |
| Diuretic provision during ICU stay (%)** | 30 (31.91) | 20 (31.25) | 10 (33.33) | 1.0 |
| Need of RRT during ICU stay (%)** | 32 (34.04) | 16 (25) | 16 (53.33) | 0.010 |
| ICU-acquired infection (%)** | 25 (26.60) | 12 (18.75) | 13 (43.33) | 0.023 |
| MV duration (days)** | 7 (3 – 10) | 6 (2 – 9) | 8 (6 – 13) | 0.012 |
| Length of ICU stay (days)** | 9 (6 – 15) | 9.5 (6 – 15.5) | 8 (6 – 14) | 0.87 |
| Length of hospital stay (days)** | 16 (9 – 27) | 16 (9.5 – 28) | 15.5 (8 – 27) | 0.95 |
| Time between hospitalization and ICU admission (days) | 3 (1 – 10) | 3 (1 – 9) | 3 (1 – 10) | 0.98 |
[i] Data are presented as mean ± standard deviation, median (interquartile range) or n(%). * Identified as a Sequential Organ Failure Assessment (SOFA) score 1 in each system. ** Including data from 96 ICU admissions. SAPS: Simplified Acute Physiology Score. BMI: body mass index. ICU: intensive care unit. COPD: chronic obstructive pulmonary disease. EF: Ejection fraction. LV: left ventricular. RRT: renal replacement therapy. ARF: acute respiratory failure. ARDS: acute respiratory distress syndrome. MV: mechanical ventilation.
Table 2
Comparison of fluid balance and weight change of survivors and non-survivors of ICU hospitalization
| All patients* (n = 94) | Survivors (n= 64) | Non-survivors (n= 30) | p Value | |
|---|---|---|---|---|
| First 24h-fluid balance (L) | +0.95 ([+0.09] – [+1.78]) | +0.84 ([+0.08] – [+1.6]) | +1.26 ([+0.41] – [+0.27]) | 0.10 |
| First 24h-fluid balance + | +0.05 ([-0.79] – [+0.80]) | -0.004 ([-0.88] – [+0.74]) | +0.64 ([-0.48] – [+1.77]) | 0.075 |
| indiscernible water loss (L) | ||||
| First 24h-weight change (kg) | 0.0 ([-0.9] – [+1.1]) | +0.25 ([-1.45] – [+0.6]) | +0.9 ([-0.1] – [+2.2]) | <0.001 |
| Cumulative fluid balance (L) | +3.61 ([-0.11] – [+7.43]) | +2.53 ([-0.4] – [+6.0]) | +5.6 ([+1.85] – [+9.21]) | 0.012 |
| Cumulative fluid balance + | -3.89 ([-7.27] – [-0.1]) | -3.91 ([-7.78] – [-1.1]) | -3.33 ([-6.87] – [+0.97]) | 0.37 |
| indiscernible water loss (L) | ||||
| Total weight change (kg) | -2.55 ([-4.8] – [+0.1]) | -3.05 ([-6.5] – [-0.7]) | -1.1 ([-3.1] – [+0.9]) | 0.008 |
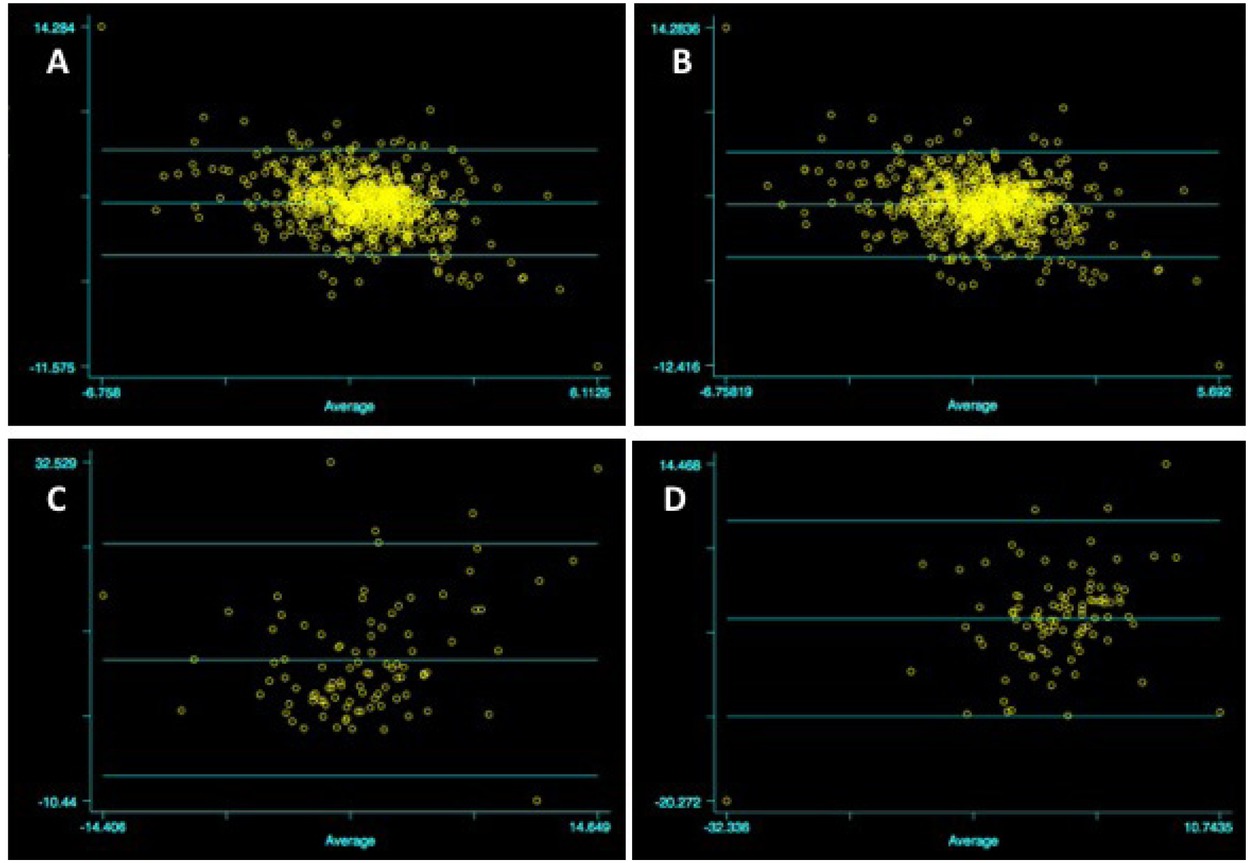
Fig. 2
Bland Altman plot for changes in fluid balance and simultaneous body weight (A) Daily fluid balance and body weight changes. B) Daily fluid balance with indiscernible water loss and body weight changes. C) Cumulative FB and total body weight change. D) Cumulative fluid balance with indiscernible water loss and total body weight change. X-axis, mean values for fluid balance and body weight. Y- axis, difference between fluid balance and body weight.
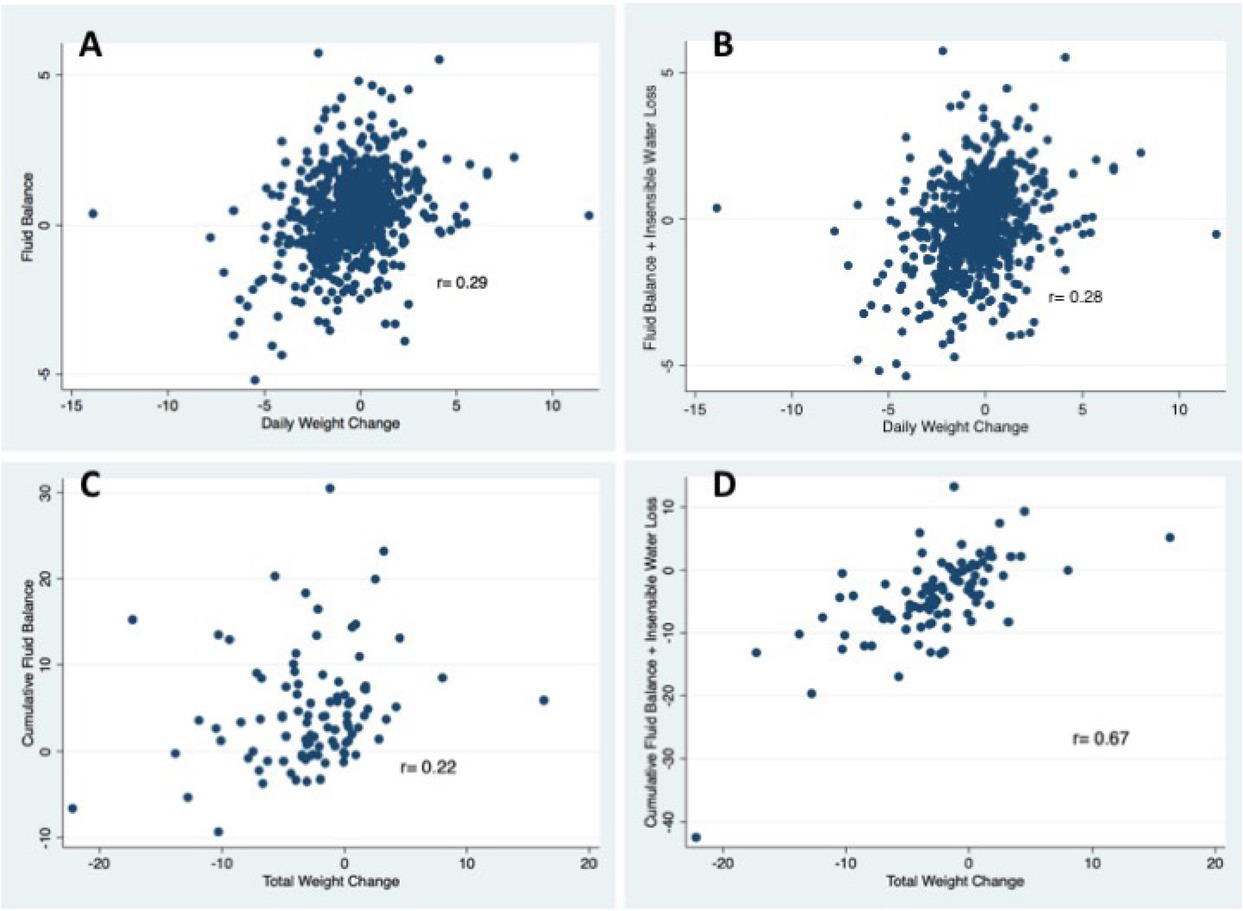
Fig. 3
Correlation between A) daily fluid balance and body weight changes (Spearman rank correlation; p< 0.001), B) daily fluid balance with indiscernible water loss and body weight changes (Spearman rank correlation; p< 0.001), C) cumulative fluid balance and total body weight change (Spearman rank correlation; p= 0.03), and D) cumulative fluid balance with indiscernible water loss and total body weight change (Spearman rank correlation; p< 0.001).
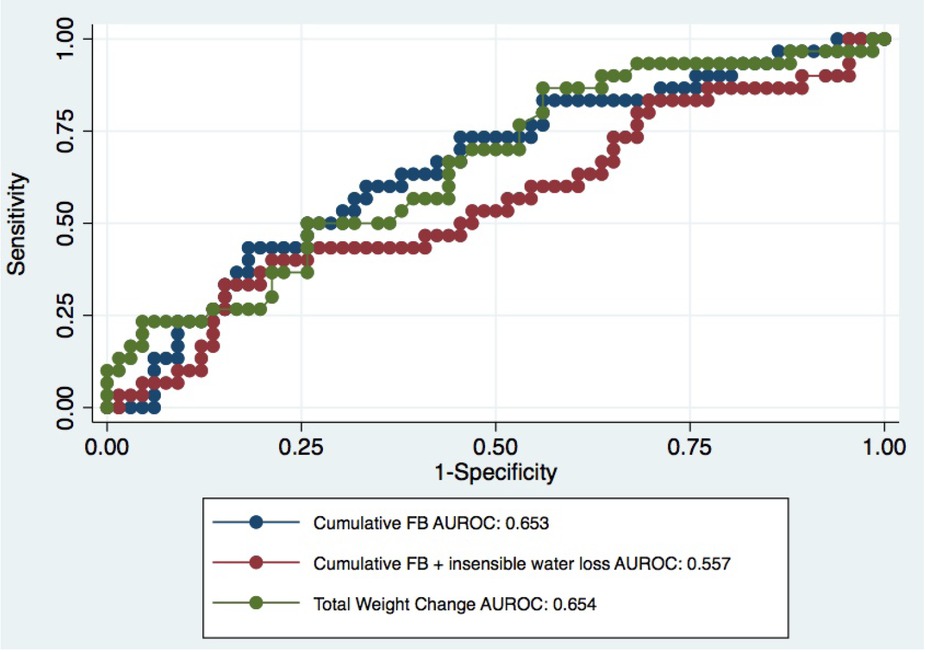
Fig. 4
Areas under ROC curve showing discrimination power of cumulative fluid balance, cumulative fluid balance corrected for indiscernible water loss and total body weight change in predicting ICU mortality.