
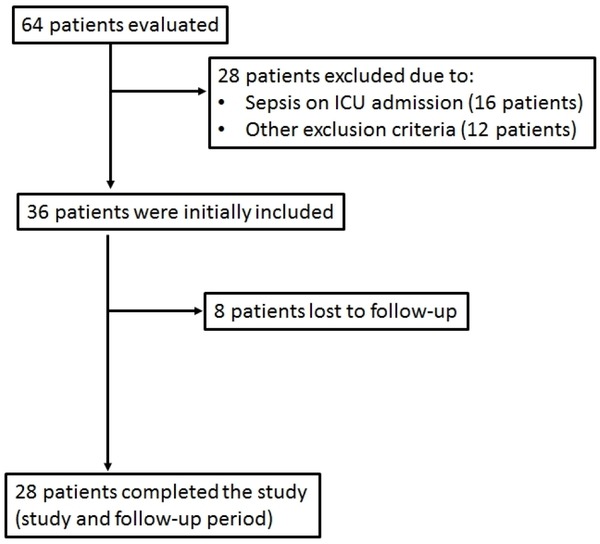
Fig. 1
Study enrolment flow chart
Table 1
Demographics on ICU admission and important outcomes of the patients who developed heterotopic ossification (HO) (HO-positive) versus those who did not (HO-negative).
| Demographics/Outcomes | HO-positive patients | HO-negative patients | p-value |
|---|---|---|---|
| Number of patients (N) | 9 | 19 | |
| Age | 51(19) | 51(14) | ns |
| Sex | ns | ||
| Male | 14 | ||
| Female | 5 | ||
| APACHE II, mean (SD) | 16(6) | 17(5) | ns |
| SOFA, mean (SD) | 7(1) | 7(2) | ns |
| CRP (mg/dl), (median, IQR) | 5.1 (1.6-12.0) | 5.5 (1.1-8.8) | ns |
| PCT (ng/ml), (median, IQR) | 1.1 (0.2-2.5) | 0.1 (0.1-0.8) | ns |
| Creatinine (mg/dl), mean (SD) | 0.7(0.2) | 0.9(0.3) | ns |
| Vitamin D (ng/ml), (median, IQR) | 6.8 (4.2-13.6) | 12.7 (6.5-16.8) | ns |
| Diagnosis | ns | ||
| Medical | 0% | 15.8% | |
| Surgery/Trauma | 100% | 84.2% | |
| Medical | 0 | 3 | |
| Cerebral abscess | - | 1 | |
| Subarachnoid haemorrhage | - | 1 | |
| Cerebral haemorrhage | - | 1 | |
| Surgical Emergency | 5 | 8 | |
| Thoracic | 0 | 0 | |
| Neurosurgery | 5 | 8 | |
| Abdominal | 0 | 0 | |
| Trauma | 4 | 8 | |
| Comorbidities | 3 | 7 | ns |
| CAD | |||
| Arterial Hypertension | |||
| Hypothyroidism | |||
| Mechanical ventilation (days) | 20 (17-25) | 22 (16-30) | ns |
| ICU Length of Stay (days) | 29 (21-35) | 30 (22-40) | ns |
| Sepsis | 66.7% | 84.2% | ns |
| Day of sepsis | 10 (7-12) | 8 (5-10) | ns |
[i] ns; p-value> 0.05. Number of patients (N) and percentages of totals (%), mean ± SD, or median (Q1-Q3) are given. The Student’s t-test or the non-parametric Mann-Whitney test were used for quantitative variables, accordingly, and the chi-square test or the Fisher’s exact for qualitative variables. APACHE II, SOFA score, circulating PCT, CRP, creatinine, and vitamin D levels were estimated on ICU admission (within 24 hours). Day of sepsis denotes the day on which sepsis occurred. APACHE= Acute physiology and chronic health evaluation; CAD= Coronary artery disease; CRP= C-reactive protein; ICU= Intensive care unit; PCT= Procalcitonin; SOFA= Sequential organ failure assessment.
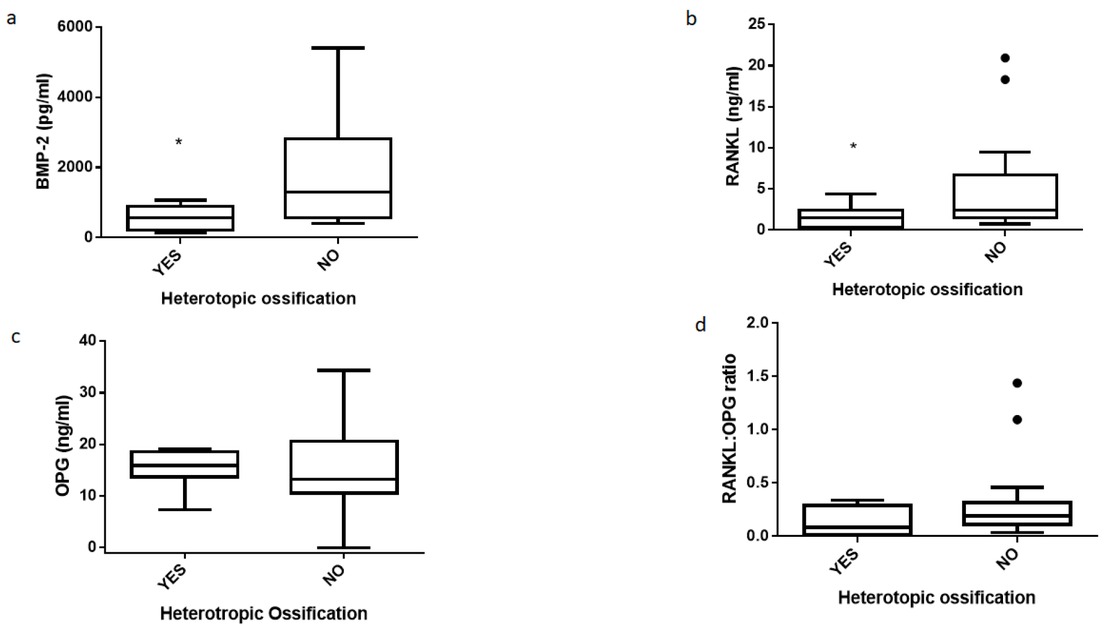
Fig. 2
BMP-2, RANKL and Osteoprotegerin levels on admission. a) BMP-2, b) RANKL, c) Osteoprotegerin and d) RANKL: Osteoprotegerin ratio were measured in 28 critically ill, initially non-septic patients on ICU admission. Patients were subsequently categorised as heterotopic ossification-positive (those who subsequently developed heterotopic ossification, yes, N= 9) and heterotopic ossification -negative (those who did not develop heterotopic ossification, no, N= 19). Two-group comparisons were performed with the non-parametric Mann-Whitney test, * p< 0.05. Data are presented as box plots. Line in the box, median value; box edges, 25th to 75th centiles; whiskers, range of values; bullet points, outliers. BMP-2= bone-morphogenetic protein 2, RANKL= receptor activator of nuclear factor kappa-Β ligand, OPG= osteoprotegerin.
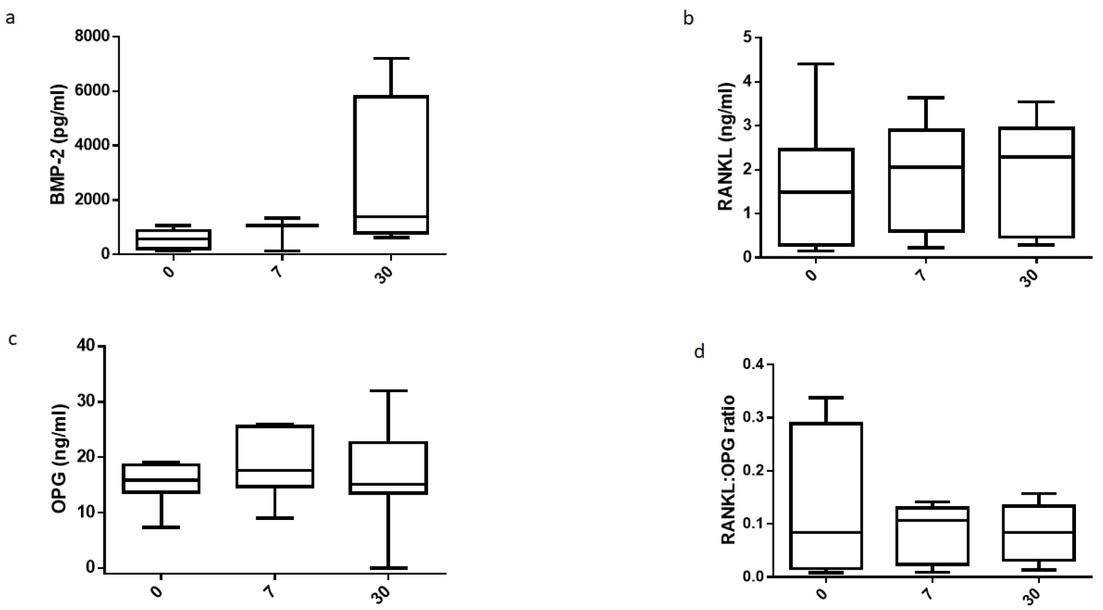
Fig.3
Time course of BMP-2, RANKL and OPG levels during ICU stay and the follow-up period in the patients who developed heterotopic ossification. a) BMP-2, b) RANKL, c) OPG and d) RANKL: OPG ratio were measured in 9 patients who developed heterotopic ossification on ICU admission (0), and thereafter seven days post-admission (7) and 30 days following ICU discharge (30). Data are presented with box plots. Line in the box, median value; box edges, 25th to 75th centiles; whiskers, range of values. Comparisons were performed using one-way ANOVA followed by Dunn’s multiple comparisons. BMP-2= bone-morphogenetic protein 2, RANKL= receptor activator of nuclear factor kappa-Β ligand, OPG= osteoprotegerin.
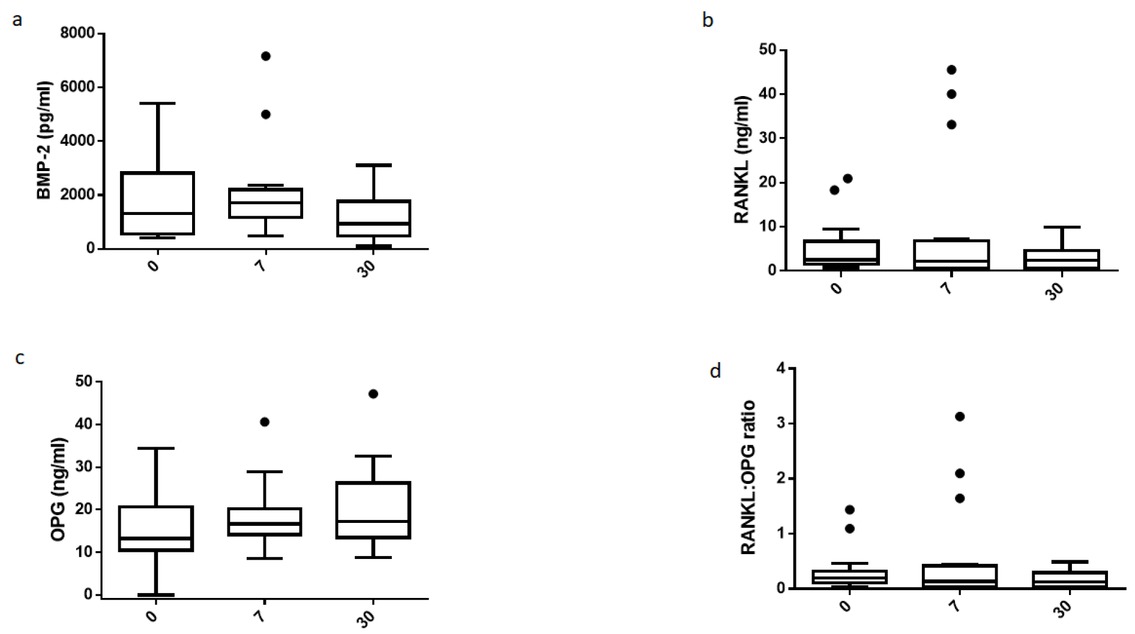
Fig. 4
Time course of BMP-2, RANKL and OPG levels during ICU stay and the follow-up period in the patients who did not develop heterotopic ossification. a) BMP-2, b) RANKL, c) OPG and d) RANKL: OPG ratio were measured in 19 patients who did not develop heterotopic ossification on ICU admission (0), and thereafter seven days post-admission (7) and 30 days following ICU discharge (30). Data are presented with box plots. Line in the box, median value; box edges, 25th to 75th centiles; whiskers, range of values; bullet points, outliers. Comparisons were performed using one-way ANOVA followed by Dunn’s multiple comparisons. BMP-2= bone-morphogenetic protein 2, RANKL= receptor activator of nuclear factor kappa-Β ligand, OPG= osteoprotegerin.
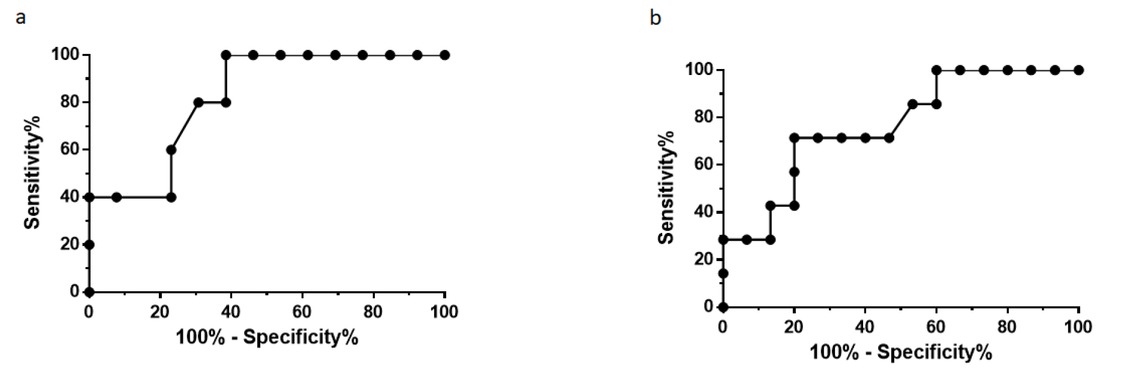
Fig. 5
Receiver operating characteristic (ROC) curve analysis. ROC curves were generated to determine the prognostic accuracy of a) BMP-2 and b) RANKL; the corresponding areas under the curve (AUC) and 95% confidence intervals (CI) were estimated as follows: BMP-2 at 0.823 (0.623-1.023, p= 0.038); RANKL at 0.767 (0.557-0.977, p= 0.048). The levels of both molecules were estimated on ICU admission. BMP-2= bone-morphogenetic protein 2, RANKL= receptor activator of nuclear factor kappa-Β ligand.