
Table 1
Protocol for bolus and dose adjustment when using UFH on CRRT
Modified unfractionated weight-based heparin nomogram
Target: aPTT x2 Initial Dose (Bolus) 50 UI/Kg * Maintenance 10 - 15 UI/Kg/H
| Plasma aPTT found | Continuous rate action | Bolus | Check time |
|---|---|---|---|
| Plasma aPTT <35 sec | + 4 UI/Kg/h | Rebolus 50 UI/Kg | aPTT afte (3h) |
| Plasma aPTT 35 - 45 sec | + 2 UI/Kg/h | Rebolus 20 UI/Kg | aPTT after (3h) |
| Plasma aPTT 46 - 60 sec | + 2 UI/Kg/h | - | aPTT after (3h) |
| Plasma aPTT 60 - 70 sec | - | - | aPTT after (4h) |
| Plasma aPTT 71 - 90 sec | - 2 UI/Kg/h | - | aPTT after (3h) |
| Plasma aPTT > 90 sec | - 3 UI/Kg/h | Stop Cont. inf 60 min | aPTT after (2h) |
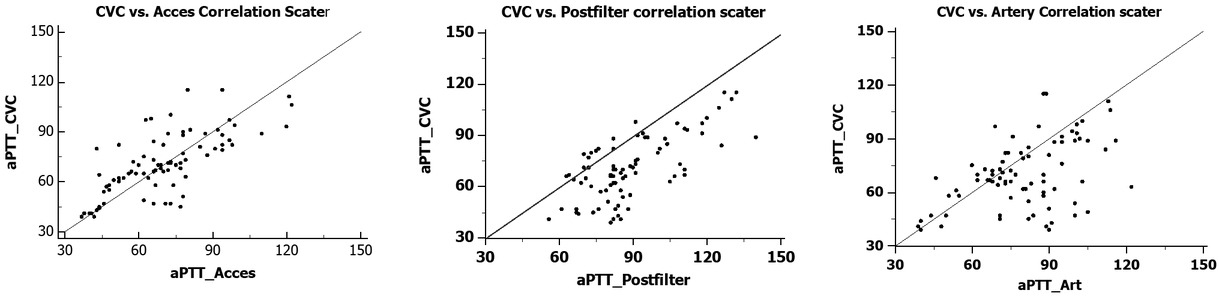
Fig. 1
Correlation aPTT plots reported to CVC sampling site
Table 2
Correlations and Descriptive Statistics (N = 84) - aPTT values for CVC, Access, Postfilter and Artery
| Variables | 1 | 2 | 3 | 4 | |
|---|---|---|---|---|---|
| 1 | CVC (sec.) | - | 0.72 (r) | 0.69 (r) | 0.46 (r) |
| 2 | Access (sec.) | 0.72 (r) | - | 0.62 (r) | 0.43 (r) |
| 3 | Postfilter (sec.) | 0.69 (r) | 0.62 (r) | - | 0.47 (r) |
| 4 | Artery (sec.) | 0.46 (r) | 0.43 (r) | 0.47 (r) | - |
Table 3
Correlations and Descriptive Statistics depending on artery age
aPTT values for patients with Artery younger than 3 days ---- (n=45)
| Variables (sec.) | 1 | 2 | 3 | 4 | |
|---|---|---|---|---|---|
| 1 | CVC | - | 0.80 (r) | 0.71 (r) | 0.75 (r) |
| 2 | Access | 0.80 (r) | - | 0.62 (r) | 0.67(r) |
| 3 | Postfilter | 0.71 (r) | 0.62 (r) | - | 0.57(r) |
| 4 | Artery | 0.75 (r) | 0.67 (r) | 0.57 (r) | |
| aPTT values for patients with Artery age between 4 to 6 days---- (n=39) | |||||
| Variables (sec.) | 5 | 6 | 7 | 8 | |
|---|---|---|---|---|---|
| 5 | CVC | - | 0.60 (r) | 0.64 (r) | 0.23 (r) |
| 6 | Access | 0.60 (r) | - | 0.61 (r) | 0.35 (r) |
| 7 | Postfilter | 0.64 (r) | 0.61(r) | - | 0.45 (r) |
| 8 | Artery | 0.23 (r) | 0.39 (r) | 0.45 (r) |
[i] aPTT values: Samples from patients with young artery 1-(CVC) = heparin free central venous nondialysis catheter; 2- (Access) = circuit access line; 3-(Postfilter) = circuit return line; 4-(Artery) = arterial line with heparinized solution. Sites aPTT values from patients with old Artery 5-(CVC), 6- (Access), 7-(Postfilter), 8-(Artery). r - correlation coefficient (r). Coefficients printed in bold are significant (p < 0.05).
Table 4
Comparison of CVC, Access, Postfilter and Artery aPTT values
| Section A | All patients group (84) | Mean (SD) | p value | |
|---|---|---|---|---|
| Access (sec.) | 73 (±20) | p = 0.74 | ||
| Posftilter (sec.) | 92 (±19) | p < 0.01 | 75 (±18) | |
| Artery (sec.) | 82 (±18) | p < 0.01 | ||
| Section B | Young Artery group (45) | Mean (SD) | p value | CVC (sec.) |
|---|---|---|---|---|
| Access (sec.) | 75 (±17) | p = 0.74 | ||
| Posftilter (sec.) | 91 (±19) | p < 0.01 | 74 (±18) | |
| Artery (sec.) | 76 (±20) | p = 0.63 | ||
| Section C | Old Artery group (39) | Mean (SD) | p value | CVC (sec.) |
|---|---|---|---|---|
| Access (sec.) | 63 (±16) | p = 0.46 | ||
| Posftilter (sec.) | 86 (±16) | p < 0.01 | 66 (±18) | |
| Artery (sec.) | 85 (±14) | p < 0.01 |
[i] aPTT mean (SD) values expressed in seconds compared to CVC sampling site. Section A - All 84 patients; Section B - Young artery group (patients that at assessment time had indwelling arterial line not older than three days); Section C - Patients group with older artery line. Data printed in bold had statistical significance (p < 0.05)