
Table 1
Demographic data and length of stay in ICU for Group A (sepsis) and Group B (septic shock)
Table 2
qSOFA, SOFA, MODS, APACHE II scores in Groups A and B
| Variables | Group A | Group B | P value |
|---|---|---|---|
| qSOFA score (median) | 2 | 2 | >0.999 |
| SOFA (median, score range) | 5 (0-16) | 8 (0-18) | <0.0001 |
| MODS (median, score range) | 4.9 (0-10) | 9.2 (2-18) | <0.0001 |
| APACHE (median, II range) score | 17 (6-39) | 23 (5-39) | <0.0001 |
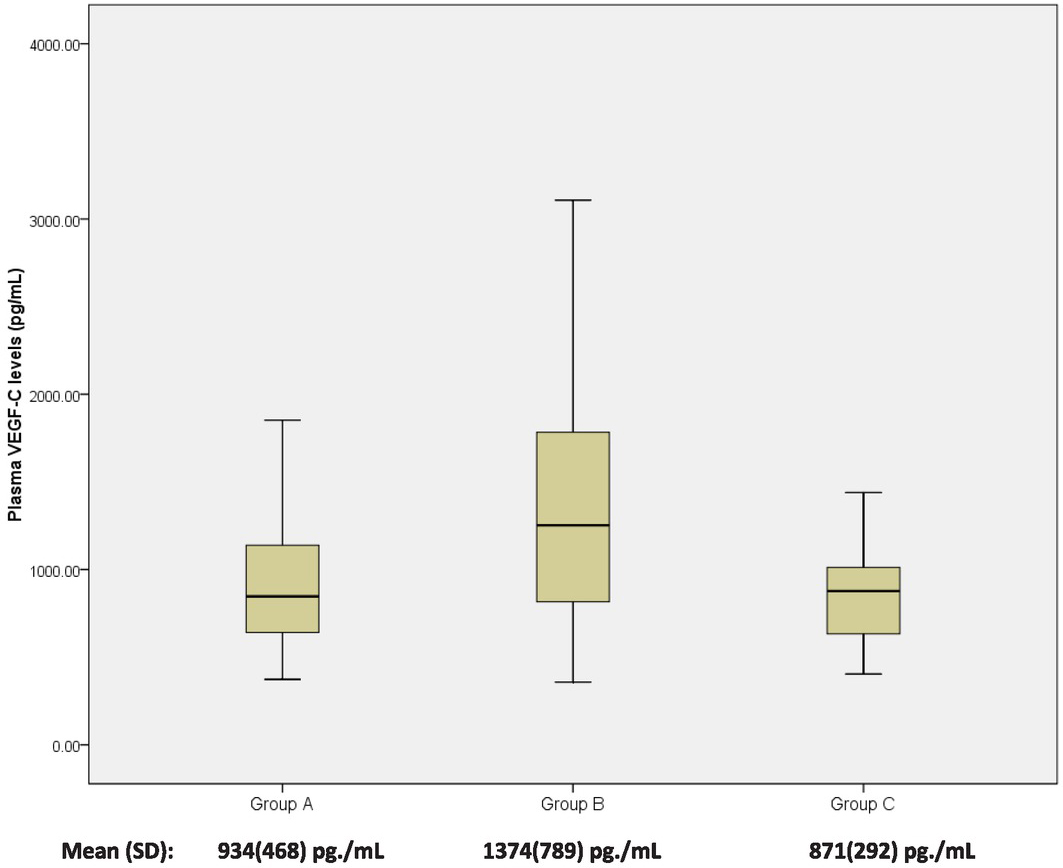
Fig. 1
Mean values of plasma VEGF-C levels in Group A (sepsis), Group B (septic shock) and Group C (healthy controls)
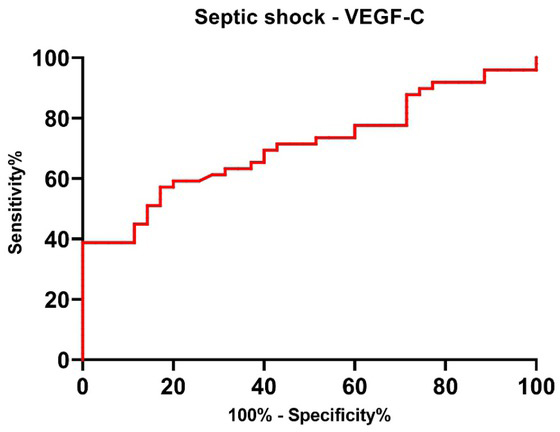
Fig. 2
ROC curve for plasma VEGF-C levels for septic shock (AUC = 0.709, p = 0.001)