
Fig. 1
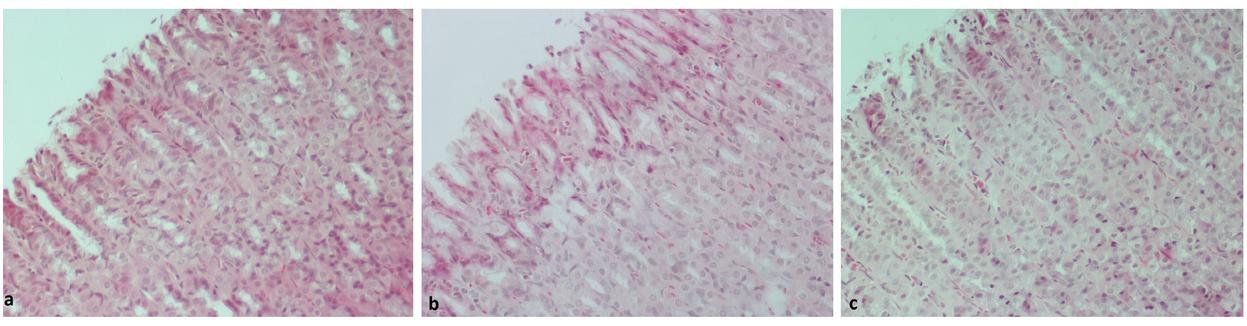
Fig. 2
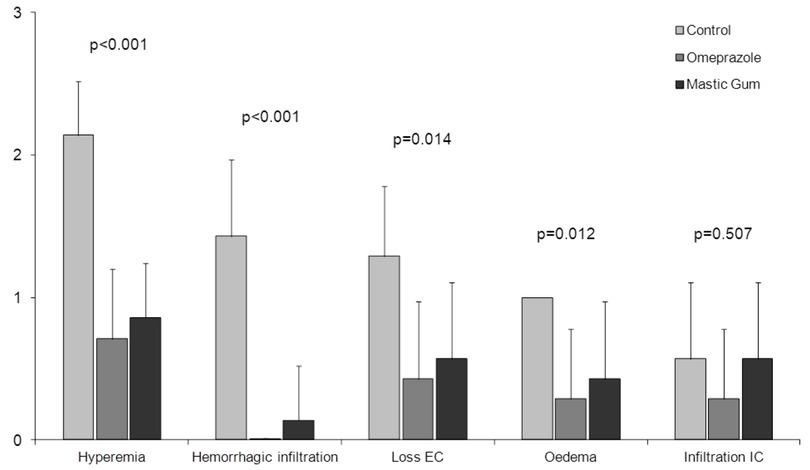
Fig. 3
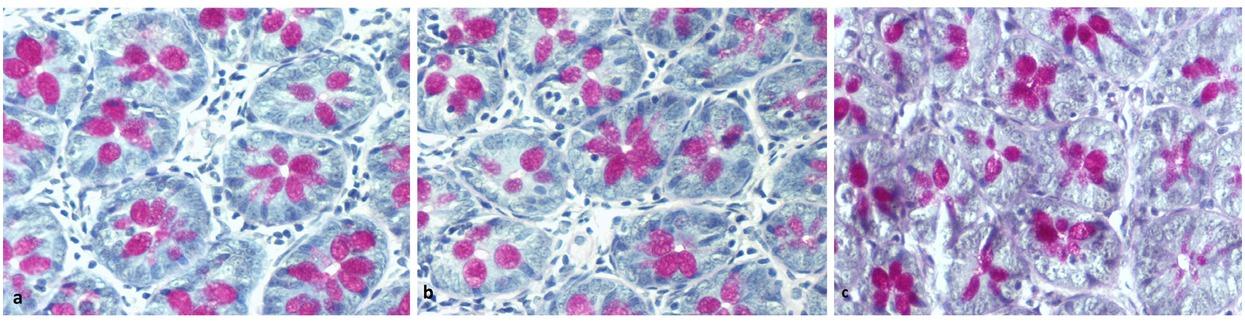
Fig. 4
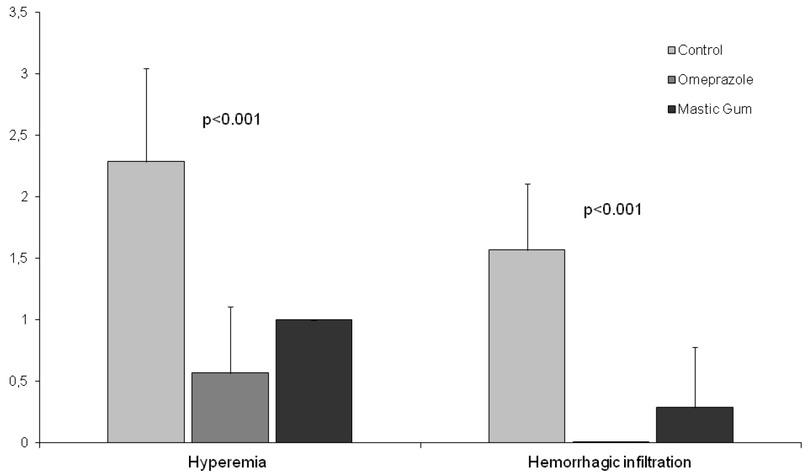
Fig. 5
Mucosal lesions observed in the ascending colon in the three groups
| Groups | Multiple comparisons | ||||||
|---|---|---|---|---|---|---|---|
| C | O | M | p value | C vs O | C vs M | O vs M | |
| Hyperemia | 0.001a | ||||||
| Negative | 0 (0.0) | 3 (42.9) | 0 (0.0) | ||||
| Low | 1 (14.3) | 4 (57.1) | 7 (100.0) | ||||
| Moderate | 3 (42.9) | 0 (0.0) | 0 (0.0) | ||||
| High | 3 (42.9) | 0 (0.0) | 0 (0.0) | ||||
| Mean value (SD) | 2.29 (0.76) | 0.57 (0.54) | 1.00 (0.0) | <0.001b | <0.001c | <0.001c | 0.151c |
| Median value (min-max) | 2 (1 – 3) | 1 (0 – 1) | 1 | 0.001d | 0.003e | 0.003e | 0.060e |
| Hemorrhagic infiltration | 0.002 | ||||||
| Negative | 0 (0.0) | 7 (100.0) | 5 (71.4) | ||||
| Low | 3 (42.9) | 0 (0.0) | 2 (28.6) | ||||
| Moderate | 4 (57.1) | 0 (0.0) | 0 (0.0) | ||||
| High | 0 (0.0) | 0 (0.0) | 0 (0.0) | ||||
| Mean value (SD) | 1.57 (0.54) | 0.0 (0.0) | 0.29 (0.49) | <0.001 | <0.001 | <0.001 | 0.217 |
| Median value (min-max) | 2 (1 – 2) | 0 | 0 (0 – 1) | <0.001 | 0.001 | 0.004 | 0.141 |
| Average Histological Score,mean (SD) | 3.86 (1.22) | 0.57 (0.54) | 1.29 (0.49) | <0.001 | <0.001 | <0.001 | 0.119 |
| Number of Goblet cells | 50.54 (3.56) | 52.71 (2.84) | 52.51 (2.83) | 0.370 | 0.206 | 0.249 | 0.905 |
Gastric mucosal lesions in the three groups
| Groups | Multiple comparisons | ||||||
|---|---|---|---|---|---|---|---|
| C | O | M | p value | C vs O | C vs M | O vs M | |
| Hyperemia | 0.001a | ||||||
| Negative | 0 (0.0) | 2 (28.6) | 1 (14.3) | ||||
| Low | 0 (0.0) | 5 (71.4) | 6 (85.7) | ||||
| Moderate | 6 (85.7) | 0 (0.0) | 0 (0.0) | ||||
| High | 1 (14.3) | 0 (0.0) | 0 (0.0) | ||||
| Mean value (SD) | 2.14 (0.38) | 0.71 (0.49) | 0.86 (0.38) | <0.001b | <0.001c | <0.001c | 0.530c |
| Median value (min-max) | 2 (2 – 3) | 1 (0 – 1) | 1 (0 – 1) | <0.001d | 0.001e | 0.001e | 0.530e |
| Hemorrhagic infiltration | 0.001 | ||||||
| Negative | 0 (0.0) | 7 (100.0) | 6 (85.7) | ||||
| Low | 4 (57.1) | 0 (0.0) | 1 (14.3) | ||||
| Moderate | 3 (42.9) | 0 (0.0) | 0 (0.0) | ||||
| High | 0 (0.0) | 0 (0.0) | 0 (0.0) | ||||
| Mean value (SD) | 1.43 (0.54) | 0.0 (0.0) | 0.14 (0.38) | <0.001 | <0.001 | <0.001 | 0.489 |
| Median value (min-max) | 1 (1 – 2) | 0 | 0 (0 – 1) | <0.001 | 0.001 | 0.002 | 0.317 |
| Loss EC | 0.084 | ||||||
| Negative | 0 (0.0) | 4 (57.1) | 3 (42.9) | ||||
| Low | 5 (71.4) | 3 (42.9) | 4 (57.1) | ||||
| Moderate | 2 (28.6) | 0 (0.0) | 0 (0.0) | ||||
| High | 0 (0.0) | 0 (0.0) | 0 (0.0) | ||||
| Mean value (SD) | 1.29 (0.49) | 0.43 (0.54) | 0.57 (0.54) | 0.014 | 0.006 | 0.019 | 0.613 |
| edian value (min-max) | 1 (1 – 2) | 0 (0 – 1) | 1 (0 – 1) | 0.026 | 0.015 | 0.030 | 0.606 |
| Oedema | 0.017 a | ||||||
| Negative | 0 (0.0) | 5 (71.4) | 4 (57.1) | ||||
| Low | 7 (100.0) | 2 (28.6) | 3 (42.9) | ||||
| Moderate | 0 (0.0) | 0 (0.0) | 0 (0.0) | ||||
| High | 0 (0.0) | 0 (0.0) | 0 (0.0) | ||||
| Mean value (SD) | 1.00 (0.0) | 0.29 (0.49) | 0.43 (0.54) | 0.012b | 0.005c | 0.020c | 0.530c |
| Median value (min-max) | 1 | 0 (0 – 1) | 0 (0 – 1) | 0.020d | 0.007e | 0.023e | 0.591e |
| Infiltration IC | 0.466 | ||||||
| Negative | 3 (42.9) | 5 (71.4) | 3 (42.9) | ||||
| Low | 4 (57.1) | 2 (28.6) | 4 (57.1) | ||||
| Moderate | 0 (0.0) | 0 (0.0) | 0 (0.0) | ||||
| High | 0 (0.0) | 0 (0.0) | 0 (0.0) | ||||
| Mean value (SD) | 0.57 (0.54) | 0.29 (0.49) | 0.57 (0.54) | 0.507 | 0.317 | 1.000 | 0.317 |
| Median value (min-max) | 1 (0 – 1) | 0 (0 – 1) | 1 (0 – 1) | 0.483 | 0.298 | 1.000 | 0.298 |
| Average histological score, mean (SD) | 6.43 (1.13) | 1.71 (0.95) | 2.57 (1.62) | <0.001 | <0.001 | <0.001 | 0.221 |
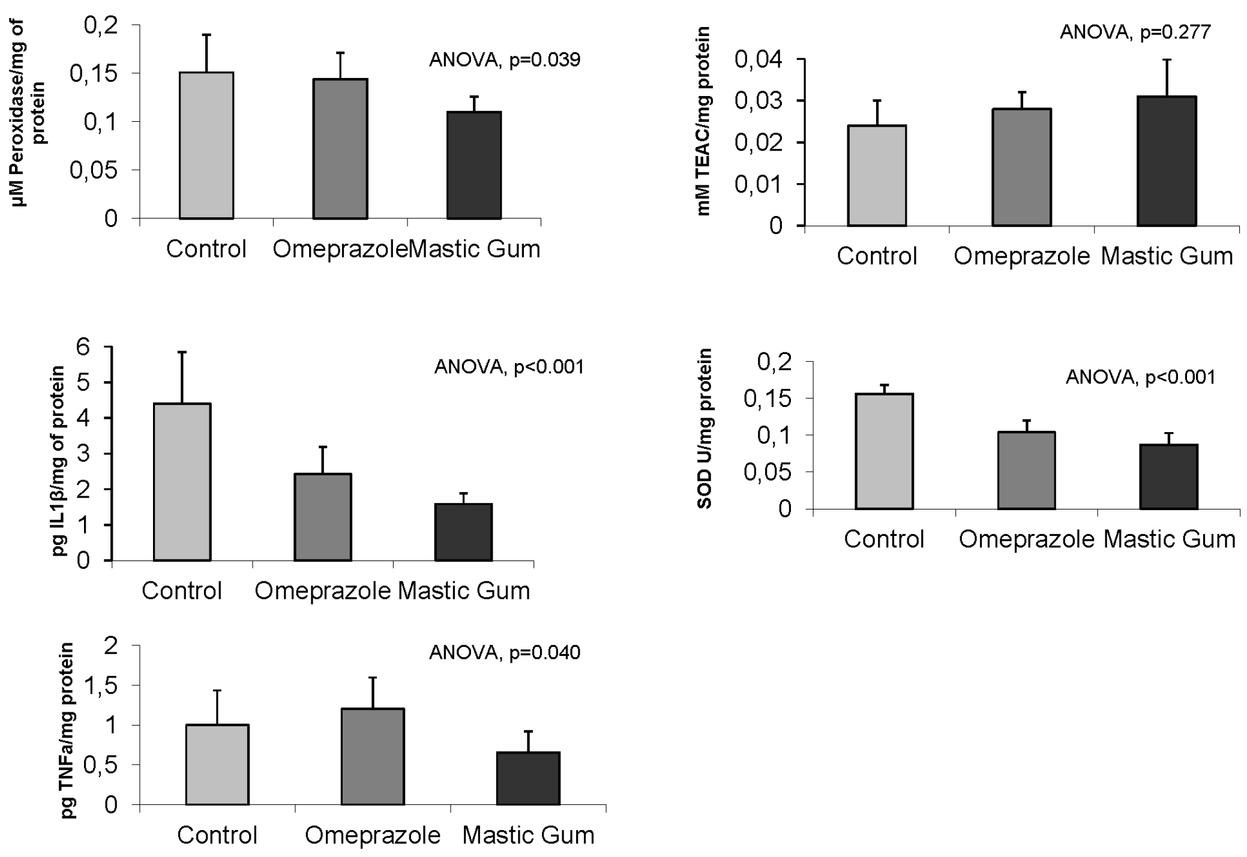
Serum antioxidant and anti-inflammatory markers in the three groups
| Groups | Multiple comparisonsb | ||||||
|---|---|---|---|---|---|---|---|
| C | O | M | p value a | C vs O | C vs M | O vs M | |
| μΜ Peroxidase/mg of protein | 0.151 (0.039) | 0.144 (0.027) | 0.110 (0.016) | 0.039 | 0.666 | 0.018 | 0.043 |
| mM TEAC/mg protein | 0.024 (0.006) | 0.028 (0.004) | 0.031 (0.009) | 0.277 | 0.386 | 0.114 | 0.450 |
| SOD U/mg protein | 0.156 (0.012) | 0.104 (0.016) | 0.087 (0.016) | <0.001 | <0.001 | <0.001 | 0.047 |
| pg TNFa/mg protein | 0.999 (0.437) | 1.202 (0.396) | 0.653 (0.264) | 0.040 | 0.322 | 0.100 | 0.013 |
| pg IL1β/mg of protein | 4.399 (1.450) | 2.426 (0.762) | 1.587 (0.291) | <0.001 | 0.001 | <0.001 | 0.120 |