
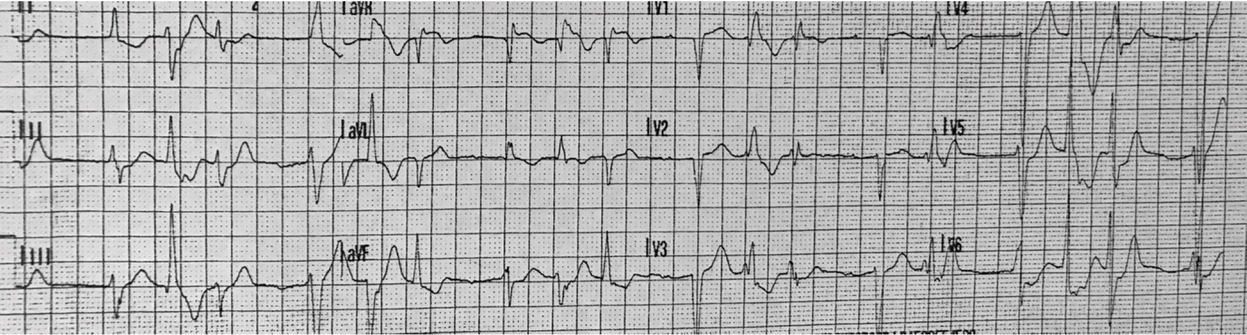
Fig. 1
12 lead ECG, Obtained by paramedics at the pickup location
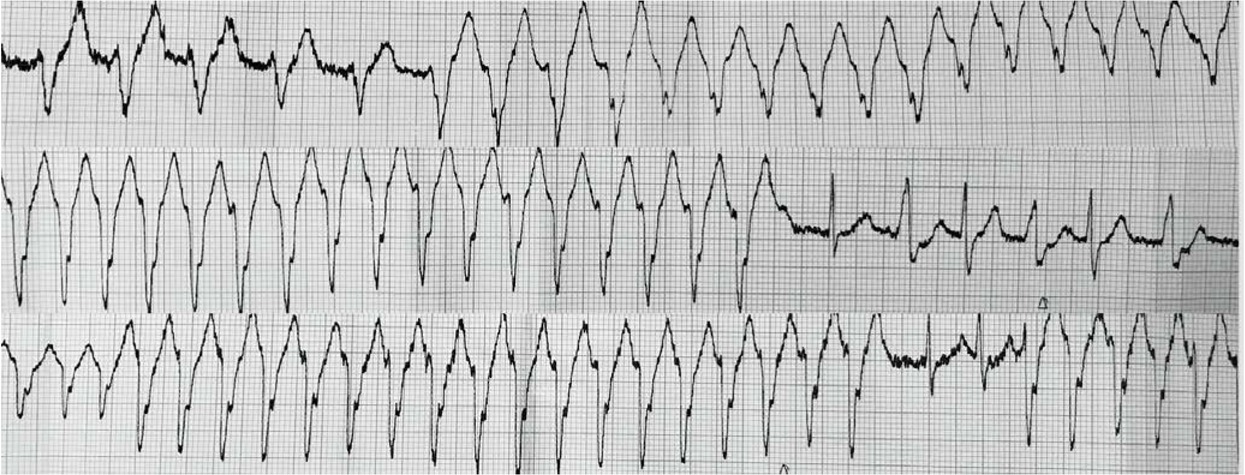
Fig. 2
Rhythm strips, obtained in the emergency department, five minutes post-admission.
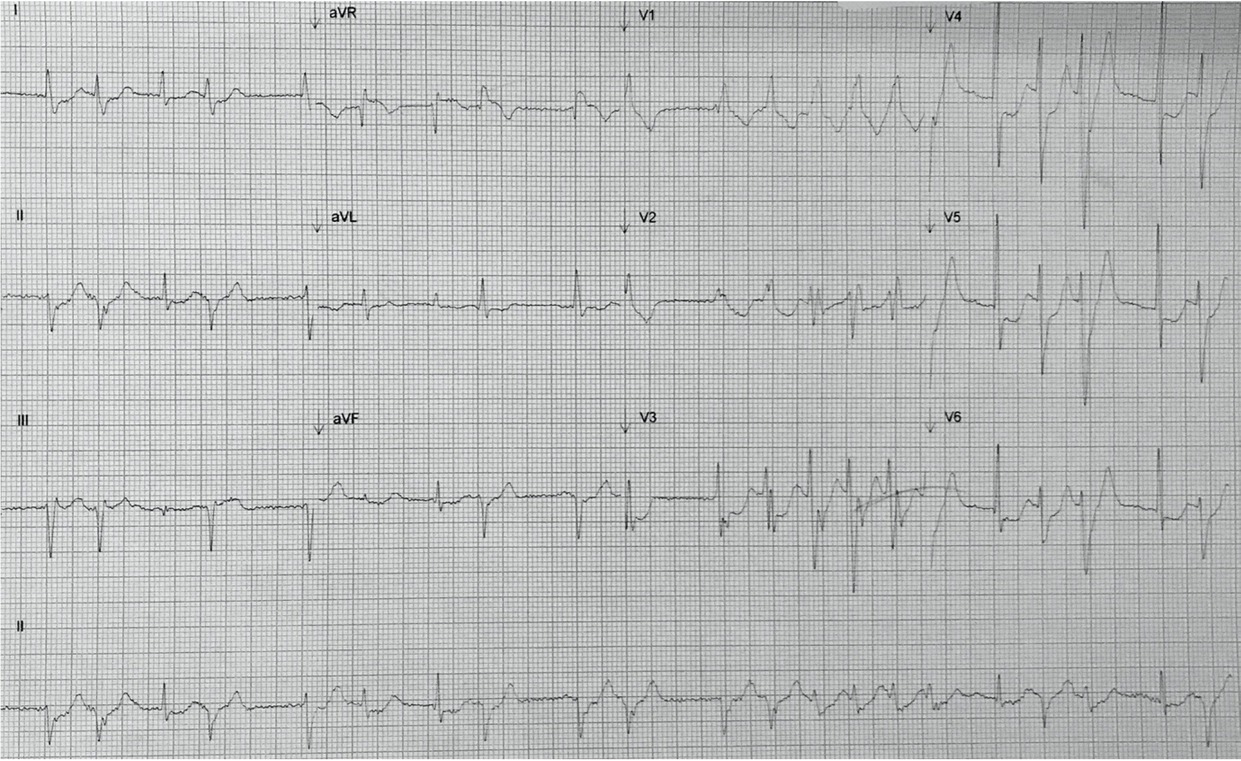
Fig 3
12 lead ECG post amiodarone infusion, obtained in the emergency department. Two hours following admission to hospital.
Table 1
Arterial Blood Gas (ABG) analysis following intubation. Five minutes and four hours following admission to hospital.
| Blood gas analysis | Intubation (FIO2 =1) | ICU (+4 hours) (FIO2 =0.35) | |
|---|---|---|---|
| pH | 7.316 | 7.35 | |
| PaCO2 | 5.03 | 5.36 | kPa |
| PaO2 | 47.4 | 19.4 | kPa |
| thb | 127 | 125 | g/L |
| sO2 | 100 | 99 | % |
| Electrolytes | |||
| K | 3.3 | 4.5 | mmol/L |
| Ca | 1.07 | 1.07 | mmol/L |
| Na | 141 | 142 | mmol/L |
| HCO3- | 19.3 | 21 | mmol/L |
| Metabolites | |||
| Glucose | 5.5 | 6.5 | mmol/L |
| Lactate | 4.8 | 2.4 | mmol/L |
| Oxygen status | |||
| xBase(Ecf)c | -6.9 | -2 | mmol/L |
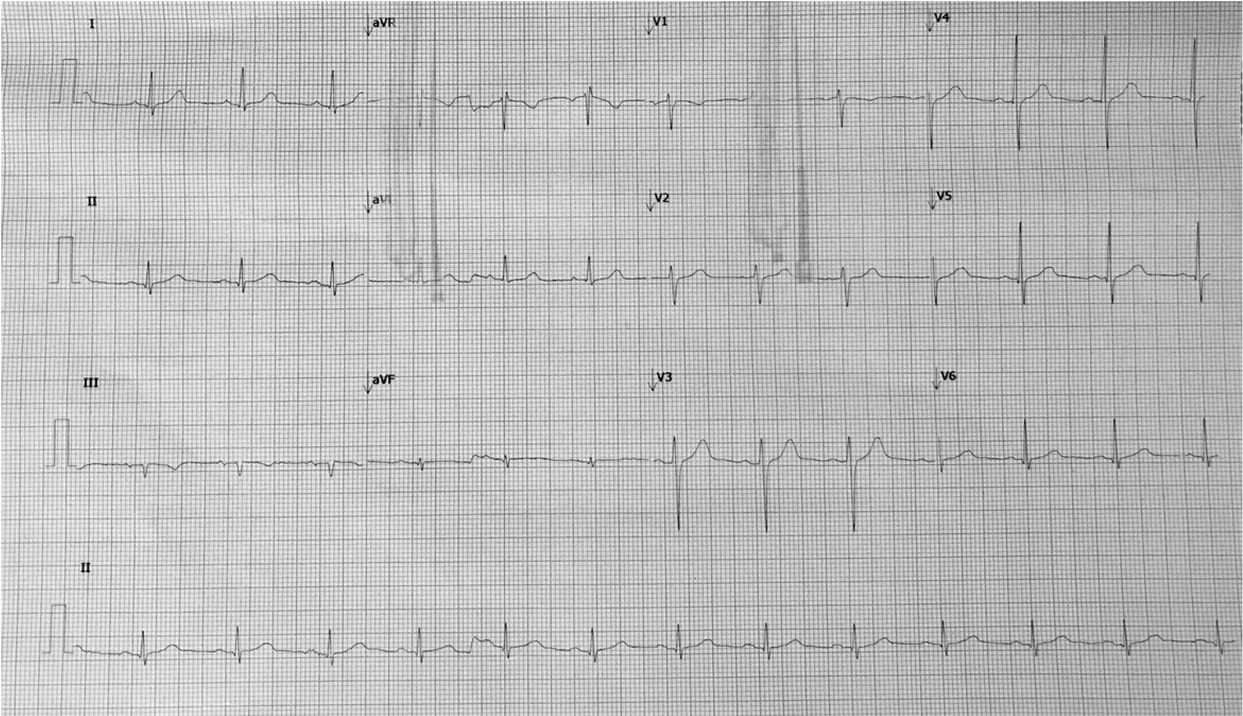
Fig. 4
12 lead ECG 48 hours. Day two following admission.