
Fig. 1
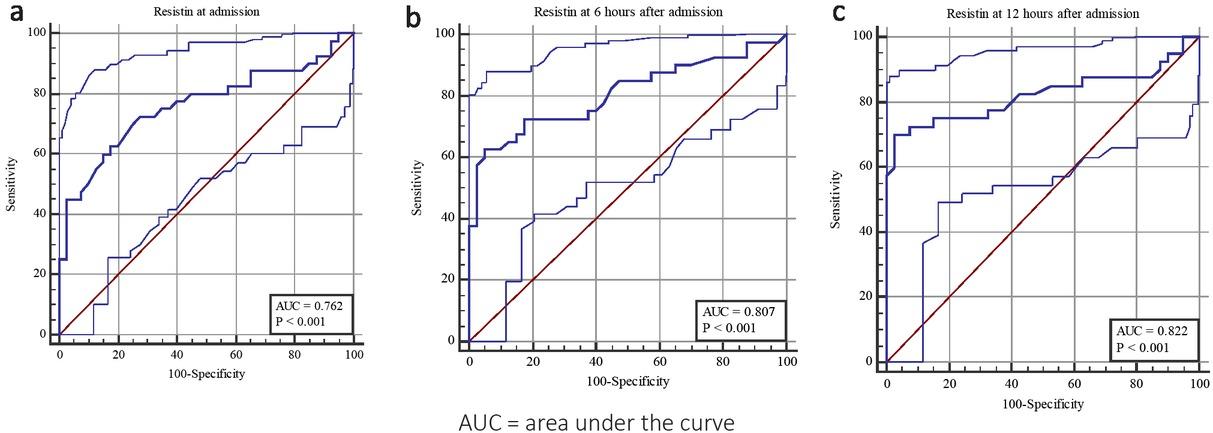
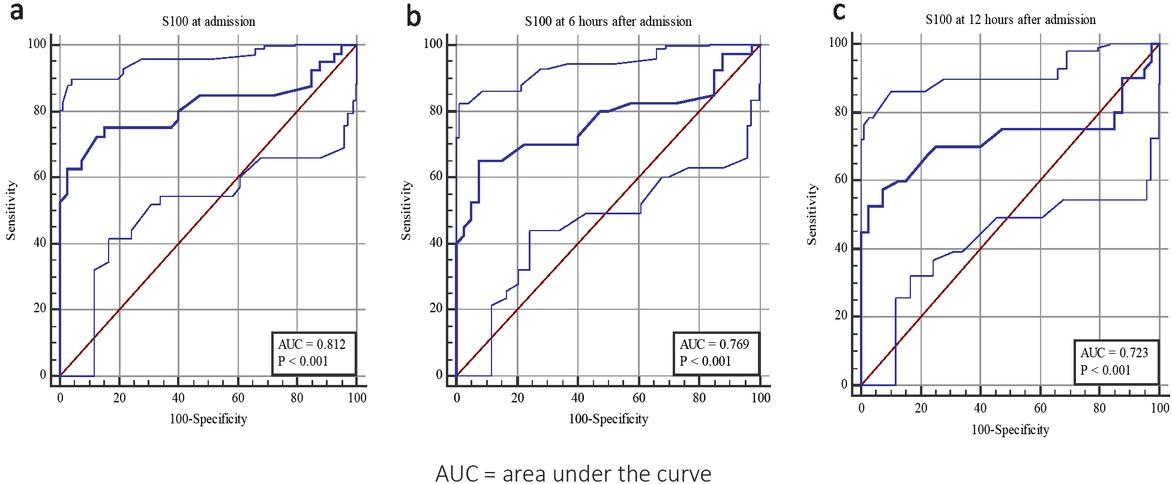
Fig. 2
Serum levels of biomarkers in the first three days, a comparison between Group A and Group B
| Parameters | Time intervals (hours) | Group A* | Group B * | p -values |
|---|---|---|---|---|
| Resistin | 0 | 7.15 (4.67 to 11.85) | 4.10 (2.50 to 5.75) | < 0.001 |
| ng/ml | 6 | 9.85 (4.47 to 17.75) | < 0.001 | |
| 12 | 13.55 (5.55 to 21.02) | < 0.001 | ||
| 24 | 12.30 (6.77 to 21.00) | < 0.001 | ||
| 48 | 7.25 (3.57 to 14.65) | 0.004 | ||
| 72 | 7.40 (3.6 to 11.90) | 0.002 | ||
| S100B | 0 | 25.85 (7.07 to 102.52) | 5.45 (4.00 to 8.47) | < 0.001 |
| pg/ml | 6 | 17.45 (5.60 to 137.10) | < 0.001 | |
| 12 | 19.70 (4.25 to 127.02) | 0.001 | ||
| 24 | 15.20 (5.60 to 134.62) | < 0.001 | ||
| 48 | 14.10 (6.10 to 79.65) | 0.001 | ||
| 72 | 8.90 (3.80 to 36.55) | 0.05 | ||
Cut-off values for S100B for the first 3 measurements following inclusion to the study
| S100B | AUC (CI95%) | Cut-of pg/ml | Sensitivity (CI 95%) | Specificity (CI 95%) | p |
|---|---|---|---|---|---|
| 0 hours | 0.812 (0.709 to 0.891) | > 8.9 | 75.00 (58.8 - 87.3) | 85.00 (70.2 - 94.3) | <0.001 |
| 6 hours | 0.769 (0.661 to 0.856) | > 11.6 | 65.00 (48.3 - 79.4) | 92.50 (79.6 - 98.4) | <0.001 |
| 12 hours | 0.723 (0.612 to 0.818) | > 11.6 | 57.50 (40.9 - 73.0) | 92.50 (79.6 - 98.4) | <0.001 |
Cut-off values for resistin for the first 3 measurements following inclusion to the study
| Resistin | AUC (CI95%) | Cut-of ng/ml | Sensitivity (CI 95%) | Specificity (CI 95%) | p |
|---|---|---|---|---|---|
| 0 hours | 0.762 (0.653 to 0.850) | > 5.5 | 72.50 (56.1 – 84.5) | 72.50 (56.1 – 84.5) | <0.001 |
| 6 hours | 0.807 (0.703 to 0.887) | > 7.6 | 62.50 (45.8 – 77.3) | 95.00 (83.1 – 99.4) | <0.001 |
| 12 hours | 0.822 (0.720 to 0.898) | > 8.2 | 70.00 (53.5 – 83.4) | 97.50 (86.8 – 99.9) | <0.001 |