
Table 1
Demographic data and respondents’ professional details
| n (=111) | % | ||
|---|---|---|---|
| Type of institution | |||
| University medical centre | 24 | 21.6 | |
| Hospital in capital | 30 | 27.1 | |
| County hospital | 44 | 39.6 | |
| Other hospitals | 13 | 11.7 | |
| Respondents’ post | |||
| Specialist candidate (trainees) | 22 | 19.8 | |
| Specialist | 58 | 52.3 | |
| Chief medical officer | 31 | 27.9 | |
| Length of practice in anaesthesia | |||
| < 5 yrs | 20 | 18.0 | |
| 5 – 10 yrs | 21 | 18.9 | |
| > 10 yrs | 70 | 63.1 | |
| The annual number of major abdominal surgery per centre | |||
| < 100 | 6 | 5.4 | |
| 100 – 200 | 11 | 9.9 | |
| 200 – 300 | 22 | 19.8 | |
| 300 – 400 | 12 | 10.8 | |
| > 400 | 60 | 54.1 | |
[i] Data are expressed as the number and percentage of respondents
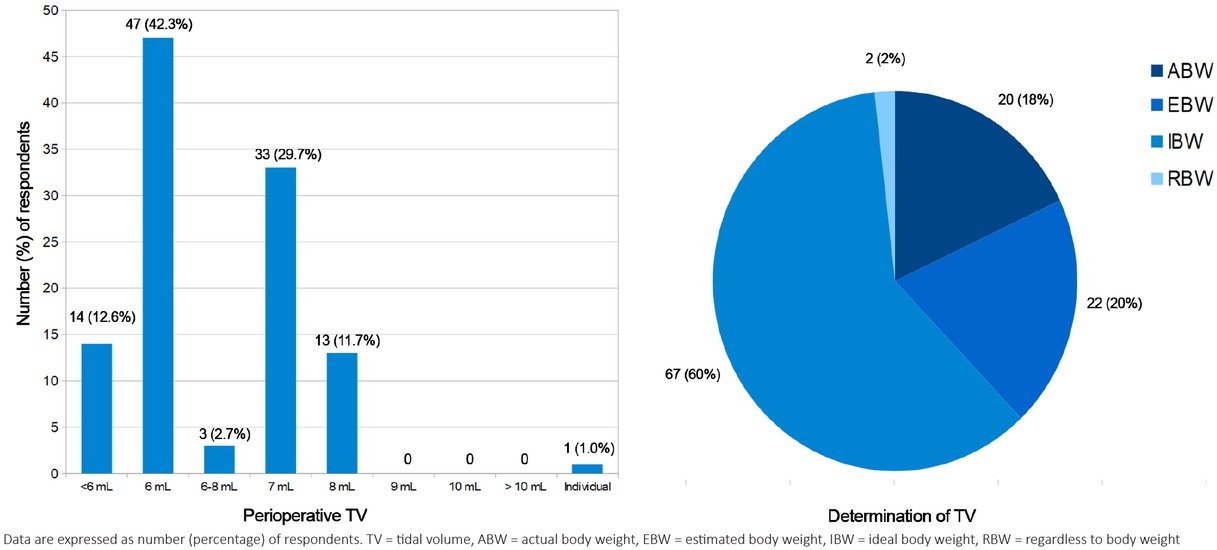
Fig. 1
Use of low tidal volume (TV) and ideal body weight (IBW) to determine the appropriate TV are common: 54.9% of respondents apply a low TV of 6 ml/kg or less and 60% of them use IBW. However, applying a TV of 7 ml/kg is also frequent and 38% of respondents use actual or estimated body weight to determine the appropriate TV and 2% of them do not take the patient’s weight into account (RBW).
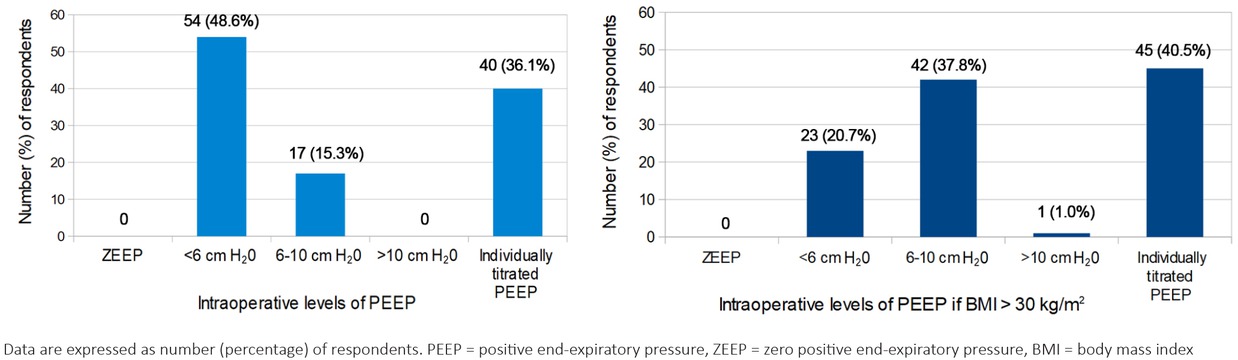
Fig. 2
None of the respondents apply zero positive end-expiratory pressure (PEEP) during mechanical ventilation. Half of the respondents commonly use lower levels of PEEP (48.6%), and only 36.1% apply an individually optimal level of PEEP determined during a PEEP titration procedure. In contrast to these results, presumably based on pathophysiological rationality, both moderate (6-10 cmH2O, 37.8%) and individually titrated levels of PEEP (40.5%) are commonly considered appropriate for obese patients (body mass index greater than 30 kg/m2).
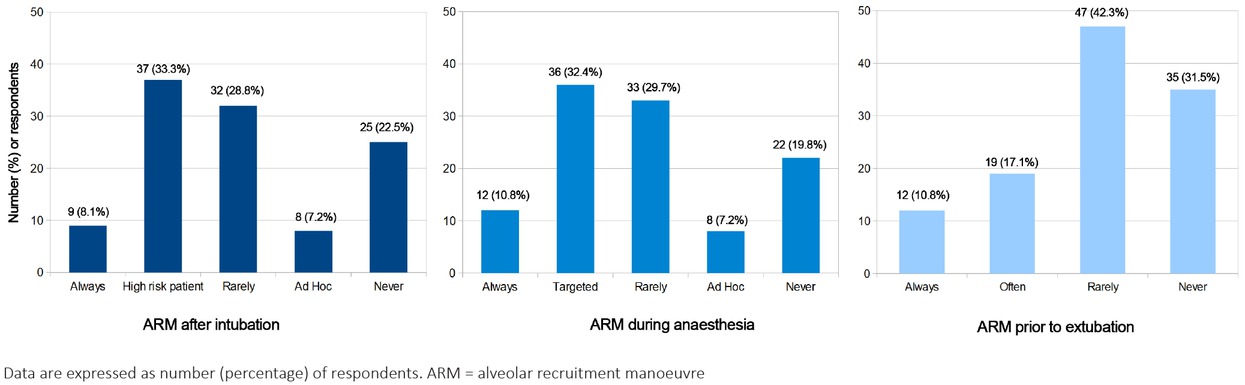
Fig. 3
Routine and regular use of alveolar recruitment manoeuvres (ARM) is rare after endotracheal intubation (8.1%), during general anaesthesia (10.8%) and prior to extubation procedure (10.8%). Based on our data ARM is a procedure for high-risk patients (33.3%) and usually used during anaesthesia when a decreasing oxygen saturation is detected (32.4%). Approximately 20-30% of respondents never use ARM during any phase of general anaesthesia.
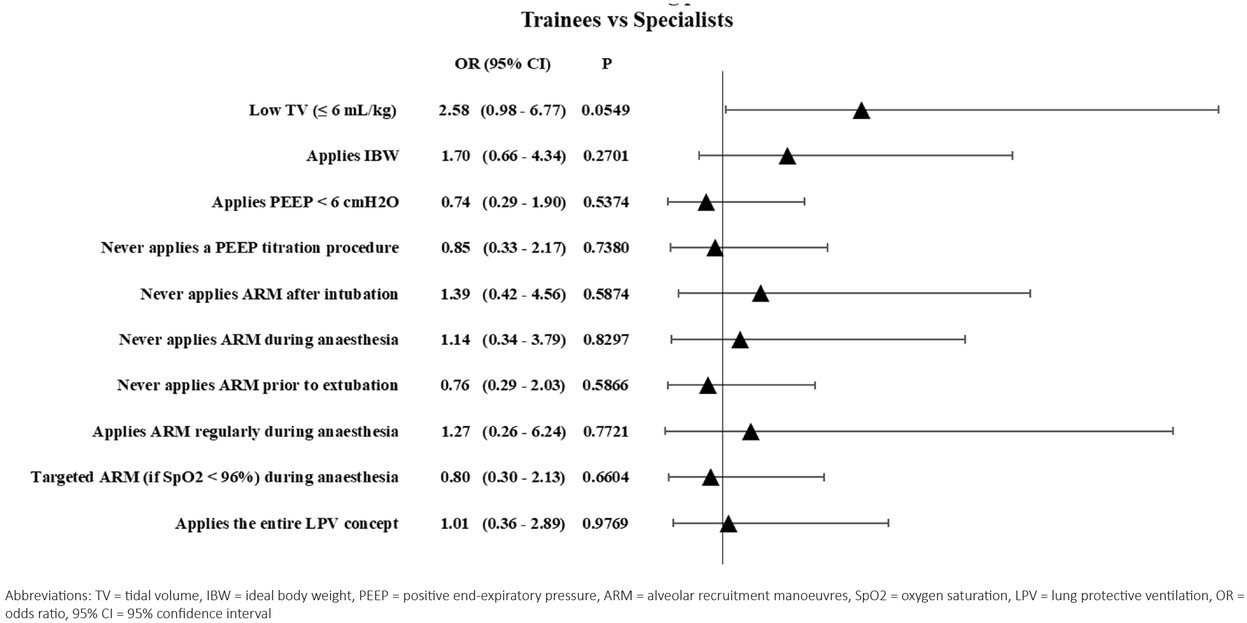
Fig. 4
Forest plot for the application of the basic elements of lung-protective ventilation. Differences between groups with P values less than 0.05 were considered significant. Despite obvious practice variations were evaluated between trainees and specialist, these differences were not significant statistically.
Table 2
Use of the basic elements of lung protective ventilation
| Trainees | Specialists | ||||||
|---|---|---|---|---|---|---|---|
| n (=22) | % | n (=89) | % | OR (95% CI) | p | ||
| Low TV (≤ 6 mL/kg) | 8 | 36.4 | 53 | 59.6 | 2.58 | (0.98 – 6.77) | 0.0549 |
| Applies IBW | 11 | 50.0 | 56 | 62.9 | 1.70 | (0.66 – 4.34) | 0.2701 |
| PEEP < 6 cmH2O | 12 | 54.5 | 42 | 47.2 | 0.74 | (0.29 – 1.90) | 0.5374 |
| Never applies a PEEP titration procedure | 12 | 54.5 | 45 | 50.6 | 0.85 | (0.33 – 2.17) | 0.7380 |
| Never applies ARM after intubation | 4 | 18.2 | 21 | 23.6 | 1.39 | (0.42 – 4.56) | 0.5874 |
| Never applies ARM during anaesthesia | 4 | 18.2 | 18 | 20.2 | 1.14 | (0.34 – 3.79) | 0.8297 |
| Never applies ARM before extubation | 8 | 36.4 | 27 | 30.3 | 0.76 | (0.29 – 2.03) | 0.5866 |
| Applies ARM regularly during anaesthesia | 2 | 9.1 | 10 | 11.2 | 1.27 | (0.26 – 6.24) | 0.7721 |
| Targeted ARM (if SpO2 < 96%) during anaesthesia | 8 | 36.4 | 28 | 31.5 | 0.80 | (0.30 – 2.13) | 0.6604 |
| Applies the entire LPV concept | 6 | 27.3 | 24 | 26.9 | 1.01 | (0.36 – 2.89) | 0.9769 |
[i] TV = tidal volume, IBW = ideal body weight, PEEP = positive end-expiratory pressure, ARM = alveolar recruitment manoeuvres, SpO2 = oxygen saturation, LPV = lung protective ventilation, OR = odds ratio, 95% CI = 95% confidence intervals
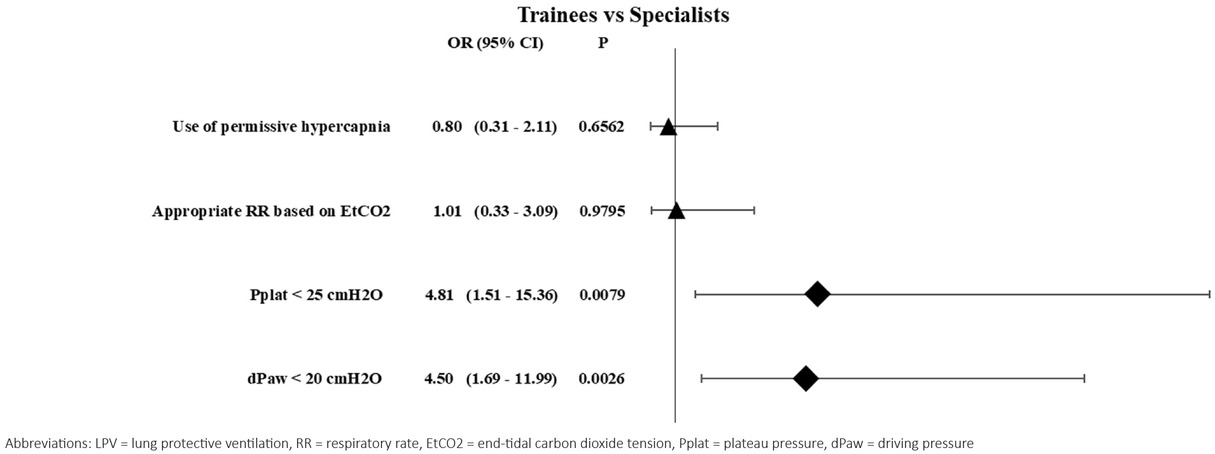
Fig. 5
Forest plot for the application of the other elements of lung-protective ventilation. Differences between groups with P values less than 0.05 were considered significant. Differences in the application of low Pplat and low dPaw between trainees and specialists was statistically significant. Application of these two target parameters are more common among specialists.
Table 3
Use of other elements of lung protective ventilation
| Trainees | Specialists | ||||||
|---|---|---|---|---|---|---|---|
| n (=22) | % | n (=89) | % | OR (95% CI) | p | ||
| Use of permissive hypercapnia | 14 | 63.6 | 52 | 58.4 | 0.80 | (0.31 – 2.11) | 0.6562 |
| Appropriate RR based on EtCO2 | 17 | 77.3 | 69 | 77.5 | 1.01 | (0.33 – 3.09) | 0.9795 |
| Pplat < 25 cmH2O | 4 | 18.2 | 46 | 51.7 | 4,81 | (1.51 – 15.36) | 0.0079 |
| dPaw < 20 cmH2O | 4 | 18.2 | 25 | 28.1 | 4,50 | (1.69 – 11.99) | 0.0026 |
[i] RR = respiratory rate, EtCO2 = end-tidal carbon dioxide tension, Pplat = plateau pressure, dPaw = driving pressure, OR = odds ratio, 95% CI = 95% confidence intervals
Table 4
Preoperative assessment: examinations and prescribed interventions
| Physiotherapy | Chest X-ray | Spirometry | ABGA | PPPVS | ||||||
|---|---|---|---|---|---|---|---|---|---|---|
| Always | 3 | (2.7) | 46 | (41.1) | 0 | (0) | 7 | (6.3) | 0 | (0) |
| In patients with COPD | 49 | (43.8) | 44 | (39.3) | 101 | (90.2) | 63 | (56.3) | 8 | (7.1) |
| In patients with bronchial asthma | 25 | (22.3) | 30 | (26.8) | 84 | (75.0) | 22 | (19.6) | 3 | (2.7) |
| Inactive smokers | 18 | (16.1) | 22 | (19.6) | 18 | (16.1) | 10 | (8.9) | 0 | (0) |
| In case of actual intermittent respiratory disease | 11 | (9.8) | 38 | (33.9) | 30 | (26.8) | 25 | (22.3) | 5 | (4.5) |
| In patients with abnormal chest X-ray or lung CT scan | 17 | (15.2) | n/a | 47 | (42.0) | 24 | (21.4) | 2 | (1.8) | |
| If low SpO2 (< 96%) is observed during an assessment | 20 | (17.9) | 41 | (36.6) | 46 | (41.1) | 63 | (56.3) | 7 | (6.3) |
| Prior to acute or vital surgery | n/a | 16 | (14.3) | n/a | 45 | (40.2) | 7 | (6.3) | ||
| Never prescribed | 56 | (50) | 9 | (8) | 6 | (5.4) | 9 | (8.0) | 96 | (85.7) |
[i] Data are expressed as the number (and percentage) of answers. COPD = chronic obstructive pulmonary disease, CT = computer tomography, SpO2 = oxygen saturation, ABGA = arterial blood gas analysis, PPPVS = perioperative positive pressure ventilatory support
Table 5
Availability of perioperative breathing and intraoperative LPV protocols
| Other hospitals | University Medical Centres | ||||||
|---|---|---|---|---|---|---|---|
| n (=87) | % | n (=24) | % | OR (95% CI) | p | ||
| Availability of perioperative breathing protocols | 10 | 11.5 | 8 | 33.3 | 0.39 | (0.14 – 1.10) | 0.0747 |
| The absence of perioperative breathing protocols | 79 | 90.8 | 18 | 75.0 | 0.42 | (0.14 – 1.28) | 0.1262 |
| Availability of intraoperative LPV protocols | 6 | 6.9 | 2 | 8.3 | 0.82 | (0.15 – 4.32) | 0.8099 |
| The absence of intraoperative LPV protocols | 81 | 93.1 | 22 | 91.7 | 1.22 | (0.25 – 6.07) | 0.8062 |
[i] LPV = lung protective ventilation, OR = odds ratio, 95% CI = 95% confidence intervals
Table 6
Opinions about the risk factors of postoperative pulmonary complications
| Risk factors of PPC | Considered as important RF | ||
|---|---|---|---|
| n (=111) | % | 95% CI | |
| Thoracic surgery | 103 | 92.8 | 84.1 – 124.9 |
| Major abdominal surgery | 100 | 90.1 | 81.4 – 121.6 |
| COPD | 109 | 98.9 | 90.4 – 132.6 |
| Obesity | 97 | 87.4 | 78.7 – 118.3 |
| Residual neuromuscular blockade after surgery | 106 | 95.5 | 86.8 – 128.2 |
| Transplant surgery | 42 | 37.8 | 30.3 – 56.8 |
| Intracranial surgery | 38 | 33.3 | 26.1 – 51.0 |
| Chronic malnutrition | 39 | 35.8 | 28.6 – 54.5 |
| Anaemia | 37 | 33.7 | 23.5 – 47.5 |
| Prolonged use of NGT after surgery | 28 | 25.3 | 17.8 – 39.3 |
[i] PPC = postoperative pulmonary complications, RF = risk factor, COPD = chronic obstructive pulmonary disease, NGT = nasogastric tube, 95% CI = 95% confidence intervals