
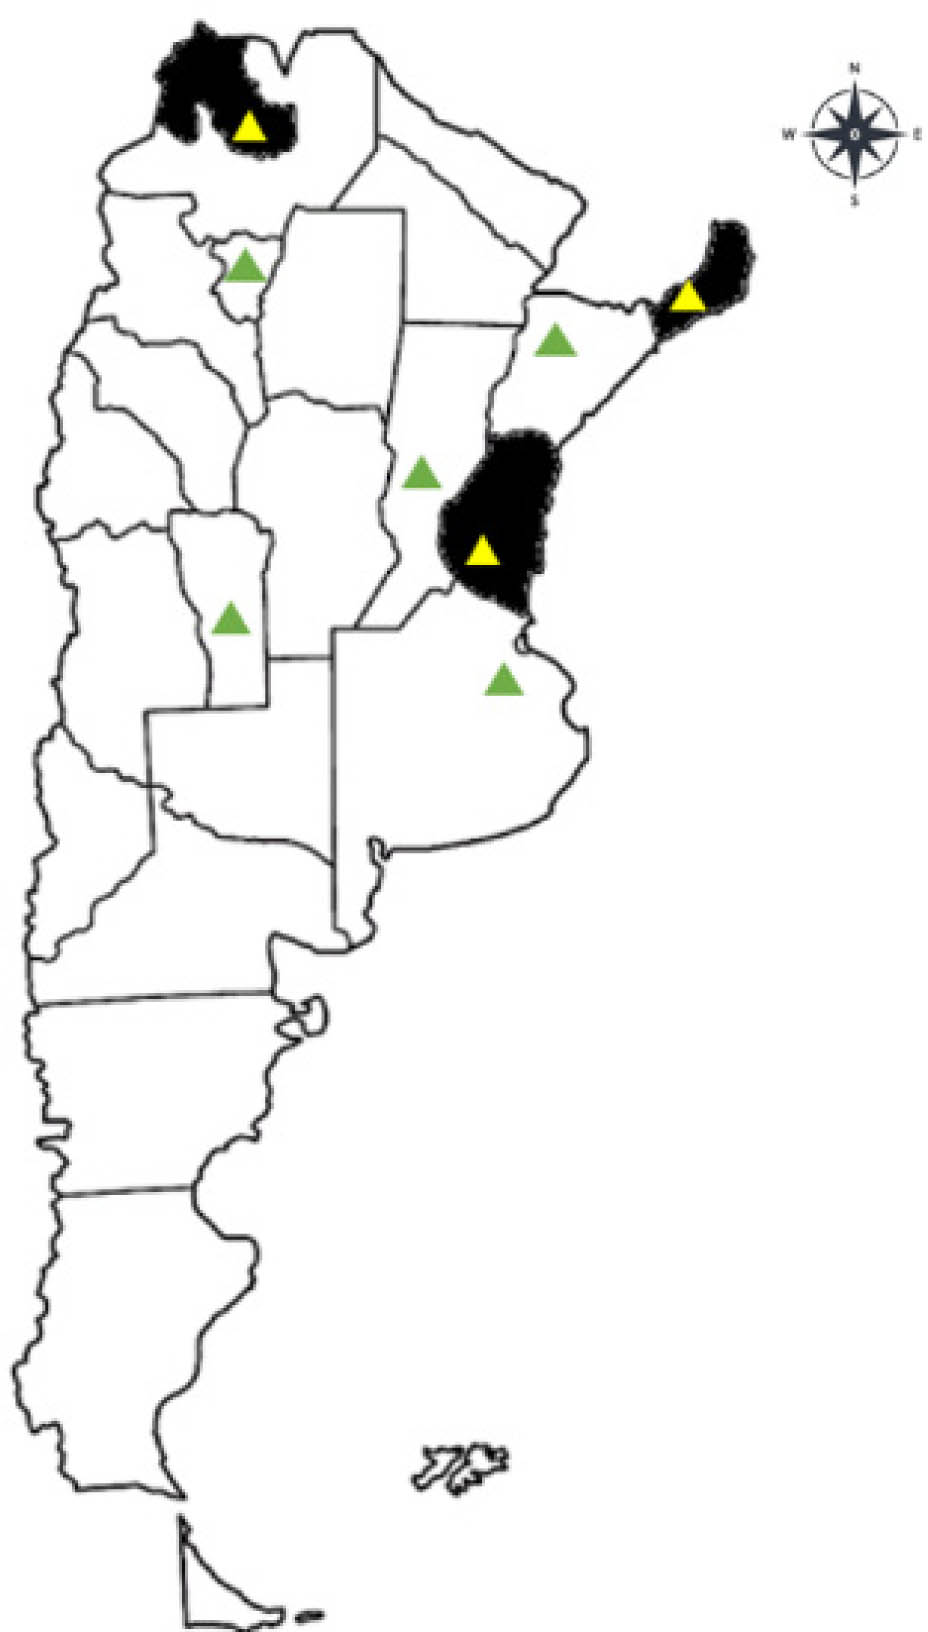
Fig. 1
Distribution of pollen samples collected from apiaries in Argentinian provinces. The yellow triangles denote the isolated samples of A. apis, while the green triangles denote the provinces where the samplings were carried out but the fungus A. apis was not isolated.
Table 1
Macroscopic description of isolated Ascosphaera spp. strains
| Ascosphaera spp. | strains | Origins | Sporocyst diameter (µm) | Ascus diameter average (µm) | Ascospores length average (µm) |
|---|---|---|---|---|---|
| A. apis | PMis | Misiones | 60–75 | 9 | 1–2 |
| A. apis | PJuy | Jujuy | 65–70 | 9 | 1–2 |
| A. apis | PER | Entre Ríos | 60–70 | 8 | 1–2 |
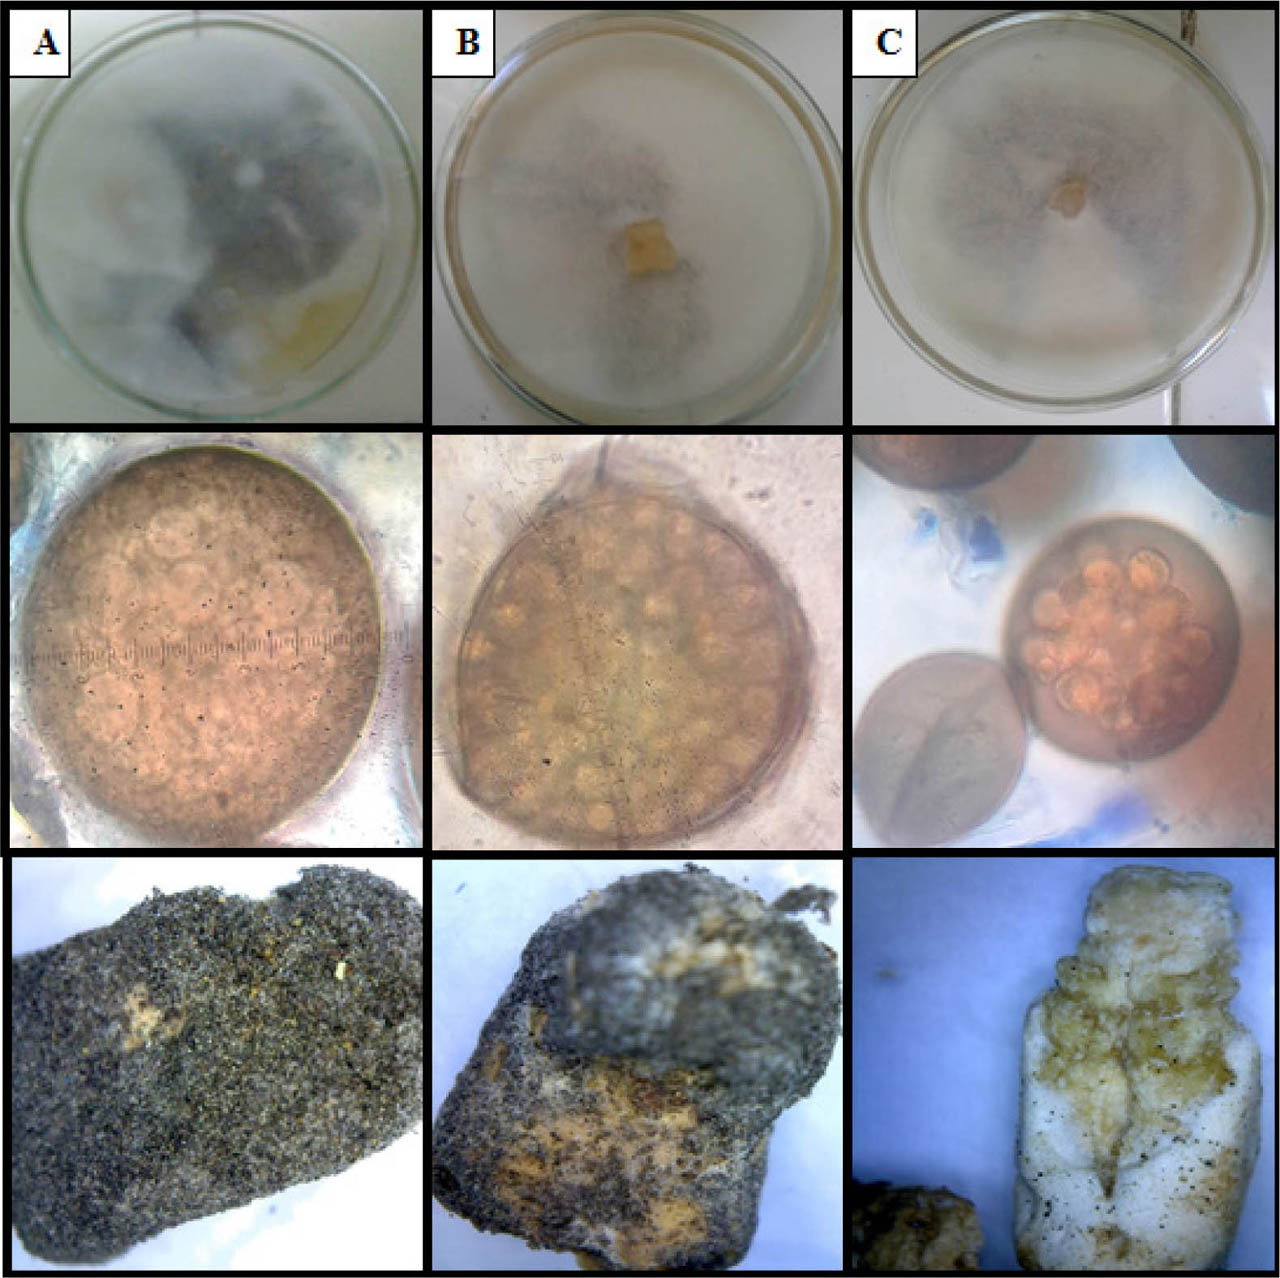
Fig. 2
Macroscopic and microscopic observation in MY20 culture medium.
A) Growth and sporulation of A. apis strain PMIS (Misiones), sporocyst observed at 100X and mummified larvae observed at 10X.
B) Growth and sporulation of A. apis strain PJUY (Jujuy), sporocyst observed at 100X and mummified larvae observed at 10X.
C) Growth and sporulation of A. apis strain PER (Entre Ríos), sporocyst observed at 40X and mummified larvae observed at 10X (without sporocyst).
Table 2
Botanical origin associated with the three strains of Ascosphaera apis isolated from commercial pollen in Argentina
| Pollen types | Porcentage by provincie | ||
|---|---|---|---|
| Entre Ríos | Jujuy | Misiones | |
| Amaranthaceae | 8.87 | 6.42 | 12.05 |
| Apiaceae | 0.55 | 0.28 | 0 |
| Caesalpiniaceae | 0.92 | 0 | 0 |
| Carduus | 1.11 | 0 | 0.17 |
| Fabaceae | 0 | 1.4 | 0 |
| Helianthus annuus | 14.23 | 0 | 18.59 |
| Juglans | 0 | 0.56 | 0 |
| Monocotyledoneae | 0.74 | 0 | 1.55 |
| Myrtaceae | 0 | 97.6 | 0 |
| Peltophorum dubium | 0 | 1.96 | 0 |
| Poaceae | 0 | 0 | 0.34 |
| Zea mays | 2.22 | 1.4 | 1.38 |
| Tithonia | 0 | 5.31 | 0 |
| Rapistrum | 68.58 | 73.18 | 61.96 |
| Salix | 0 | 0 | 0.34 |
| Sapium haematospermum | 1.66 | 3.07 | 1.72 |
| Senecio | 0 | 3.91 | 0 |
| Solanaceae | 0.55 | 1.12 | 0.69 |
| Taraxacum officinale | 0.55 | 1.4 | 0.52 |
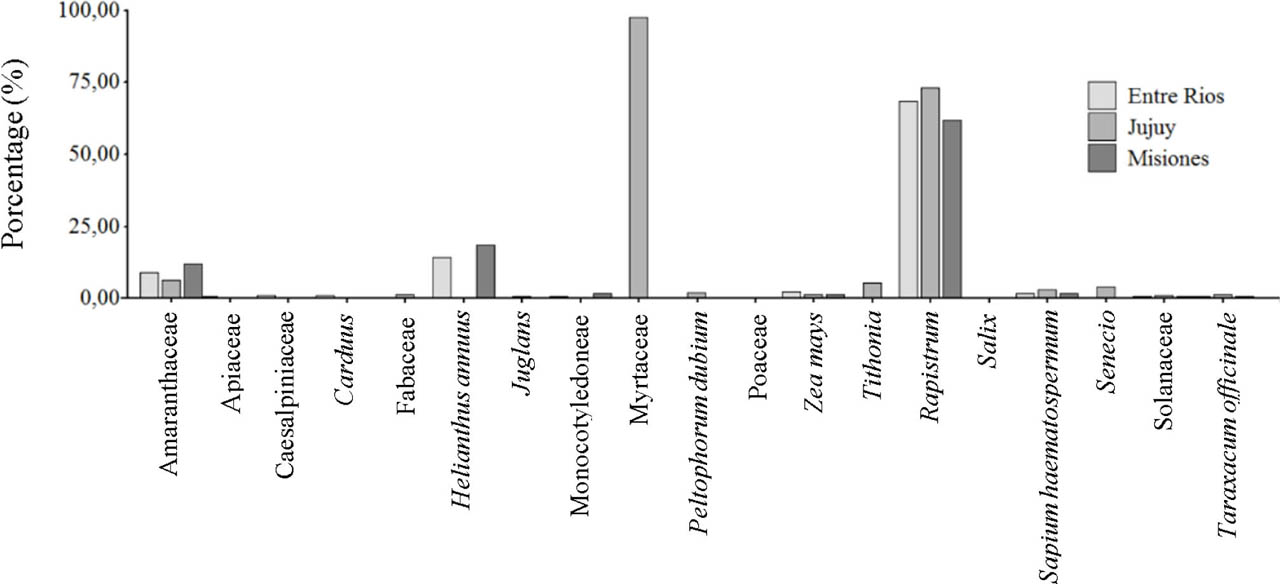
Fig. 3
Percentage of pollen containing A. apis.
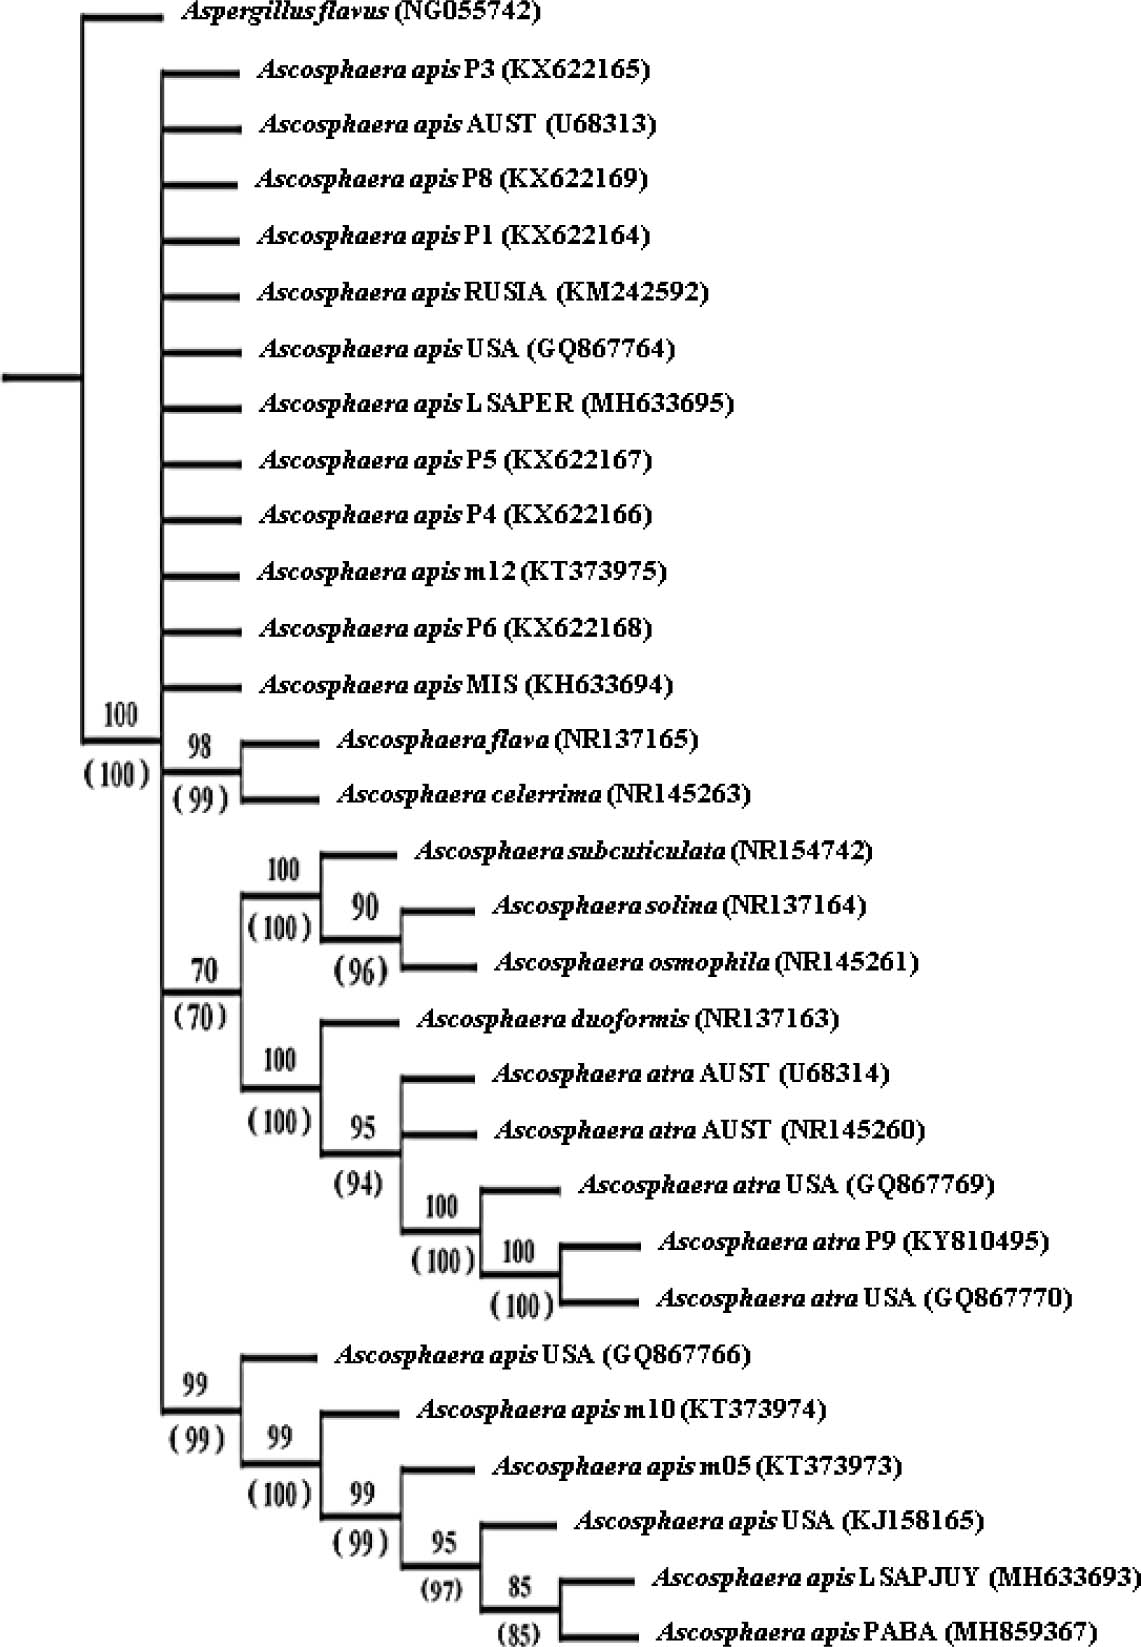
Fig. 4
Phylogenetic relationship of A. apis strains. The tree was carried out using 1000 replications and bootstrap and jackknife parsimony. The numbers in parentheses correspond to the jackknife support.
Table 3
Number of larvae mummies with A. apis and no mummies. Values are mean ± standard deviation
| Strains | Number of mummies | Number of non-mummified larvae (Witness) | Number of infected larvae (5×10³ spores/mL) | Number of infected larvae (5×10⁶ spores/mL) | Total number of capped cells | ||
|---|---|---|---|---|---|---|---|
| (5×10³ spores/mL) | (5×10⁶ spores/mL) | Without sporocyst | |||||
| Misiones | 0 | 30±7 | 3±3 | 100±40 | 138±1 | 127±29 | 43±6 |
| Entre Ríos | 0 | 10±1 | 2±2 | 112±2 | 128±12 | 83±9 | 28±11 |
| Jujuy | 1±1 | 23±3 | 5±1 | 102±32 | 134±10 | 85±43 | 54±8 |
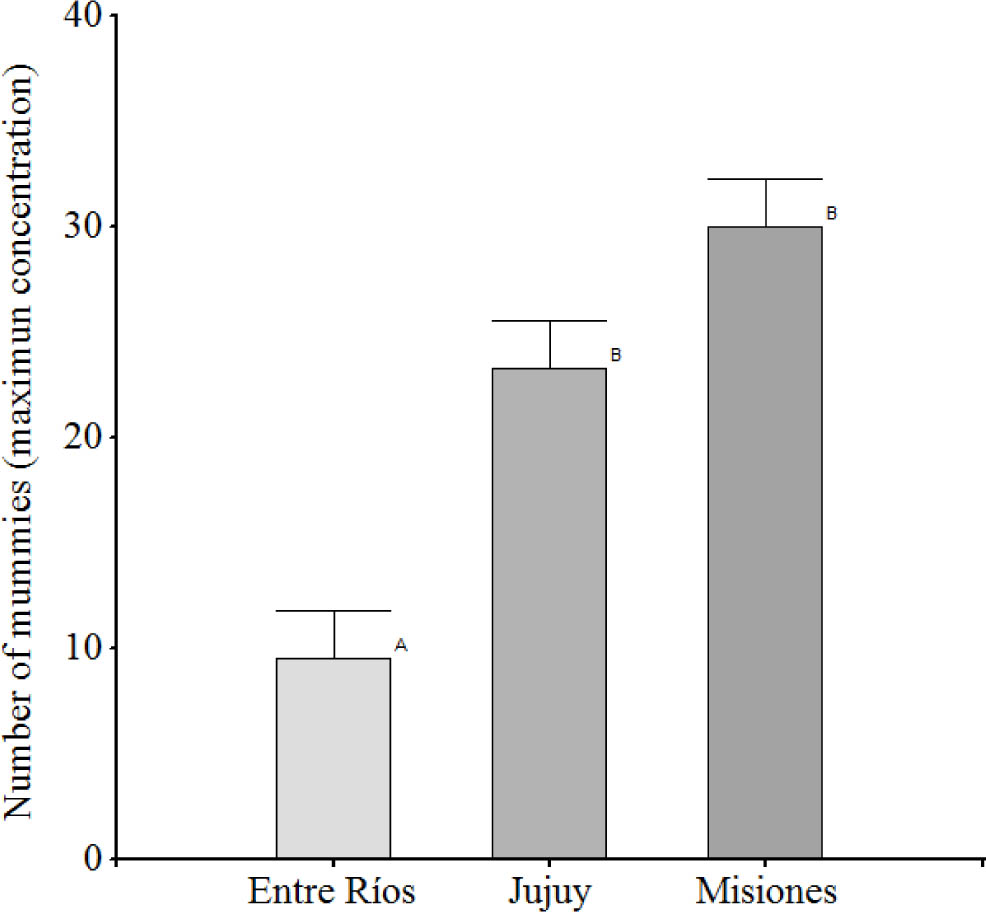
Fig. 5
Record of larvae mummied with A. apis. Values are mean ± standard deviation. Different letters represent differences between strains (p<0.05).