
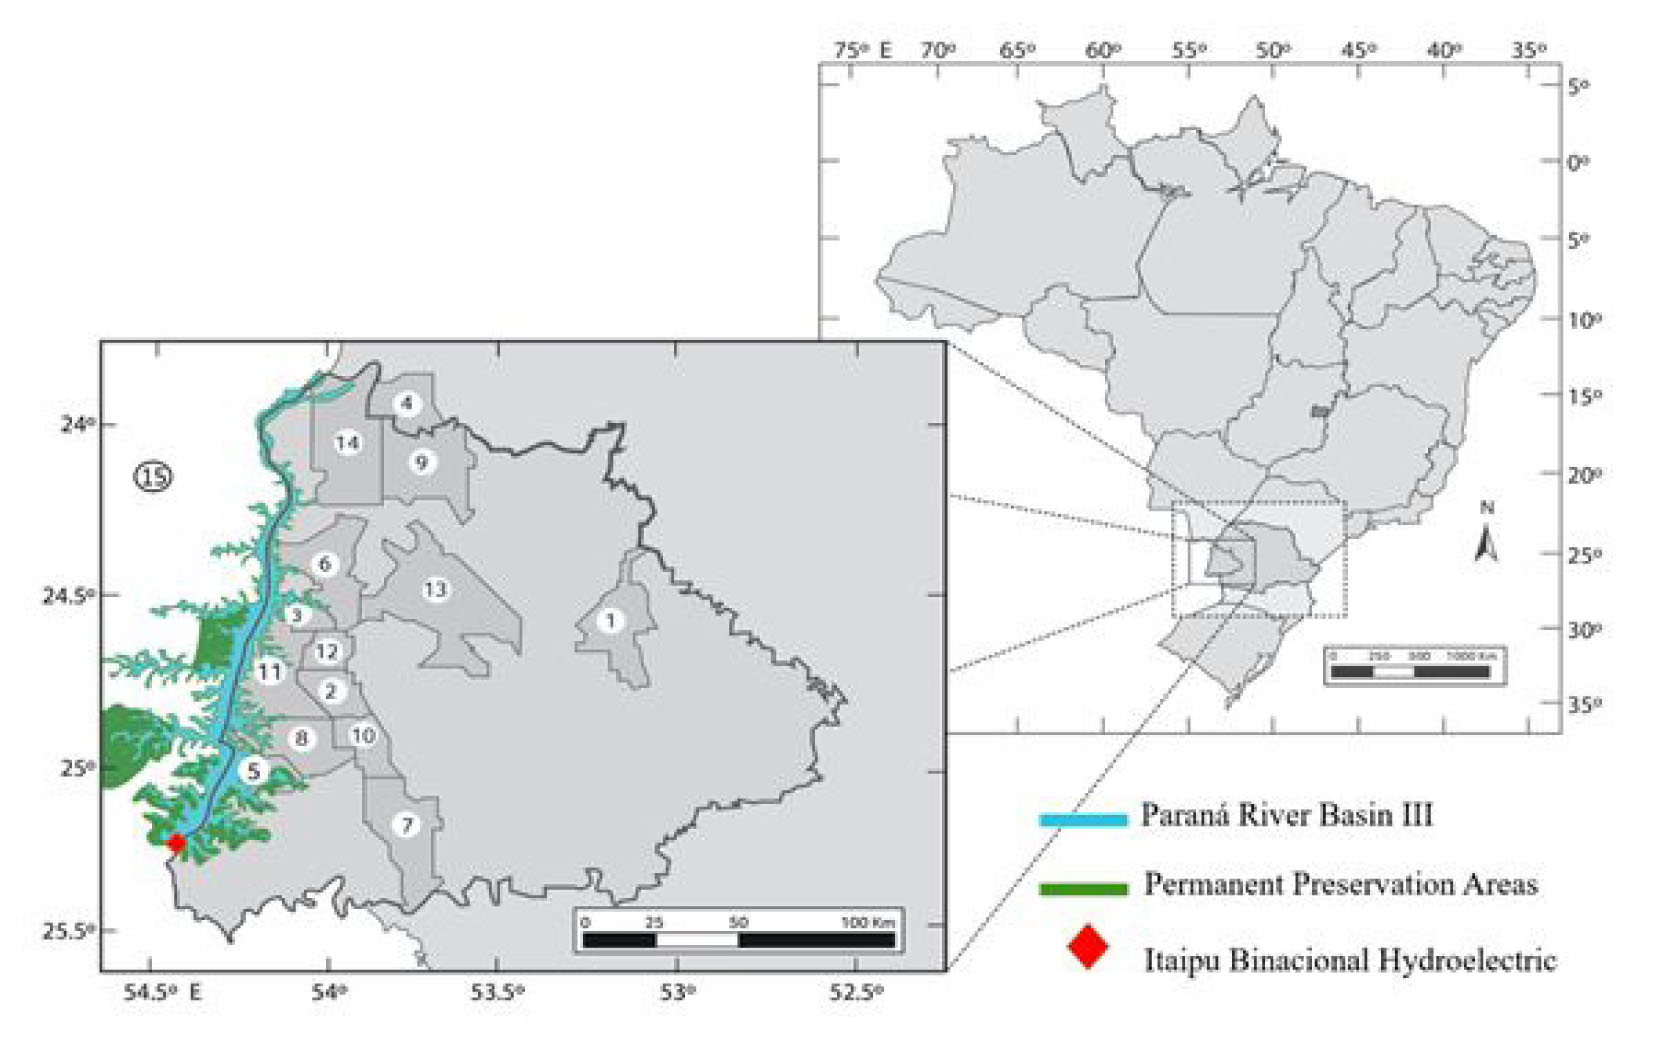
Fig. 1
Location map of the study area: (right) map showing the position of the State of Paraná in Brazil, (left) map showing the position of western region of Paraná, with emphasis on sampling municipalities. 1 - Corbélia, 2 - Diamante do Oeste, 3 - Entre Rios do Oeste, 4 - Francisco Alves, 5 - Itaipulândia, 6 -Marechal Cândido Rondon, 7 - Matelândia, 8 - Missal, 9 - Palotina, 10 - Ramilândia, 11 - Santa Helena, 12 - São José das Palmeiras, 13 – Toledo, 14 - Terra Roxa, as well as the Paraná River Basin III, which borders Paraguay (15).
Table 1
Microbial analyses of the 67 samples of honey from the west State of Paraná, Southern Brazil
| Parameters | % | Low | High | Median | Q1a | Q3b | Mean ±SDc |
|---|---|---|---|---|---|---|---|
| Aerobic mesophiles d | 70 | 0 | 4.48 | 2.70 | 0 | 4.40 | 2.52 (±1.85) |
| Clostridium spp. d | 77 | 0 | 3.40 | 1.30 | 1.00 | 2.60 | 1.46 (±1.05) |
| Total coliforms d | 60 | 0 | 2.32 | 0.96 | 0 | 1.30 | 0.78 (±0.66) |
| Fecal coliformsd | 62 | 0 | 1.81 | 0.48 | 0 | 0.85 | 0.50 (±0.47) |
| Total yeasts d | 34 | 0 | 2.15 | 0 | 0 | 1.00 | 0.46 (±0.68) |
| Total molds d | 83 | 0 | 9.00 | 2.85 | 1.00 | 4.62 | 2.95 (±2.44) |
Table 2
The mean values of microbial analyses of the 67 samples of honey from the beekeepers in 14 municipalities in the west State of Paraná, Southern Brazil
| Location | Aerobic mesophiles | Costridium spp. | Total coliforms | Fecal coliforms | Total yeasts | Total molds |
|---|---|---|---|---|---|---|
| Santa Helena (n=27) | 2.6 | 1.5 | 0.5 | 3.1 | 1.0 | 0.6 |
| Missal (n=7) | 1.6 | 1.5 | 0.3 | 4.5 | 1.0 | 0.5 |
| Terra Roxa (7) | 3.4 | 1.3 | 0.5 | 1.7 | 1.0 | 0.1 |
| Marechal Cândido Rondon (n=7) | 3.2 | 1.7 | 0.3 | 0.7 | 0.3 | 0.4 |
| Diamante do Oeste (n=4) | 0.5 | 2.2 | 1.2 | 3.5 | 0.4 | 0.7 |
| Entre Rios do Oeste (n=3) | 4.4 | 1.1 | 0.7 | 5.7 | 0.9 | 0.7 |
| Matelândia (n=3) | 2.3 | 1.5 | 0.3 | 2.5 | 0.4 | 1.1 |
| Corbélia (n=2) | 1.2 | 1.2 | 1.1 | 1.0 | 0.0 | 0.4 |
| Toledo (n=2) | 1.4 | 1.2 | 0.0 | 5.6 | 0.6 | 0.4 |
| Francisco Alves (n=1) | 4.4 | 1.0 | 0.0 | 1.0 | 0.0 | 0.0 |
| Itaipulândia (n=1) | 4.4 | 0.0 | 0.0 | 2.0 | 1.4 | 0.0 |
| Palotina (n=1) | 0.0 | 1.0 | 0.0 | 8.9 | 1.2 | 0.0 |
| Ramilândia (n=1) | 4.4 | 1.3 | 0.0 | 4.8 | 1.2 | 0.0 |
| São José das palmeiras (n=1) | 0.0 | 1.7 | 1.7 | 1.0 | 0.0 | 0.8 |
[i] Colony forming unit per gram of honey (log CFU/g).
Table 3
Genera of molds identified in honey samples from the west of the State of Paraná, Southern Brazil
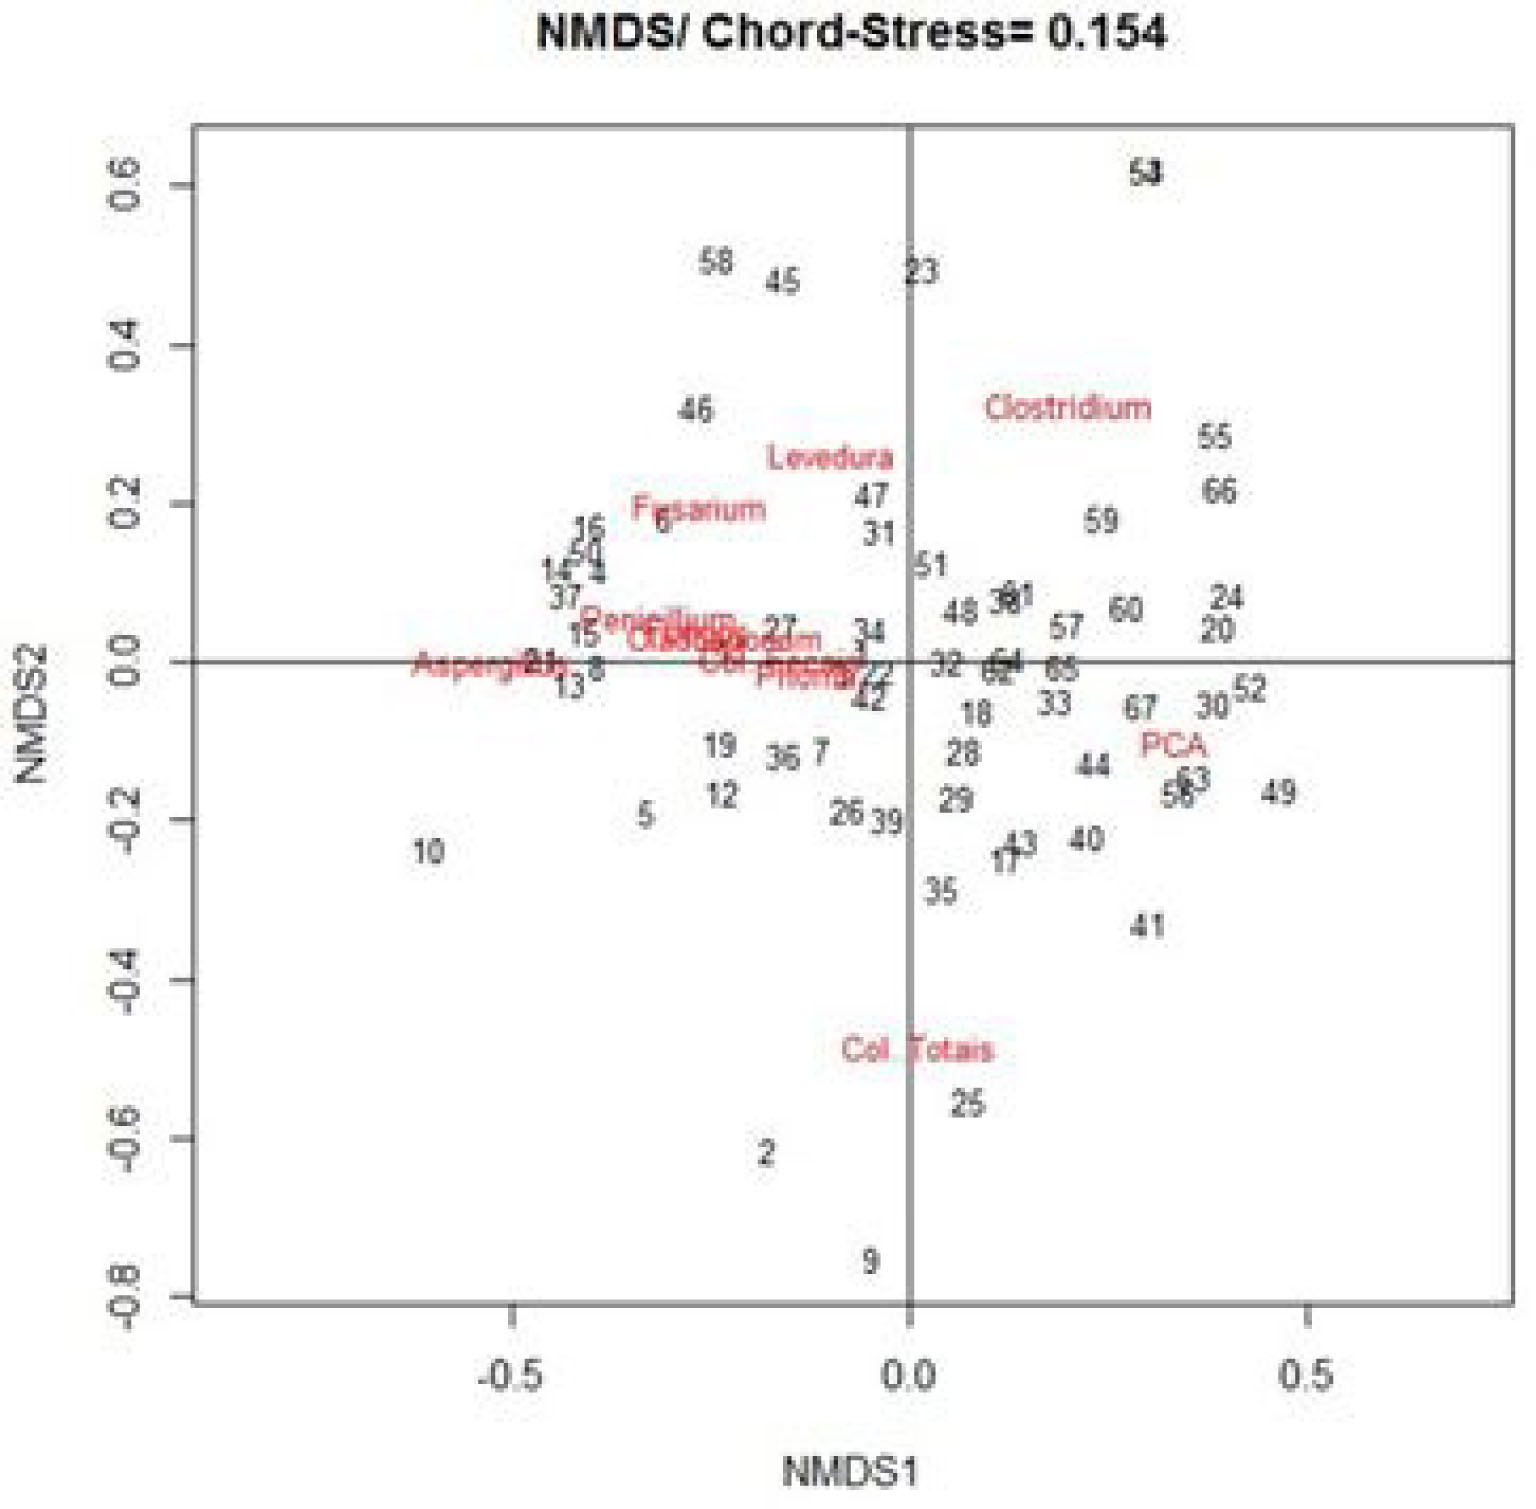
Fig. 2
Shows Non-metric Multidimensional Scaling (NMDS) for the similarity of the microorganisms of 67 honey samples. Each number refers to a sample and the acronyms are the different microbial communities which generates a chord distance matrix with a stress value of 0.154.
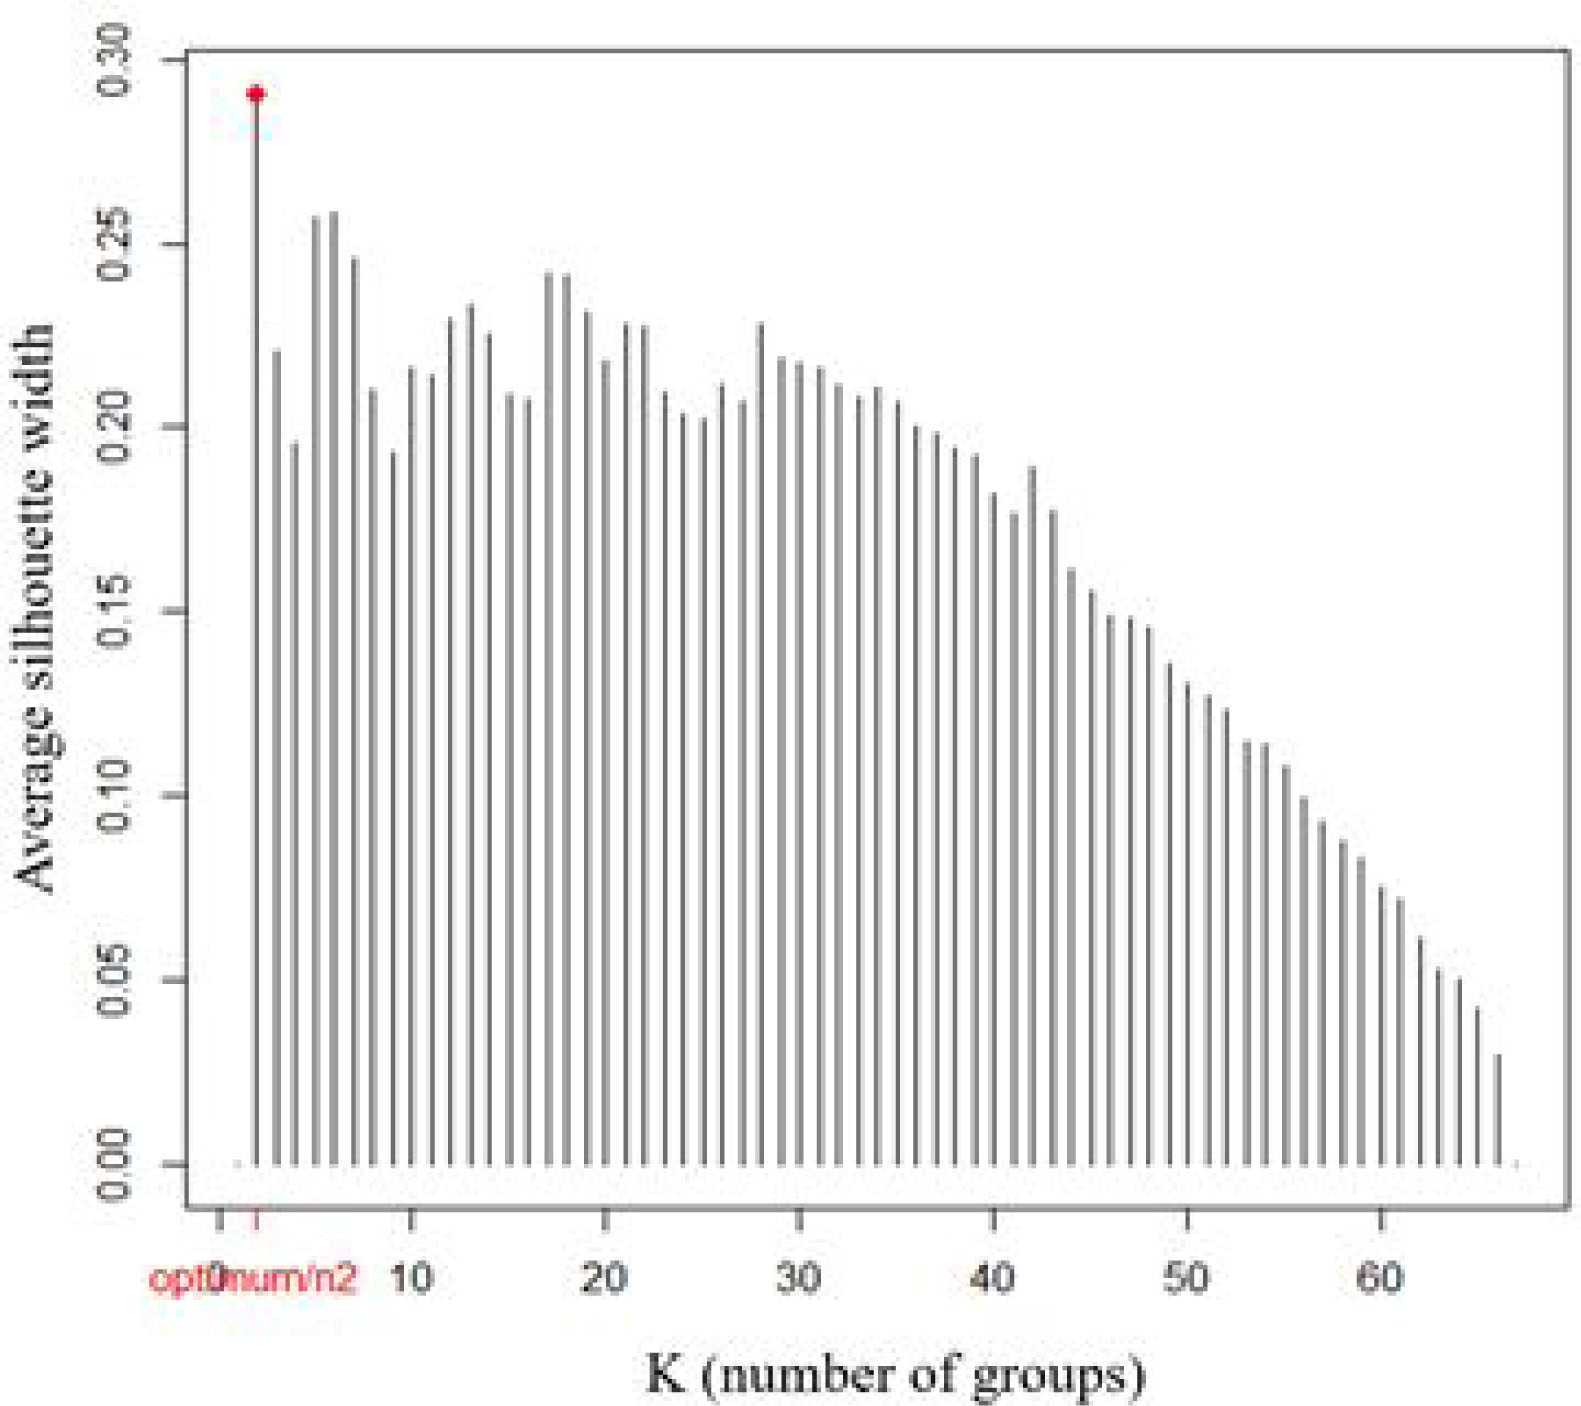
Fig. 3
The bar chart shows the average width of the silhouette for k = 2 groups for 67 samples.
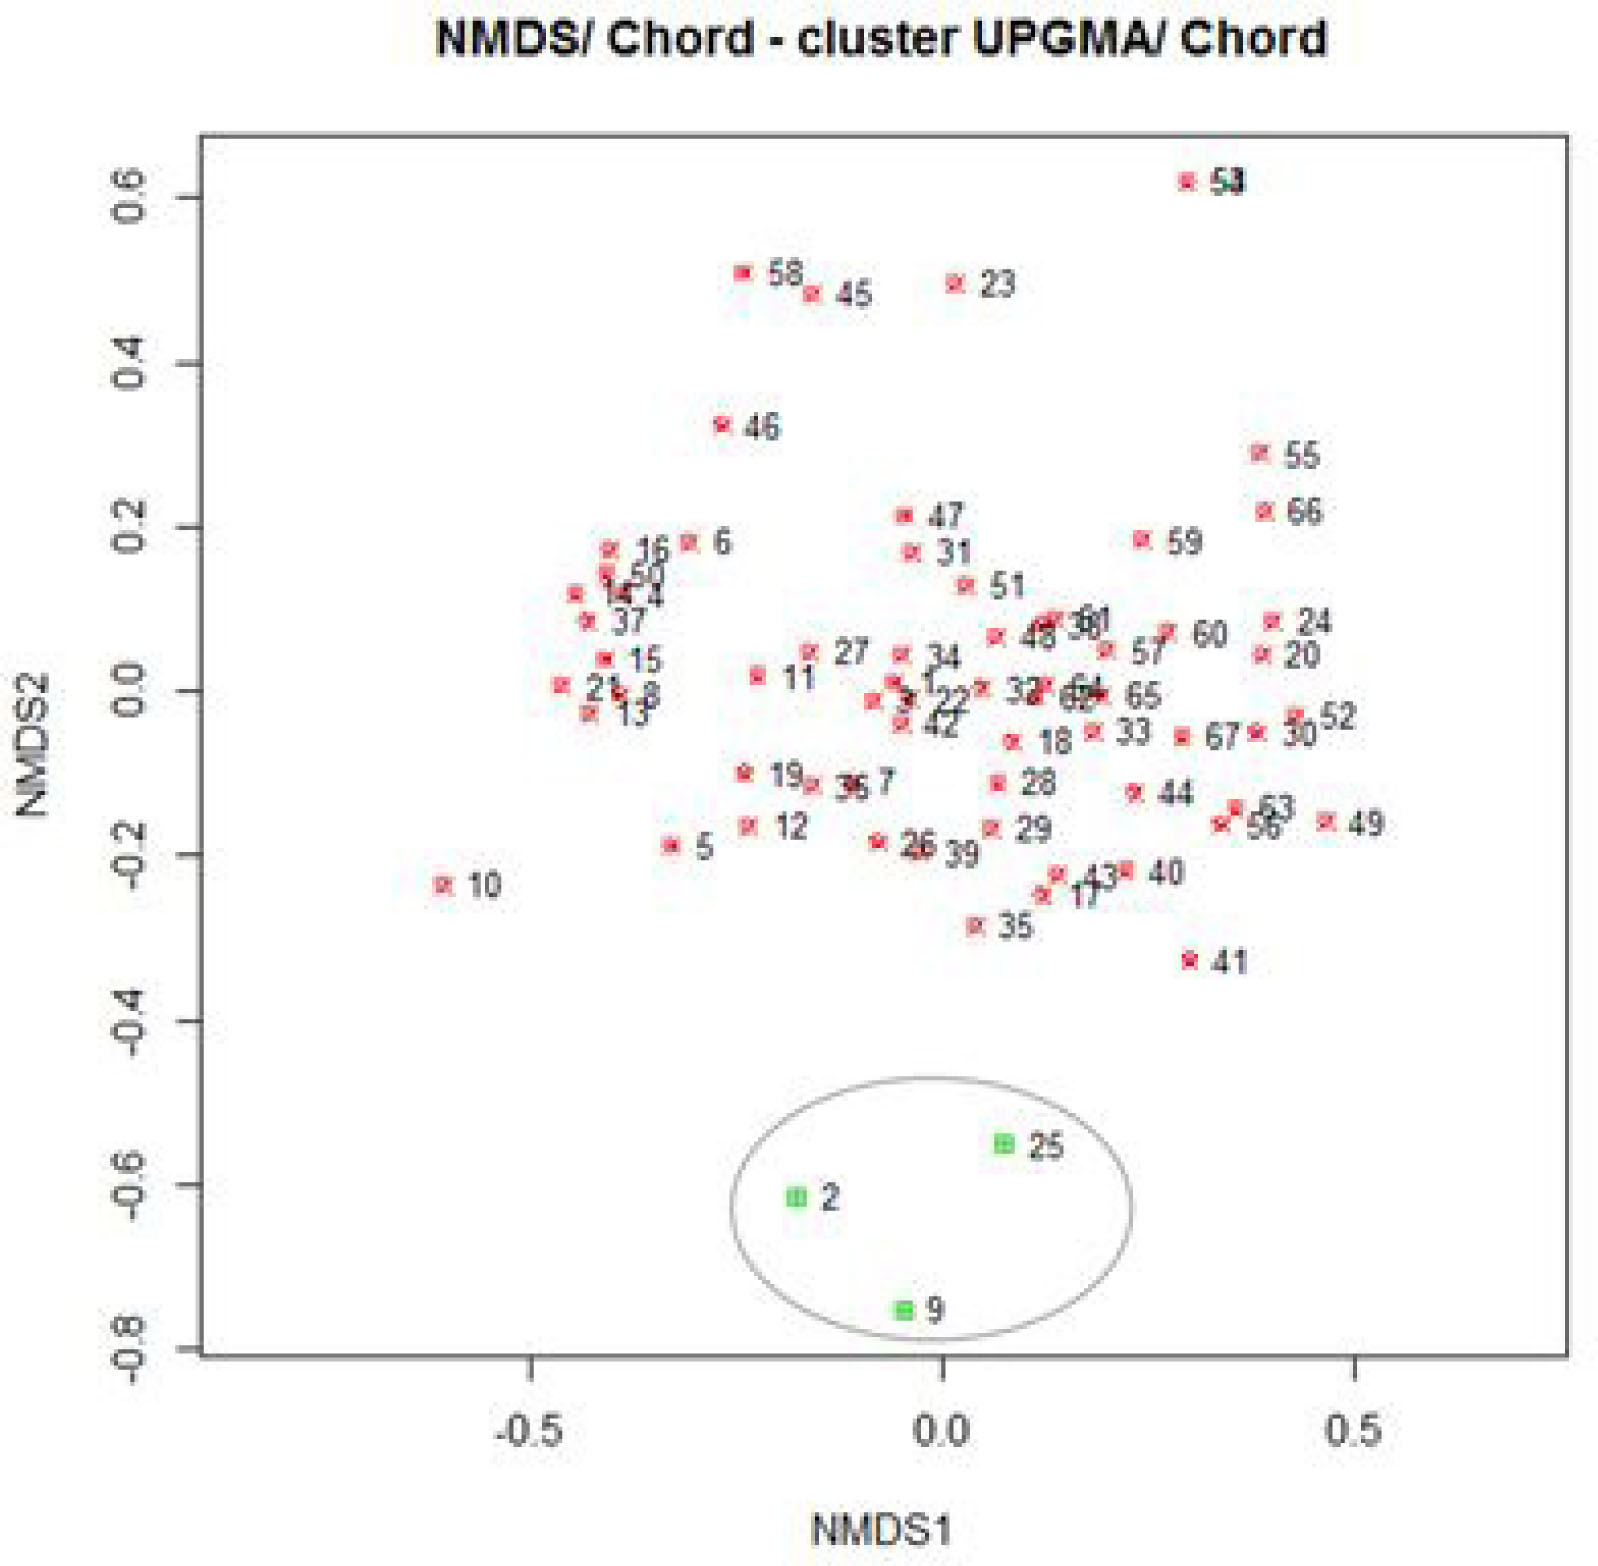
Fig. 4
UPGMA clustering of a string distance matrix between two groups on an NMDS ordering chart for microbiological data of 67 honey samples (CC = 0.76).