

Fig. 1
Cytb nucleotide sequence of Caucasian and Italian drones (7–10 Caucasian drones, 12–14 Italian drones).
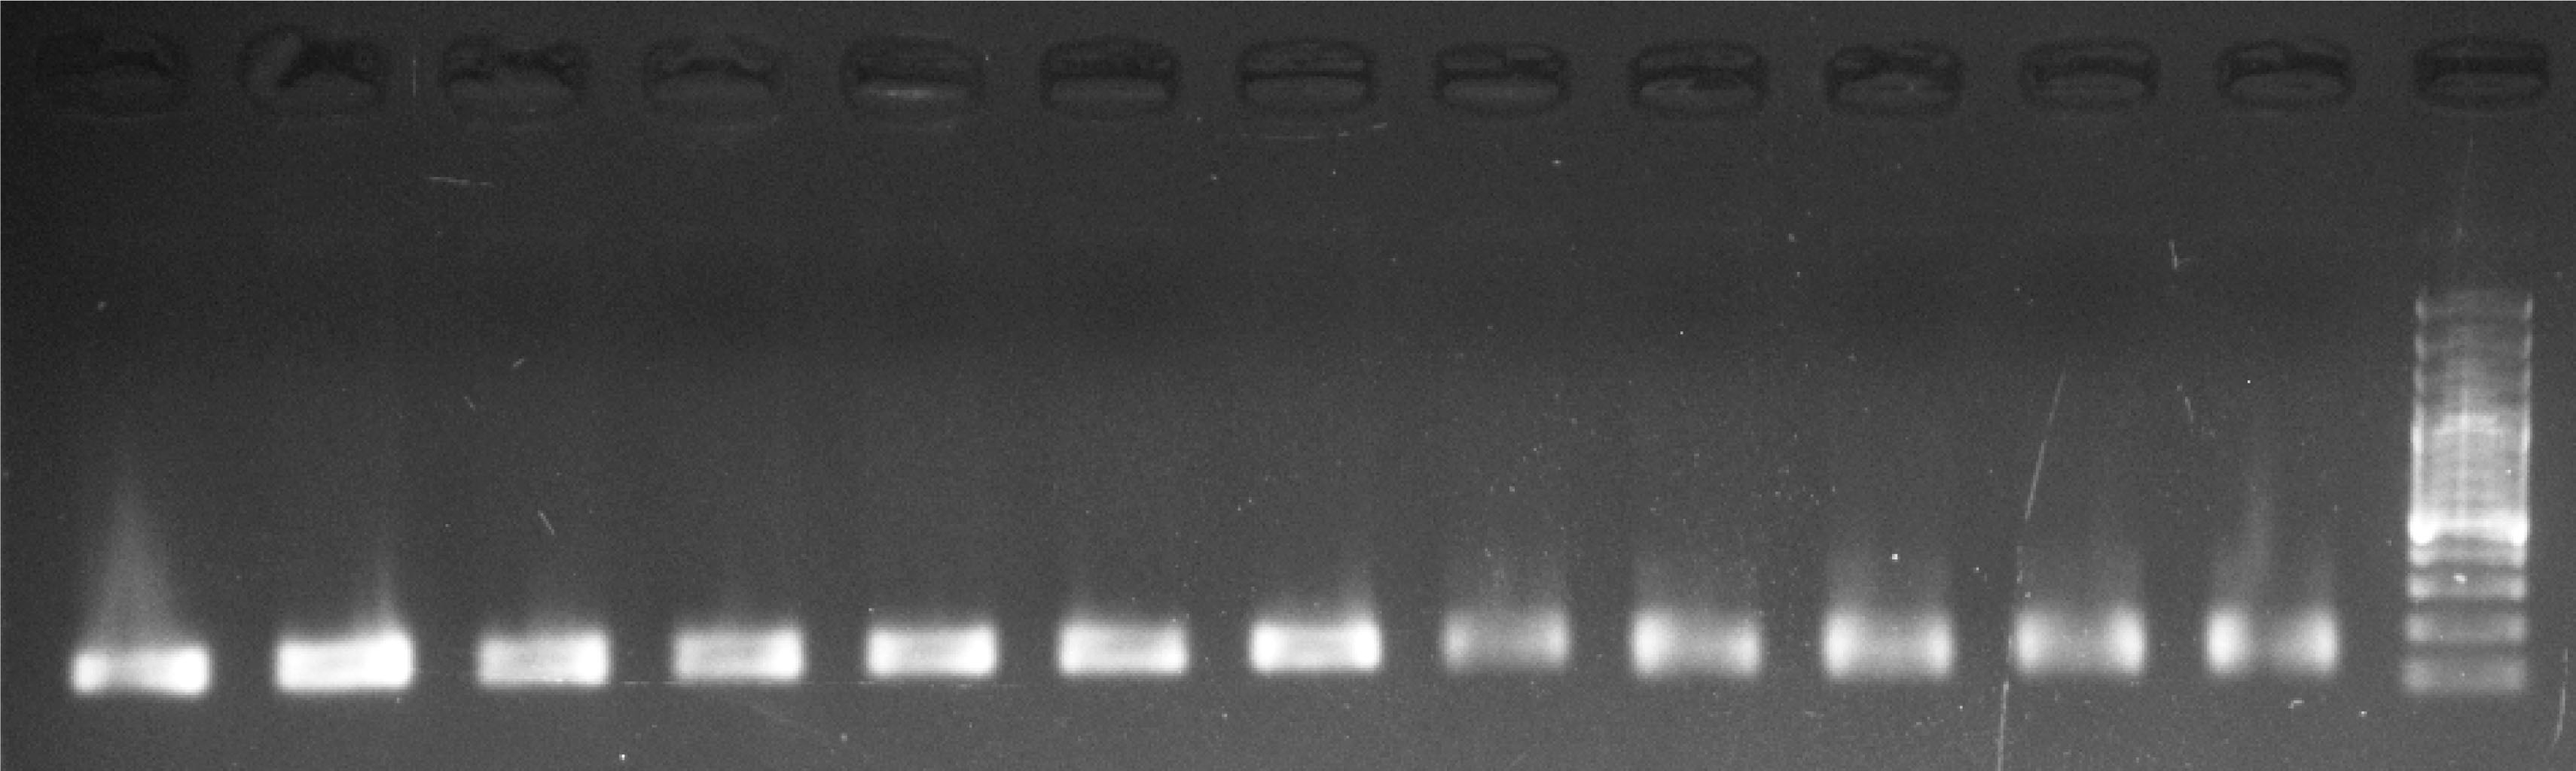
Fig. 2
Agarose gel image of mtDNA Cytb (143 bp) region (L: 100–3000 bp).
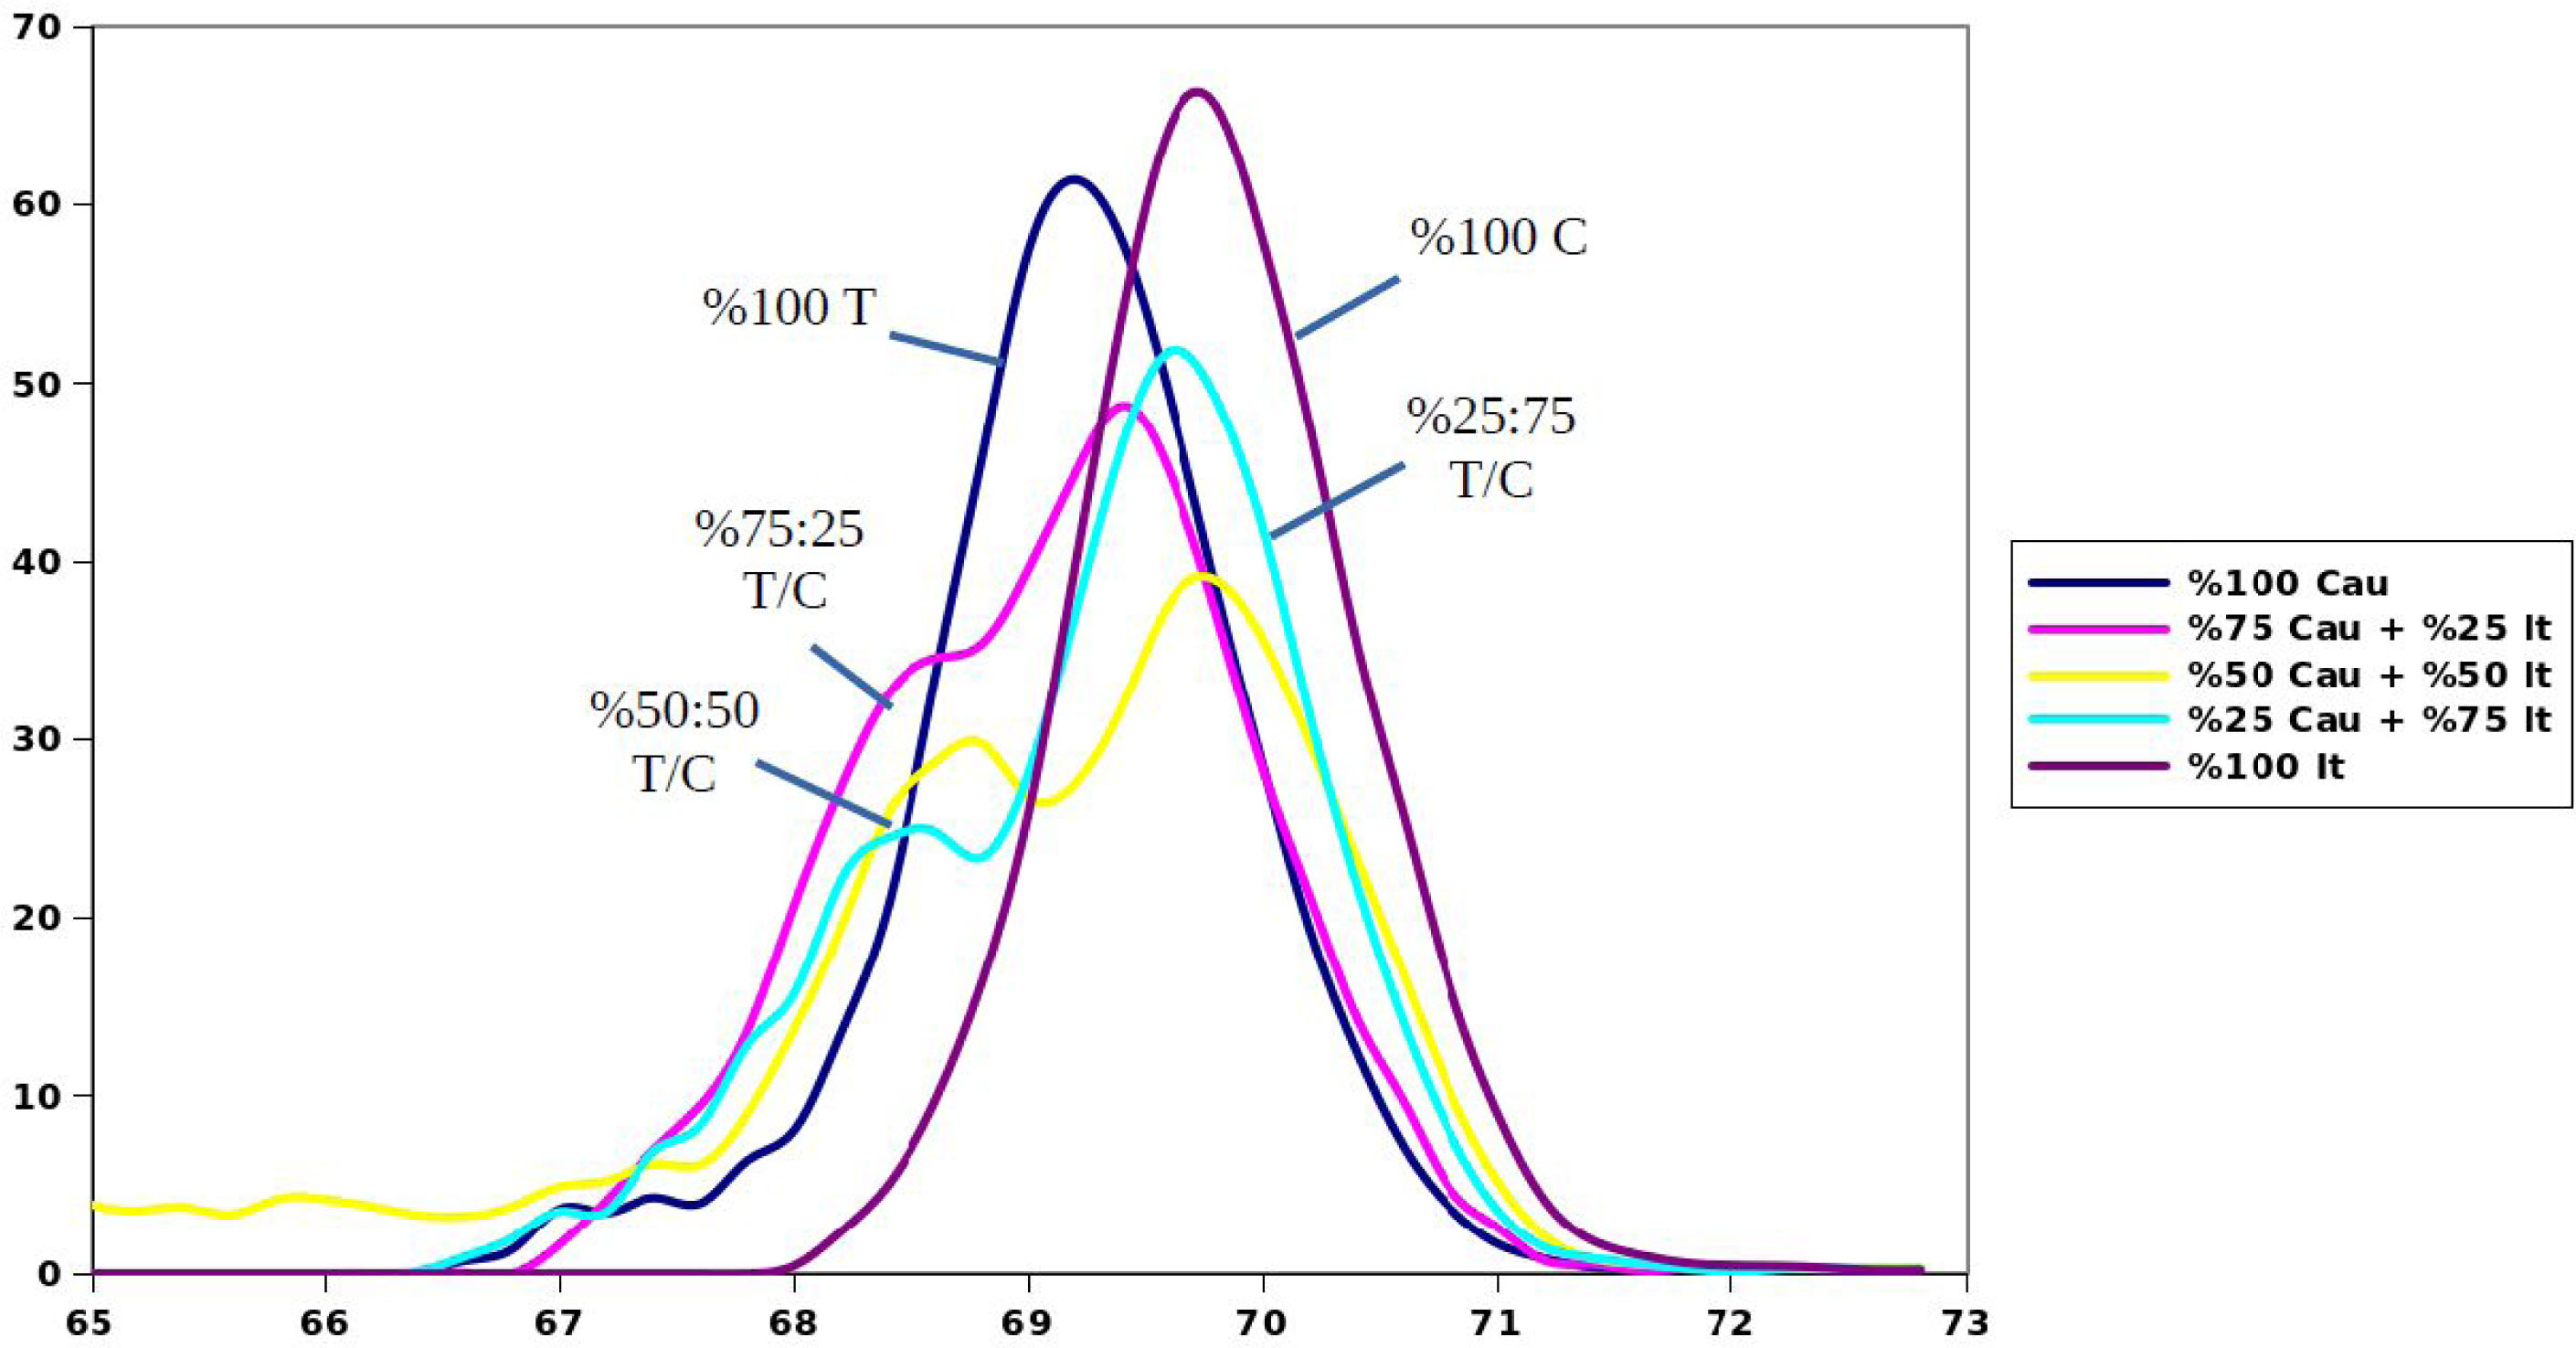
Fig. 3
Melting curves of pure and mixed Caucasian and Italian DNA samples (Cau; T, Caucasian, It; C, Italian).
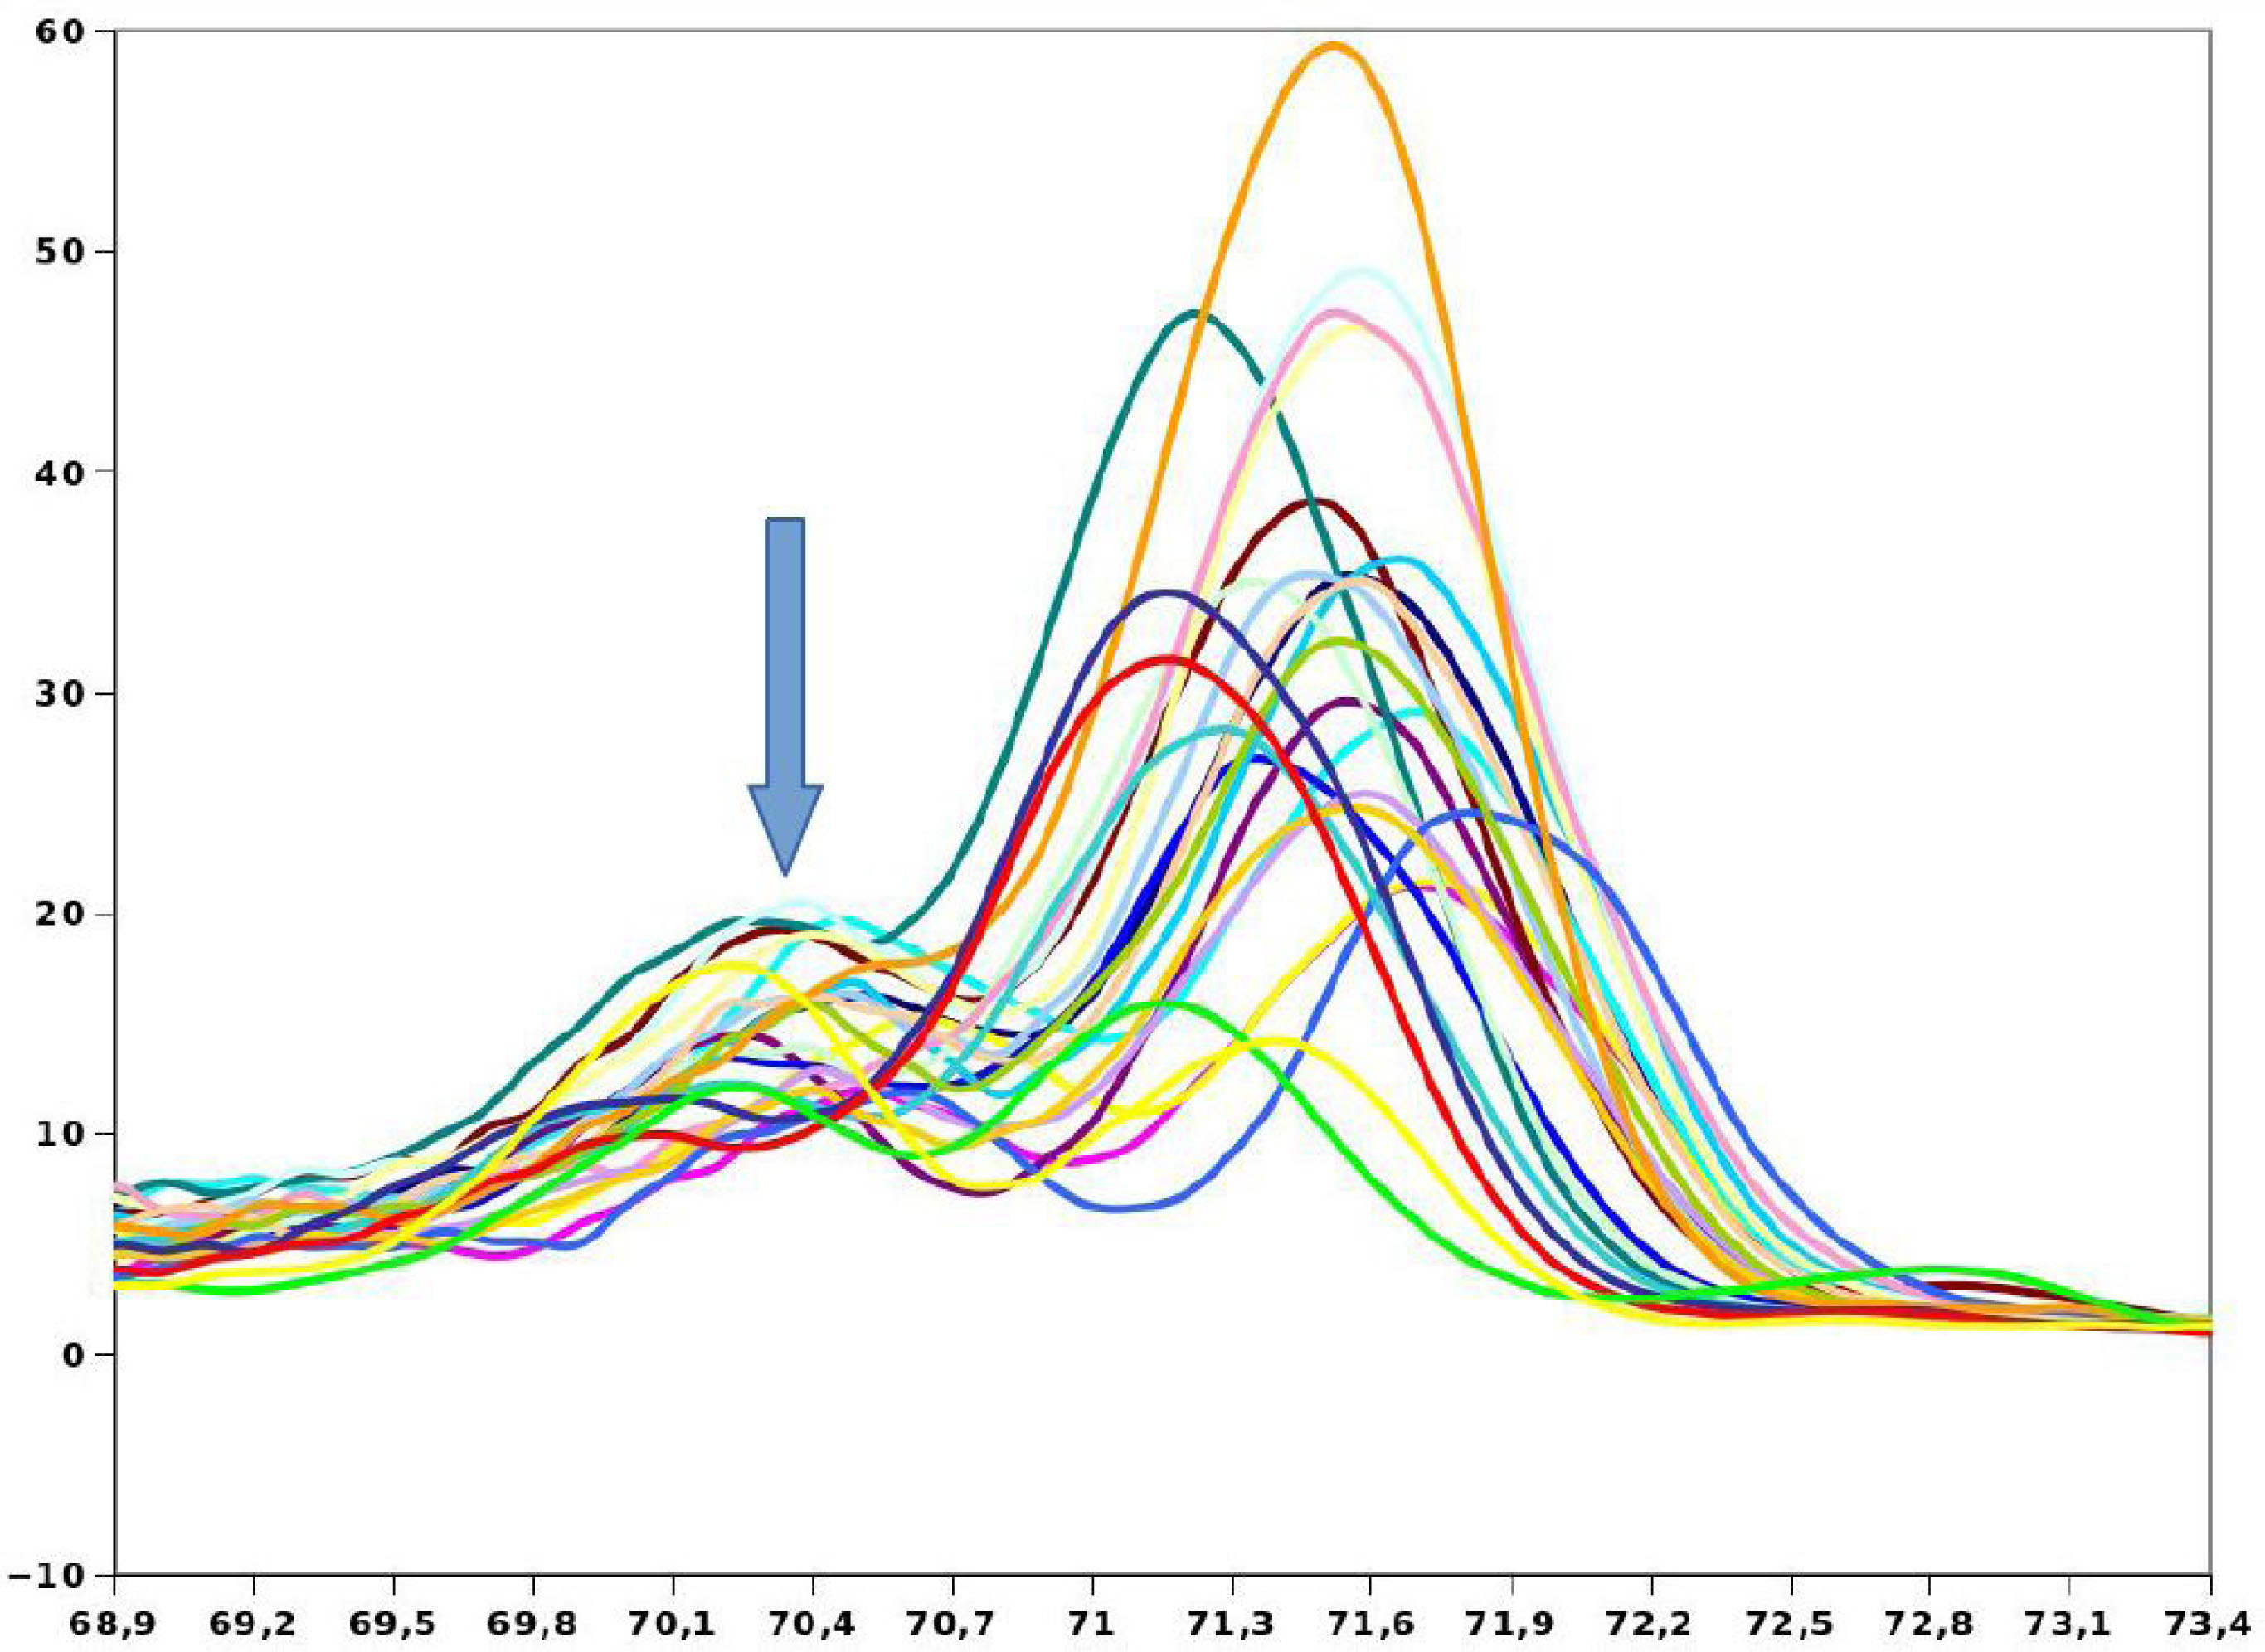
Fig. 4
HRM derivative curves of spermathecal contents (blue arrow shows early peaks due to heterozygosity).