
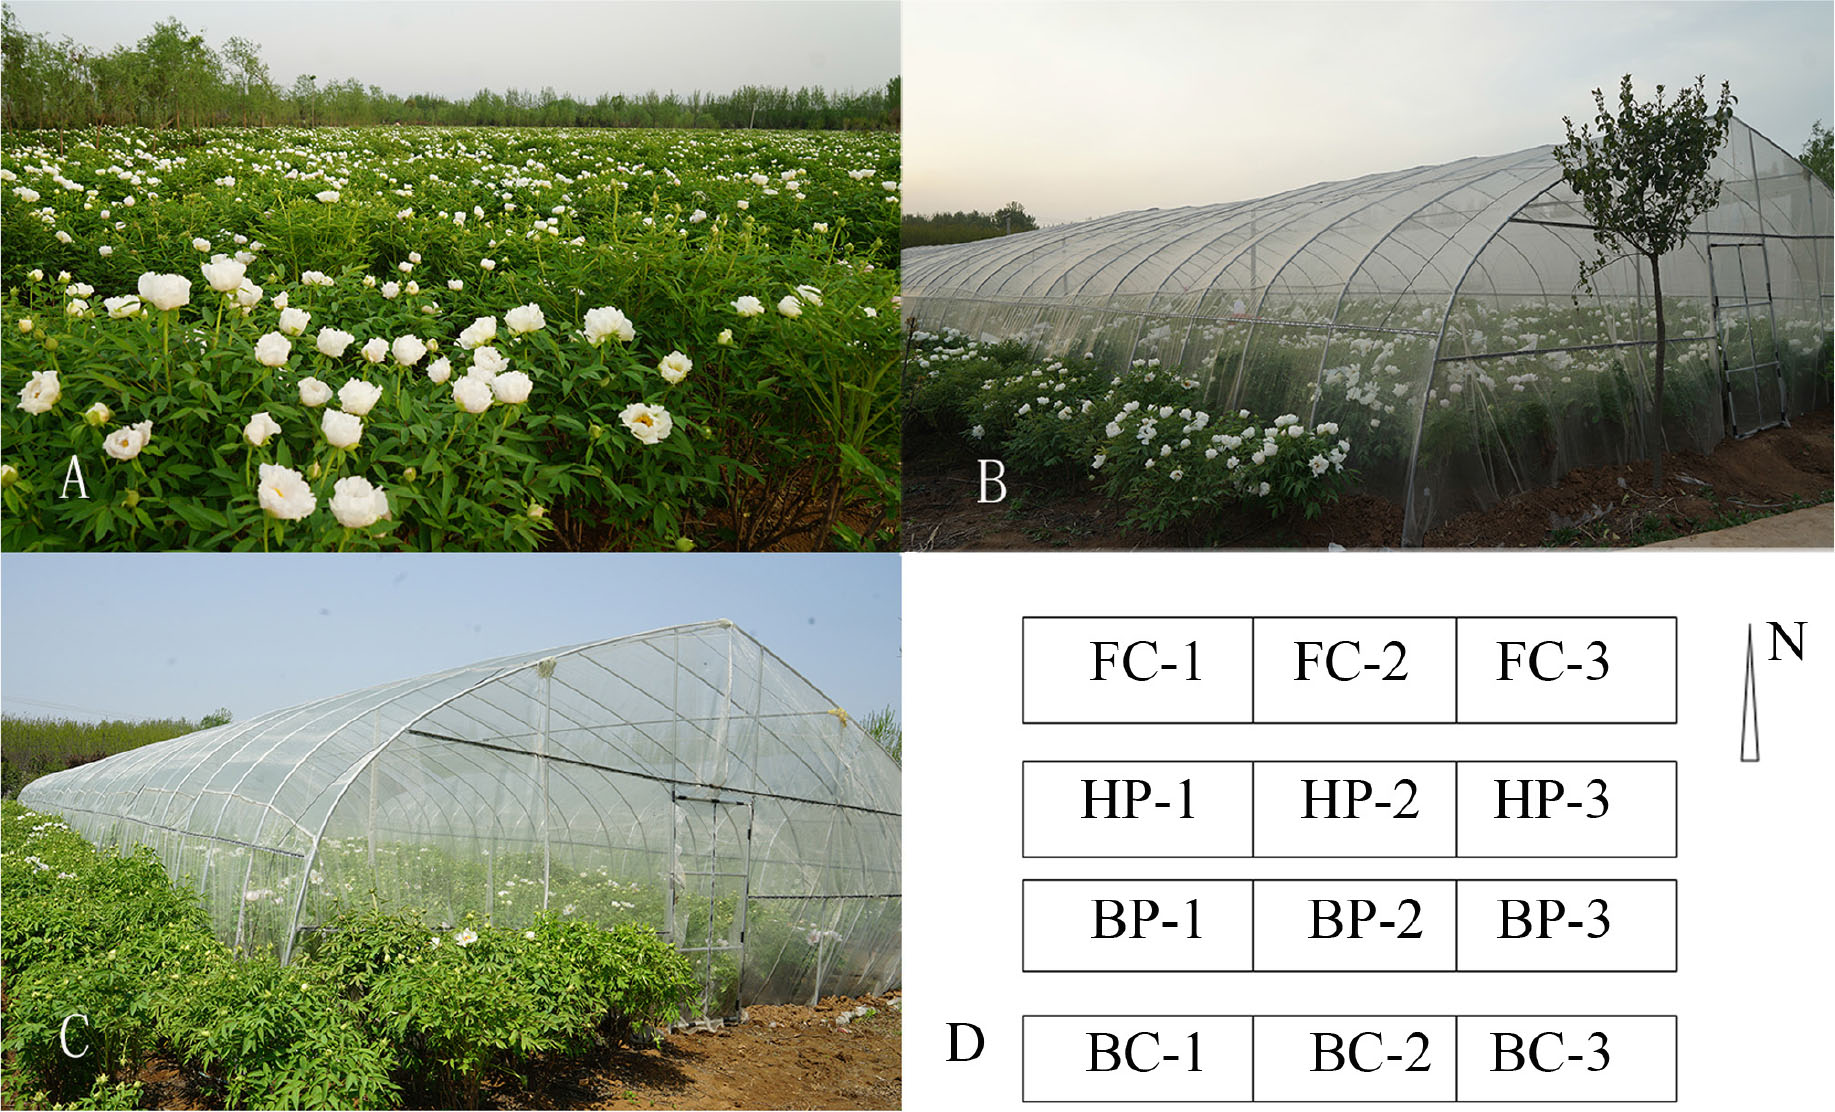
Fig. 1
Pollination net rooms built at the oil tree peony base. A. oil tree peony base; B. the net house for the bee pollination treatment (45 m×8 m), which is equally divided into three net rooms; C. the net house without pollinating insects; D. plane graph of the pollination experiment. FC, natural field control; HP, honeybee pollination; BP, ground bumblebee pollination; BC, blank control (without pollinating insects).
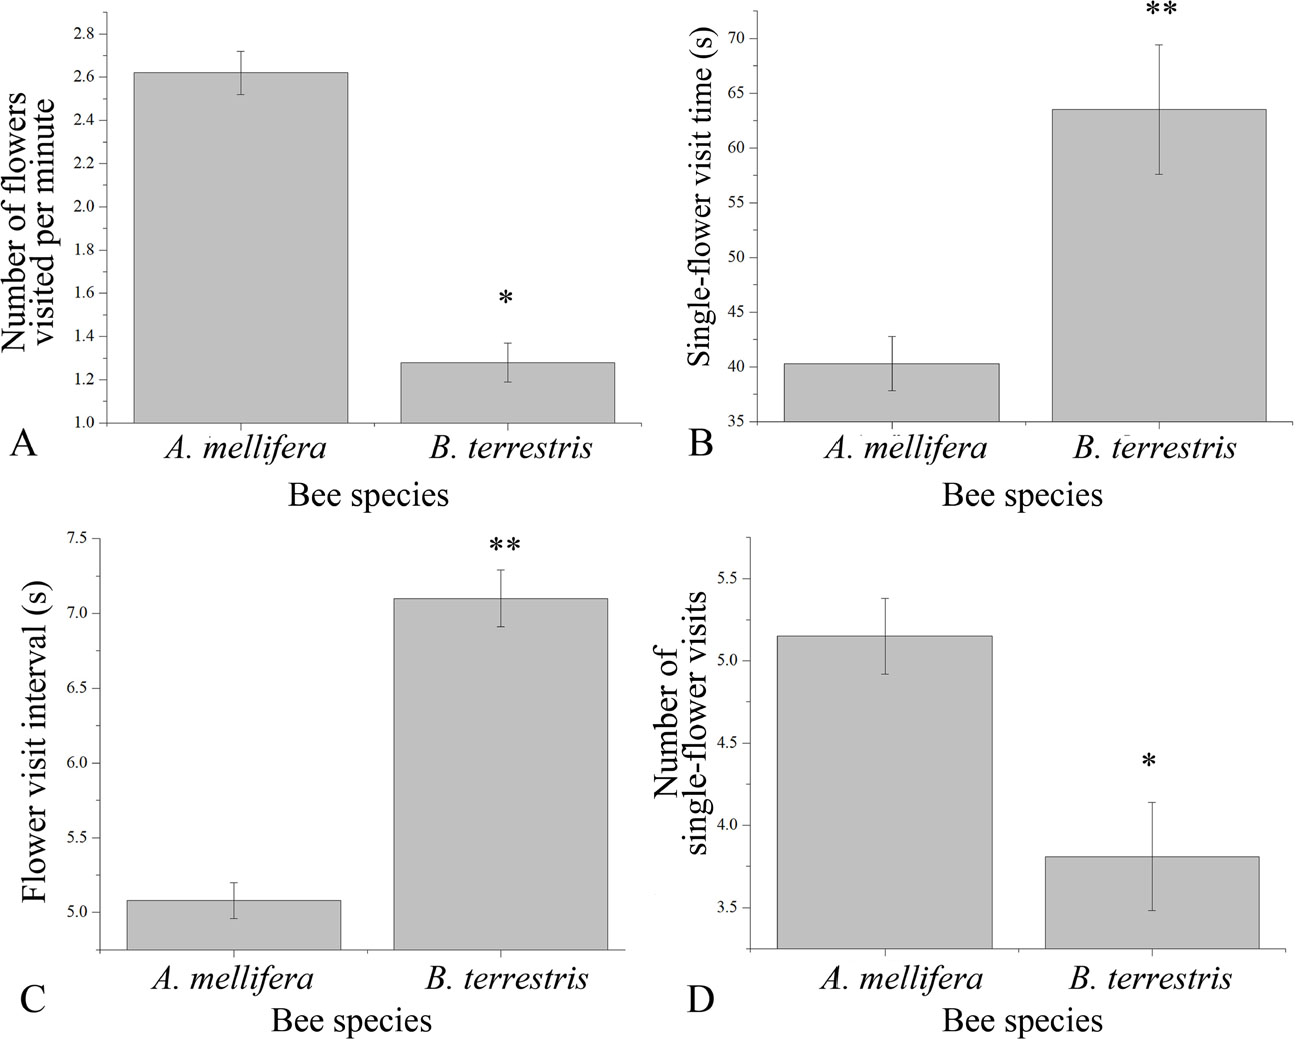
Fig. 2
The foraging behavior parameters of honeybees and ground bumblebees on oil tree peony flowers.
A. number of flowers visited per minute. B. single-flower visit time. C. flower visit interval. D. number of single-flower visits.
Note: The data in the figure are the means ± standard errors. *P<0.05 and **P<0.001 according to an independent-samples t test.
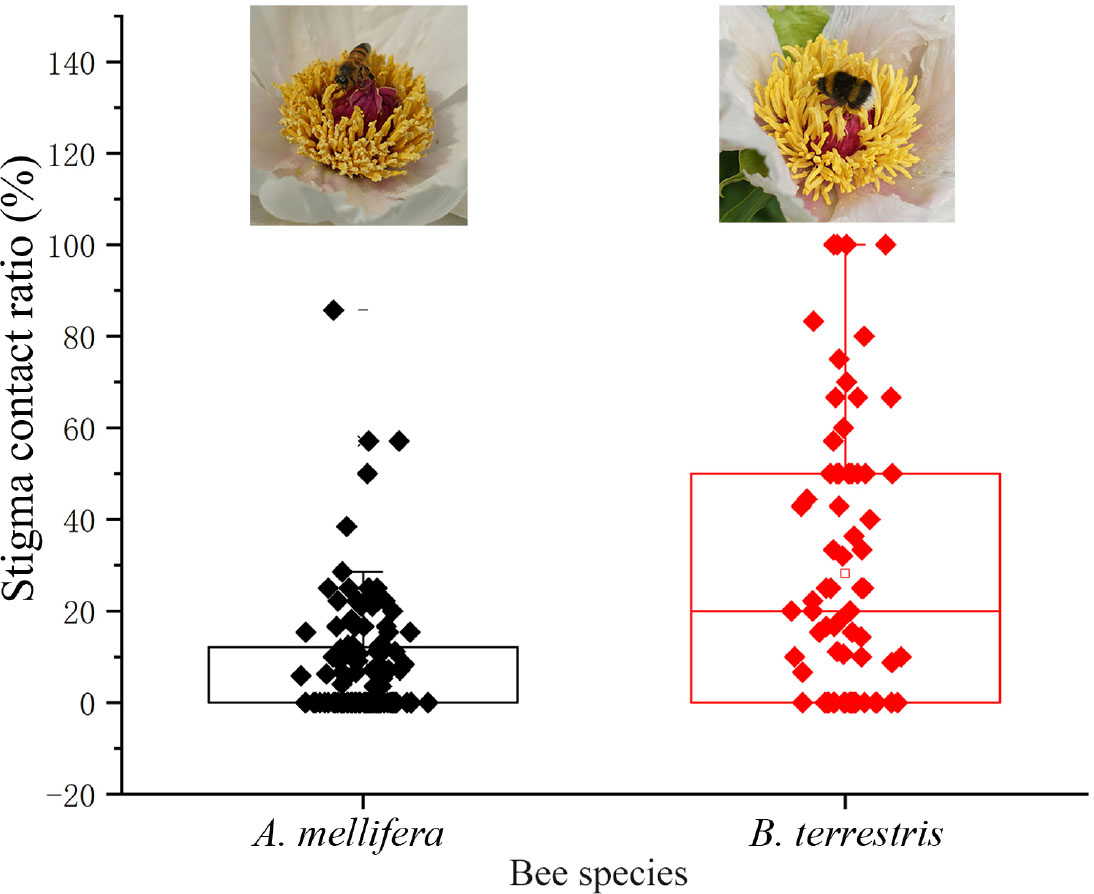
Fig. 3
The stigma contact ratios of honeybees and ground bumblebees. The upper limit of the rectangle is the 75th percentile of the data, the lower limit is the 25th percentile, and the middle line is the 50th percentile. The vertical length of the rectangle represents the quartile range, and the solid squares (points) are the observed values.
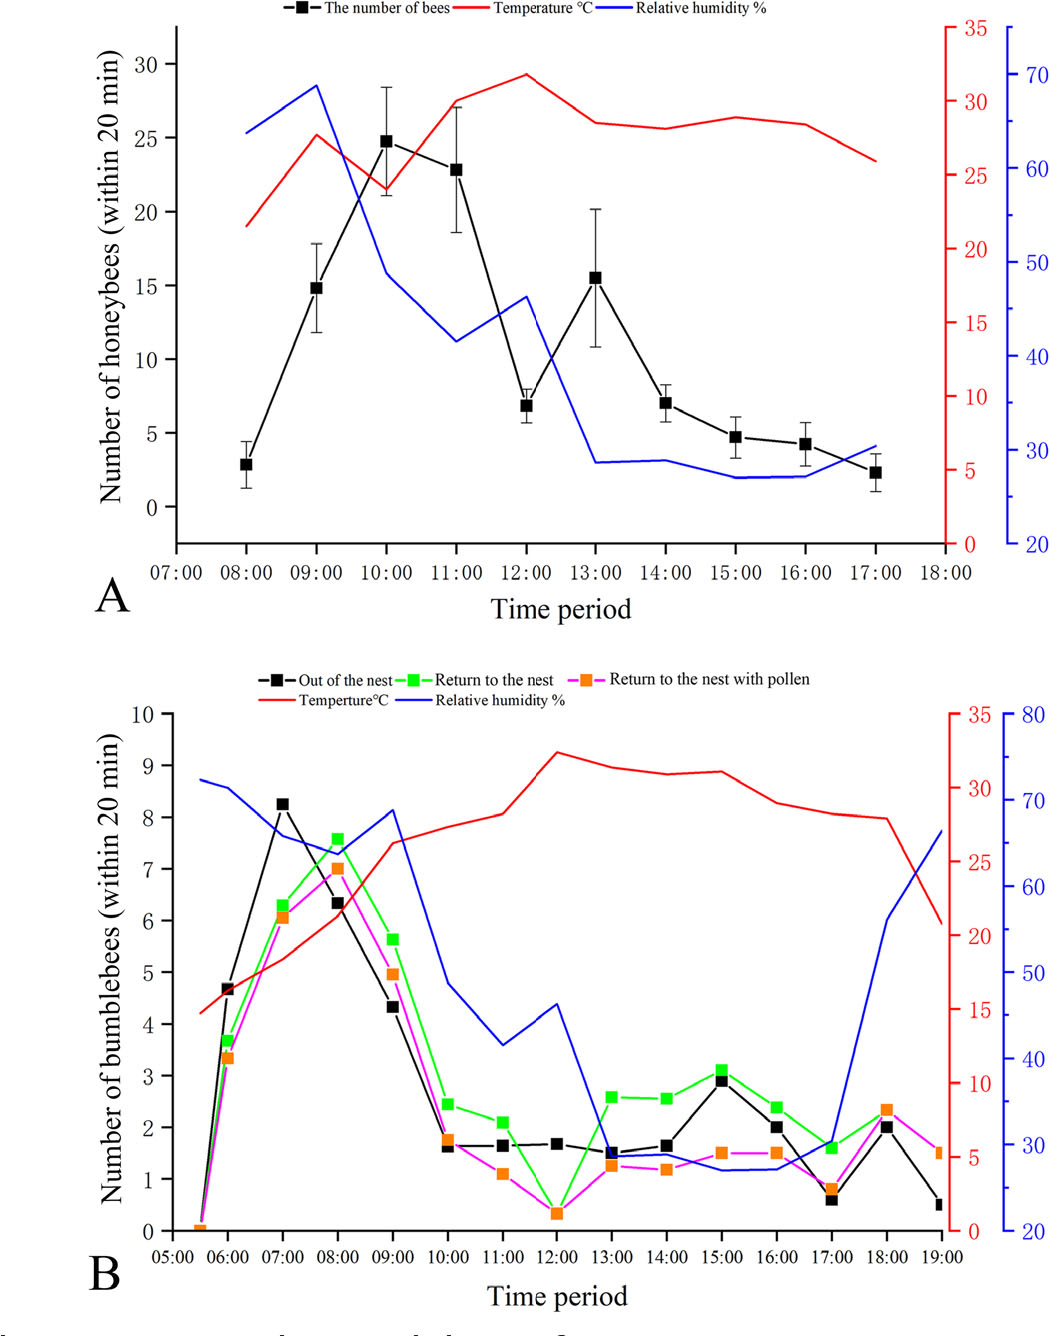
Fig. 4
The daily activity of honeybees (A) and ground bumblebees (B) on oil tree peony (the Y-axis on the left shows the number of flowers visited by honeybees, and the Y-axis on the right shows the air temperature in consecutive hours of observation)
Table 1
Effect of pollination by honeybees and ground bumblebees on the yield parameters and quality of oil tree peony (SE - standard error, n - number of samples)
| Measurement index | A. mellifera (mean±SE (n)) | B. terrestris (mean±SE (n)) | Pollination without insects (mean±SE (n)) | Field plot (mean±SE (n)) |
|---|---|---|---|---|
| Number of fruits per plant | 11.23±0.30 (311)a | 10.51±0.27 (296)a | 9.61±0.46 (90)b | 10.95±0.50 (96)a |
| Number of seeds per follicle | 36.44±0.55 (869)a | 24.99±0.62 (866)b | 15.92±0.36 (863)d | 18.88±0.35 (866)c |
| Seed weight per follicle (g) | 8.90±0.25 (872)a | 7.45±0.24 (974)b | 4.69±0.10 (865)d | 5.25±0.14 (867)c |
| Number of seeds per plant | 414.93±21.04 (98)a | 281.46±15.93 (95)b | 204.58±10.29 (90)c | 152.34±10.48 (97)c |
| Seed weight per plant (g) | 102.42±5.91 (98)a | 75.57±4.13 (95)b | 45.06±3.03 (90)d | 57.30±2.96 (97)c |
| Kernel percentage (%) | 66.92±0.002 (9)a | 66.47±0.001 (9)a | 66.13±0.002 (3)a | 65.59±0.002 (3)a |
| Oil yield rate (%) | 22.03±0.25 (9)a | 21.72±0.33 (9)a | 20.67±0.60 (3)a | 21.10±0.31 (3)a |
[i] The data in the same row followed by different letters are significantly different at the 0.05 level (one-way ANOVA followed by a Bonferroni test or nonparametric Kruskal-Wallis H analysis).
Table 2
Peony seed oil components (in %) obtained under different pollination treatments (mean±SE; SE – standard error)
| Component | A. mellifera | B. terrestris | Pollination without insects | Field plot |
|---|---|---|---|---|
| Palmitic acid | 5.98±0.07a | 5.93±0.02a | 6.00±0.04a | 6.00±0.04a |
| Stearic acid | 2.12±0.02a | 2.16±0.02a | 2.23±0.01a | 2.18±0.02a |
| Oleinic acid | 22.9±0.15a | 23.4±0.02a | 23.4±0.00a | 23.9±0.10a |
| Linoleic acid | 24.37±0.23a | 23.5±0.38a | 22.7±0.10a | 23.2±0.00a |
| α-Linolenic acid | 43.97±0.39a | 44.37±0.09a | 44.3±0.10a | 44.2±0.00a |
| Unsaturated fatty acids | 91.34±0.06a | 91.53±0.58a | 91.66±0.00a | 91.56±0.11a |
[i] The data in the same row followed by different letters are significantly different at the 0.05 level (Kruskal-Wallis H analysis).