
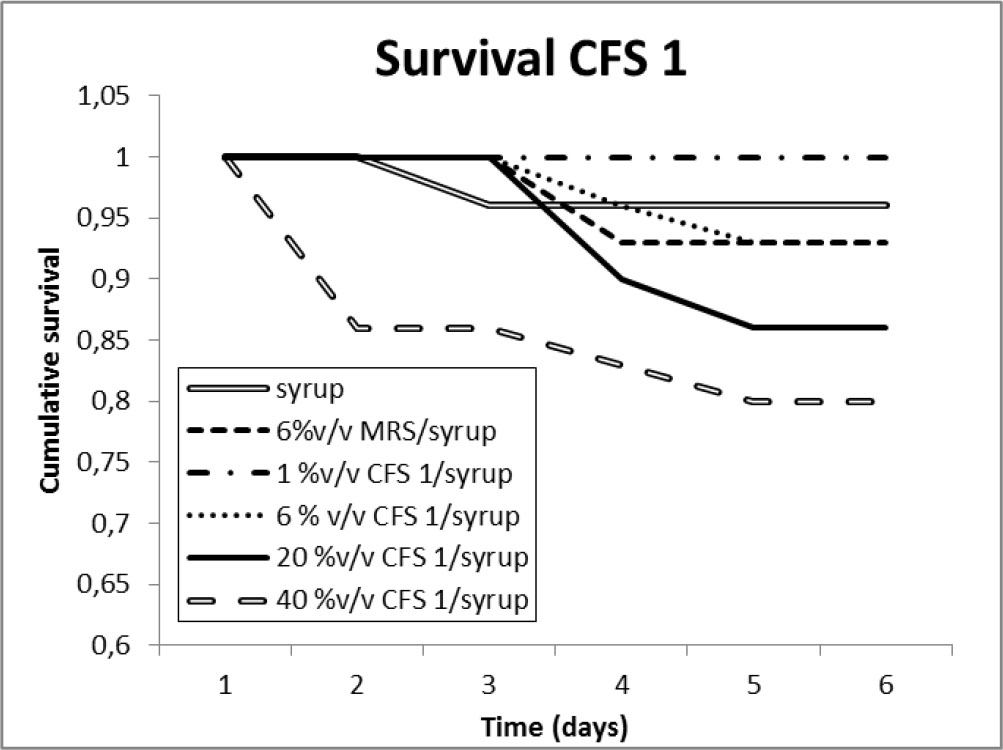
Fig. 1
Cumulative survival of bees fed on different concentrations of CFS 1 (cell-free supernatant produced by Lactobacillus johnsonii AJ5) for six days.
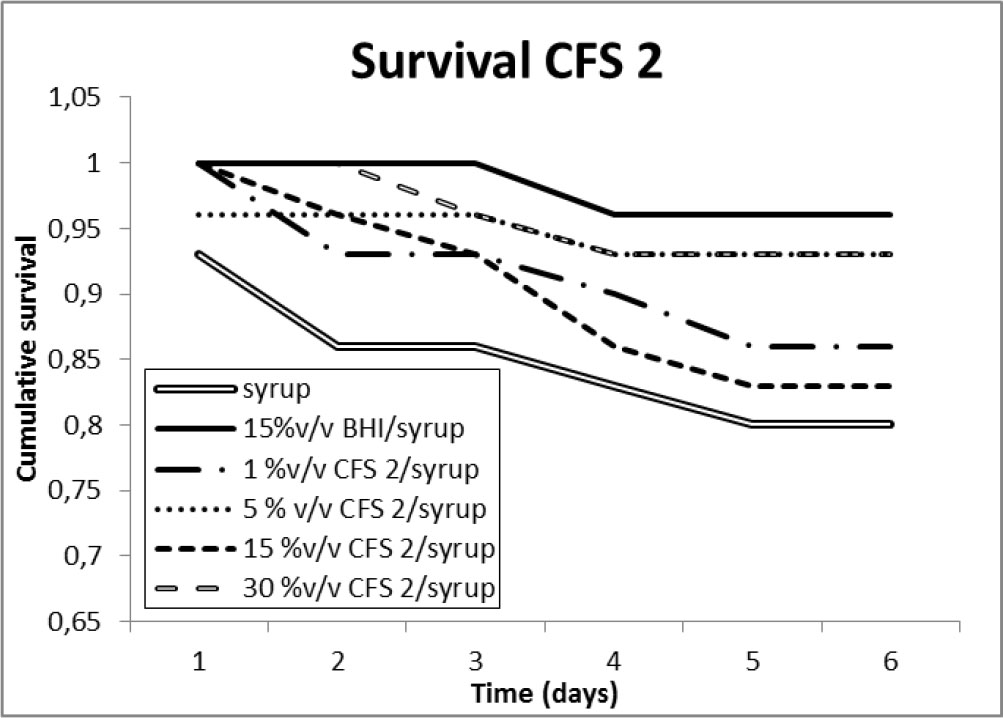
Fig. 2
Cumulative survival of bees fed on different concentrations of CFS 2 (cell-free supernatant produced by Enterococcus faecium SM21) for six days.
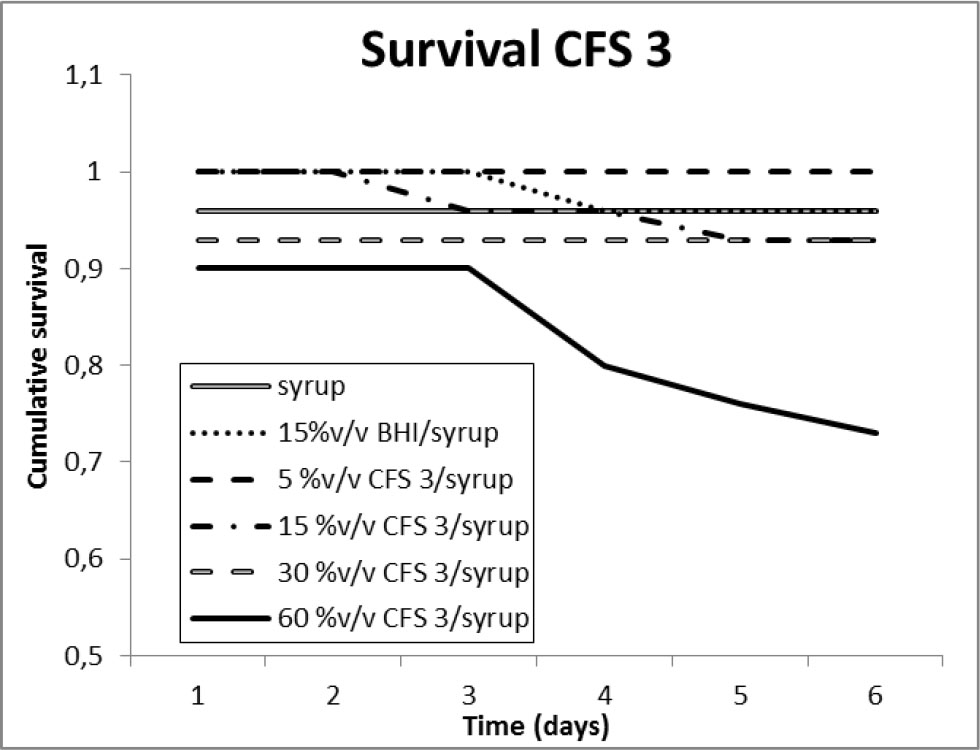
Fig. 3
Cumulative survival of bees fed on different concentrations of CFS 3 (cell-free supernatant produced by Bacillus subtilis subsp. subtilis Mori2) for six days.
Table 1
Mean and standard deviation of soluble protein per bee (mg/mg) for each CFS concentration
| CFS concentration | Mean ± SD | |
|---|---|---|
| Control | Syrup | 0.0105bc ± 0.0022 |
| MRS/syrup | 0.0098c ± 0.0029 | |
| BHI/syrup | 0.0106bc ± 0.0018 | |
| CFS1 | 1 % v/v CFS 1/syrup | 0.0106bc ± 0.0023 |
| 6 % v/v CFS 1/syrup | 0.0112abc ± 0.0027 | |
| 20 % v/v CFS 1/syrup | 0.0119abc ± 0.0033 | |
| 40 % v/v CFS 1/syrup | 0.0146a± 0.0054 | |
| CFS2 | 1 % v/v CFS 2/syrup | 0.0115abc ± 0.0029 |
| 5 % v/v CFS 2/syrup | 0.0115abc ± 0.0036 | |
| 15 % v/v CFS 2/syrup | 0.0125abc ± 0.0025 | |
| 30 % v/v CFS 2/syrup | 0.0136ab ± 0.0049 | |
| CFS3 | 5 % v/v CFS 3/syrup | 0.0110abc ± 0.0026 |
| 15 % v/v CFS 3/syrup | 0.0127abc ± 0.0048 | |
| 30 % v/v CFS 3/syrup | 0.0142a± 0.0039 | |
| 60 % v/v CFS 3/syrup | - | |
[i] Different letters represent significant differences between treatments (p<0.05). (−) stands for absence of sample (bees died before the end of the trial). SD= standard deviation; MRS= MRS broth; BHI= BHI broth; CFS = cell-free supernatant produced by: 1- L. johnsonii AJ5; 2- E. faecium SM21; 3- B. subtilis subsp. subtilis Mori2. Bolt letters represent the highest values.
Table 2
Mean and standard deviation of fat body mass per bee (mg/bee) for each CFS concentration
| CFS concentration | Mean ± SD | |
|---|---|---|
| Control | Syrup | 0.0021ab ± 0.0012 |
| MRS/syrup | 0.0018ab ± 0.0012 | |
| BHI/syrup | 0.0018ab ± 0.0009 | |
| CFS1 | 1 % v/v CFS 1/syrup | 0.0019ab ± 0.0010 |
| 6 % v/v CFS 1/syrup | 0.0018ab ± 0.0010 | |
| 20 % v/v CFS 1/syrup | 0.0019ab ± 0.0009 | |
| 40 % v/v CFS 1/syrup | 0.0020ab ± 0.0010 | |
| CFS2 | 1 % v/v CFS 2/syrup | 0.0019ab ± 0.0013 |
| 5 % v/v CFS 2/syrup | 0.0021ab ± 0.0017 | |
| 15 % v/v CFS 2/syrup | 0.0015b ± 0.0008 | |
| 30 % v/v CFS 2/syrup | 0.0022a± 0.0013 | |
| CFS3 | 5 % v/v CFS 3/syrup | 0.0018ab ± 0.0010 |
| 15 % v/v CFS 3/syrup | 0.0023a ± 0.0011 | |
| 30 % v/v CFS 3/syrup | 0.0019ab ± 0.0008 | |
| 60 % v/v CFS 3/syrup | - | |
[i] Different letters represent significant differences between treatments (p<0.05). (−) stands for absence of sample (bees died before the end of the trial). SD= standard deviation; MRS= MRS broth; BHI= BHI broth; CFS = cell-free supernatant produced by: 1- L. johnsonii AJ5; 2- E. faecium SM21; 3- B. subtilis subsp. subtilis Mori2. Bolt letters represent the highest values.
Table 3
V. destructor mortality (%) at different CFS concentrations (% v/v) at 7 h of contact exposition
| CFS concentration | Mortality % | |
|---|---|---|
| Control | Water | 0 |
| MRS/water | 0 | |
| BHI/water | 0 | |
| CFS1 | 10 % v/v CFS1/water | 3.33 |
| 30 % v/v CFS1/water | 11.1 | |
| 60 % v/v CFS1/water | 3.57 | |
| 100 % v/v CFS1/water | 6.66 | |
| CFS2 | 10 % v/v CFS2/water | 0 |
| 30 % v/v CFS2/water | 0 | |
| 60 % v/v CFS2/water | 0 | |
| 100 % v/v CFS2/water | 3.33 | |
| CFS3 | 10 % v/v CFS3/water | 0 |
| 30 % v/v CFS3/water | 0 | |
| 60 % v/v CFS3/water | 0 | |
| 100 % v/v CFS3/water | 0 | |
[i] MRS= MRS broth; BHI= BHI broth; CFS = cell-free supernatant produced by: 1- L. johnsonii AJ5; 2- E. faecium SM21; 3- B. subtilis subsp. subtilis Mori2.
Table 4
Mean and standard deviation of dead mite at 72 h in contact with bees feeding with different CFSs concentrations
| CFS concentration | Dead mite ± SD | Effectiveness (%) | |
|---|---|---|---|
| Control | syrup | 0.125a ± 0.337 | 12.5 |
| MRS/syrup | 0.130a ± 0.344 | 13 | |
| BHI/syrup | 0.133a ± 0.345 | 13.3 | |
| CFS1 | 1 % v/v CFS 1/syrup | 0.218a ± 0.420 | 21.8 |
| 6 % v/v CFS 1/syrup | 0.419ab ± 0.501 | 41.9 | |
| 20 % v/v CFS 1/syrup | 0.333ab ± 0.479 | 33.3 | |
| 40 % v/v CFS 1/syrup | 0.566b ± 0.504 | 56.6 | |
| CFS2 | 1 % v/v CFS 2/syrup | 0.130a ± 0.344 | 13 |
| 5 % v/v CFS 2/syrup | 0.214a ± 0.417 | 21.4 | |
| 15 % v/v CFS 2/syrup | 0.200a ± 0.406 | 20 | |
| 30 % v/v CFS 2/syrup | 0.166a ± 0.379 | 16.6 | |
| CFS3 | 5 % v/v CFS 3/syrup | 0.259a ± 0.446 | 25.9 |
| 15 % v/v CFS 3/syrup | 0.233a ± 0.430 | 23.3 | |
| 30 % v/v CFS 3/syrup | 0.241a ± 0.435 | 24.1 | |
| 60 % v/v CFS 3/syrup | 0.240a ± 0.435 | 24 | |
[i] Different letters represent significant differences between treatments (p<0.05). MRS= MRS broth; BHI= BHI broth; CFS = cell-free supernatant produced by: 1- L. johnsonii AJ5; 2- E. faecium SM21; 3- B. subtilis subsp. subtilis Mori2. Bolt letters represent the highest values.