
Table 1
Country examples of reforms identified according to different criteria
| Shock (+) or counter-shock (−) | Implementation year | Area | Country | Content | Normative language featured in OECD Country Survey | Mention in later Surveys | Large change in OECD indicator |
|---|---|---|---|---|---|---|---|
| − | 1975 | Minimum Wages | Australia | The decision provides an immediate increase of 3.6% in all wages under Federal award and an increase of $ 4 per week in the minimum wage, effective from the first period on or after May 15. | 1976, 1980 | No | |
| + | 1984 | Minimum Wages | Denmark | Agreement on additional budget improvements, amounting to Kr. 1 ½ billion in 1984 and some Kr. 5 billion in 1985. | (…) Major steps to improve the wage formation process were taken already in 1979/80 by first excluding energy prices from the index regulating wage increases and then partially suppressing automatic wage adjustments. After a 2-year pause, efforts to break the wage–price spiral were intensified by the present Government, which, in 1982, decided to suspend the automatic indexation scheme until 1985. (…) | 1986 | No |
| + | 1993 | CB | Australia | Industrial Relations Reform Bill 1993 | (p. 89, 1994): The Federal Government has introduced the Industrial Relations Reform Bill 1993 in order to provide an effective framework for the further spread of enterprise bargaining throughout the Australian economy. A major part of the Reform Bill is the introduction of more effective arrangements for direct bargaining, including the establishment of a new stream of enterprise flexibility agreements to be made directly between employers and employees. These agreements will be of particular relevance to non-unionized and lightly unionized enterprises. (…) | 1994, 1995, 1997, 1998 | No |
| + | 1984 | CB | Greece | The 1984 national collective agreement. | The 1984 national collective agreement is signed, providing for full indexation of minimum salaries and wages. | No | Yes |
[i] CB, collective bargaining.
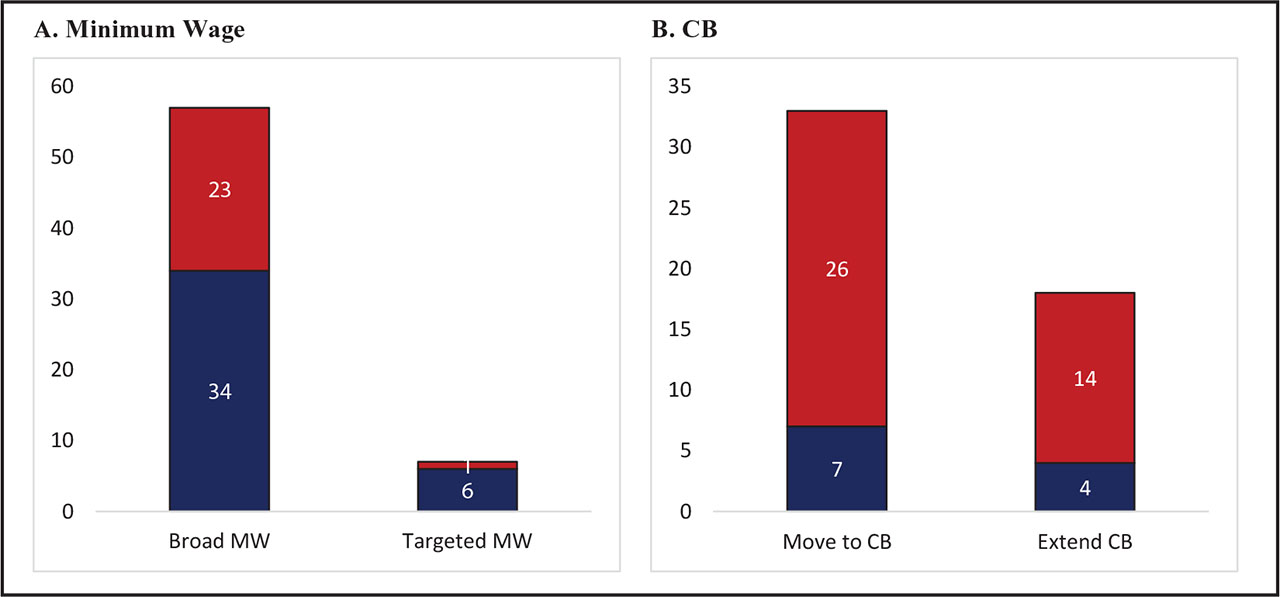
Figure 1
Number of Major Shocks and Counter-shocks (26 advanced economies, 1970–2020).
Note: In blue are pro-competitive shocks; in red are anti-competitive counter-shocks. CB, collective bargaining; MW, minimum wage.
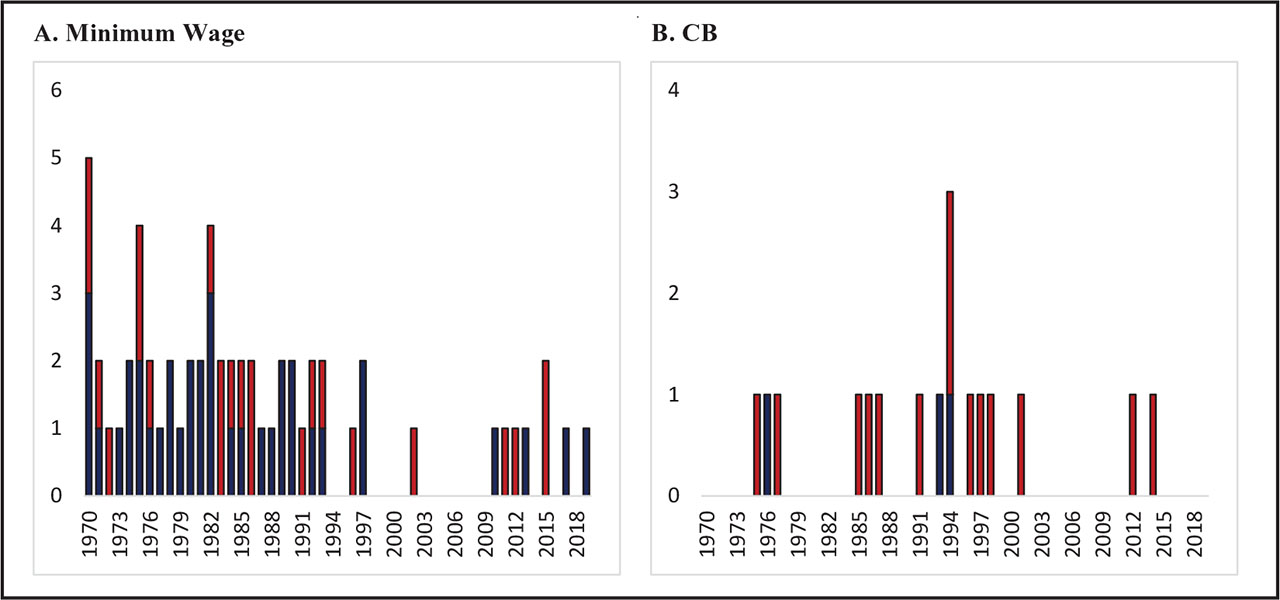
Figure 2
Distribution of Major Shocks and Counter-Shocks across Time (26 advanced economies).
Note: In blue are pro-competitive shocks; in red are anti-competitive counter-shocks. CB, collective bargaining; MW, minimum wage.
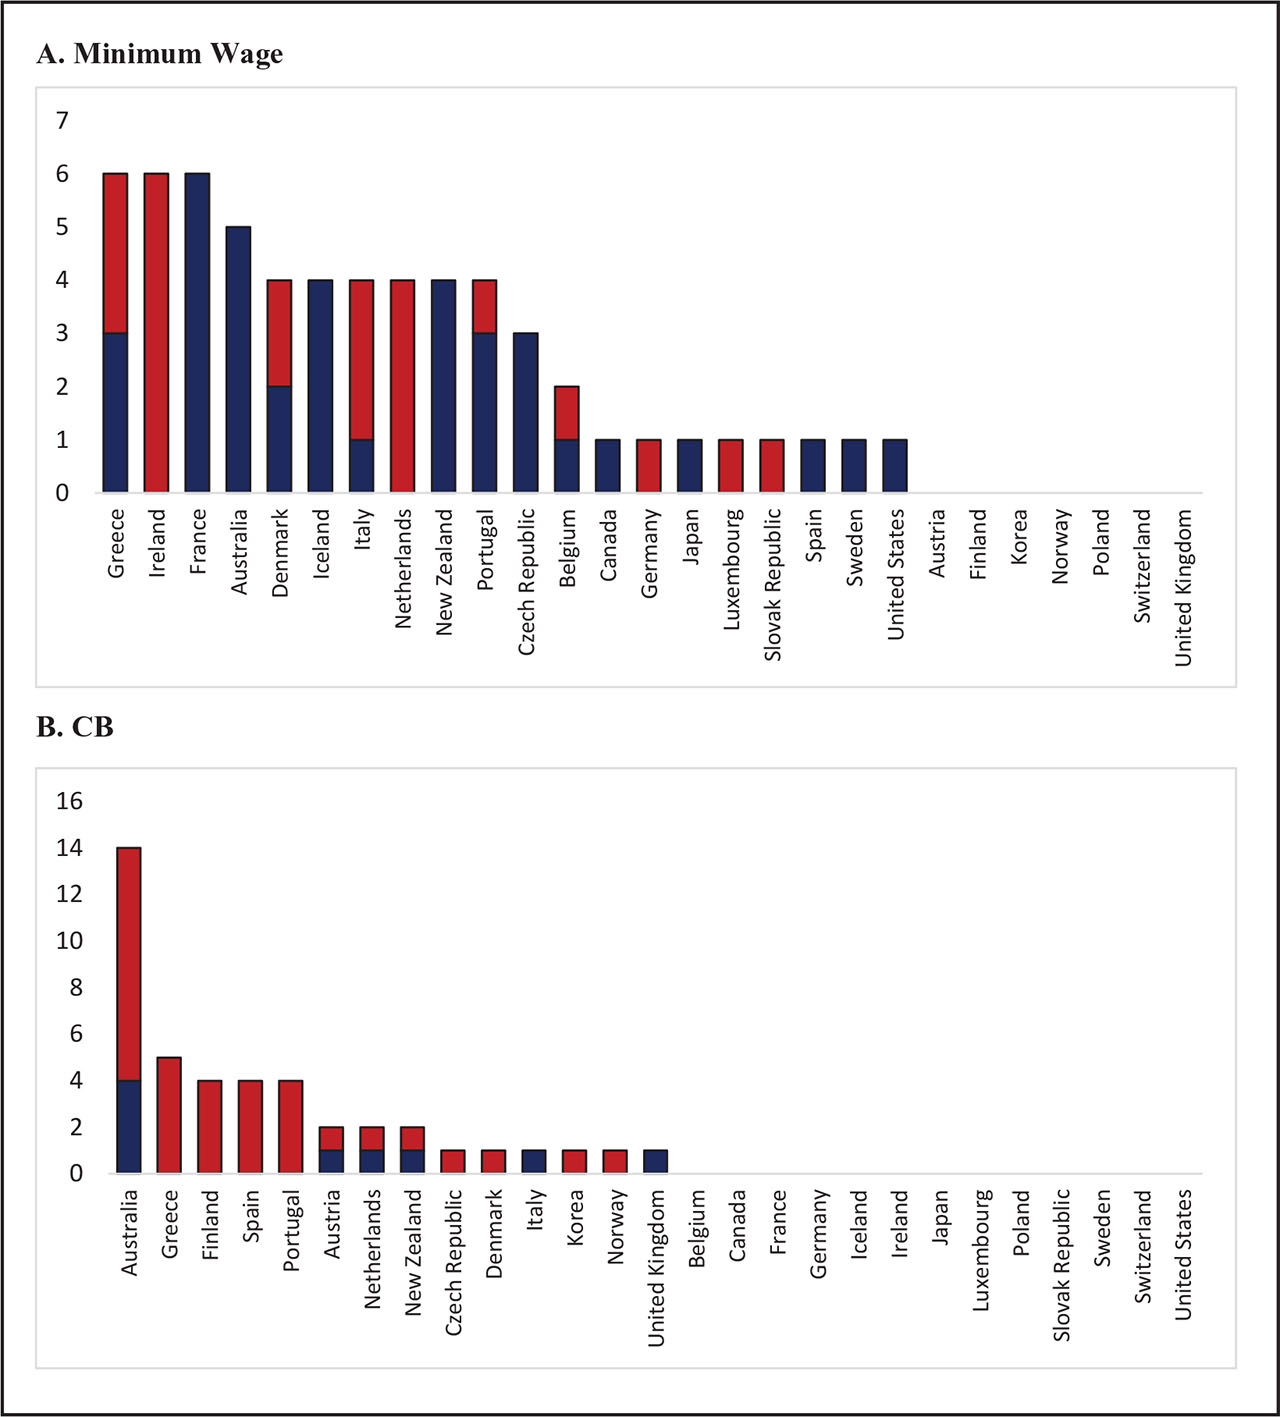
Figure 3
Number of Major Shocks and Counter-shocks by Country (1970–2020).
Note: In blue are pro-competitive shocks; in red are anti-competitive counter-shocks. CB, collective bargaining; MW, minimum wage.
Table 2
Percentage of shocks by area in good and bad times
| Good times | Bad times | |
|---|---|---|
| Minimum wage | 57 | 43 |
| Broad | 59 | 41 |
| Targeted | 0 | 100 |
| CB | 27 | 73 |
| Move to facilitate firm level bargaining | 21 | 79 |
| Extensions to collective wage agreements | 32 | 68 |
[i] Source: Authors’ calculations.
[ii] Note: Good and bad times are defined simply as positive and negative real output gaps in a given year, respectively.
[iii] CB, collective bargaining.
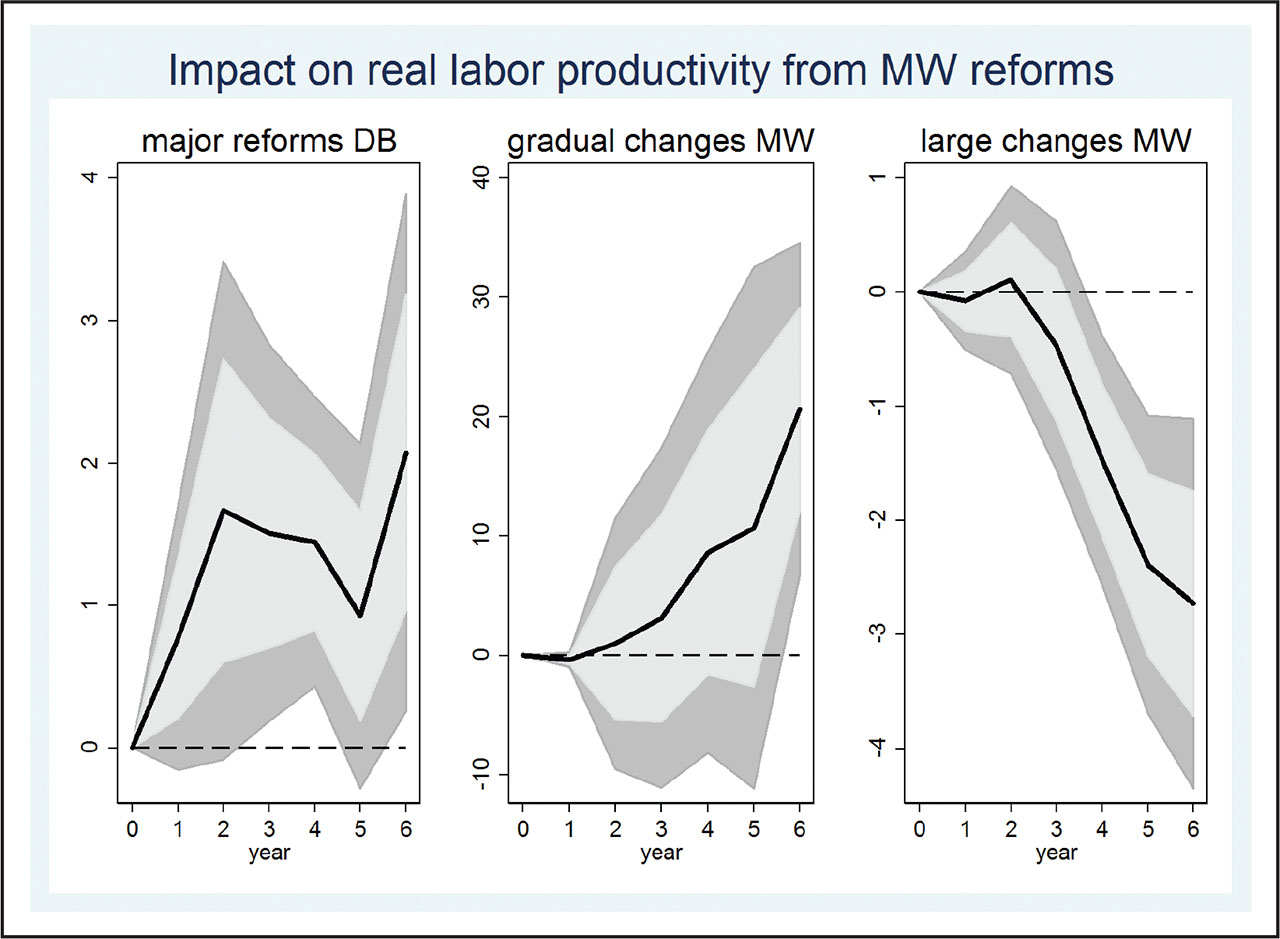
Figure 4
The Average Effect of Major Minimum Wage Shocks on real labor productivity (percent).
Note: “DB” stands for “database” and refers to the new narrative data created. “Gradual changes” are yearly changes in the indicator. “Large changes” are those associated with a change in the OECD indicator in the top 5th percentile of the sample distribution of annual changes in the indicator. The x-axis indicates the number of years; t = 0 is the year of the reform shock; and t = 1 is the first year of impact. The solid lack lines denote the response to a reform shock, the dark gray area denotes 90% confidence bands, and the light gray area denotes 68% confidence bands, based on standard errors clustered at the country level. MW, minimum wage.
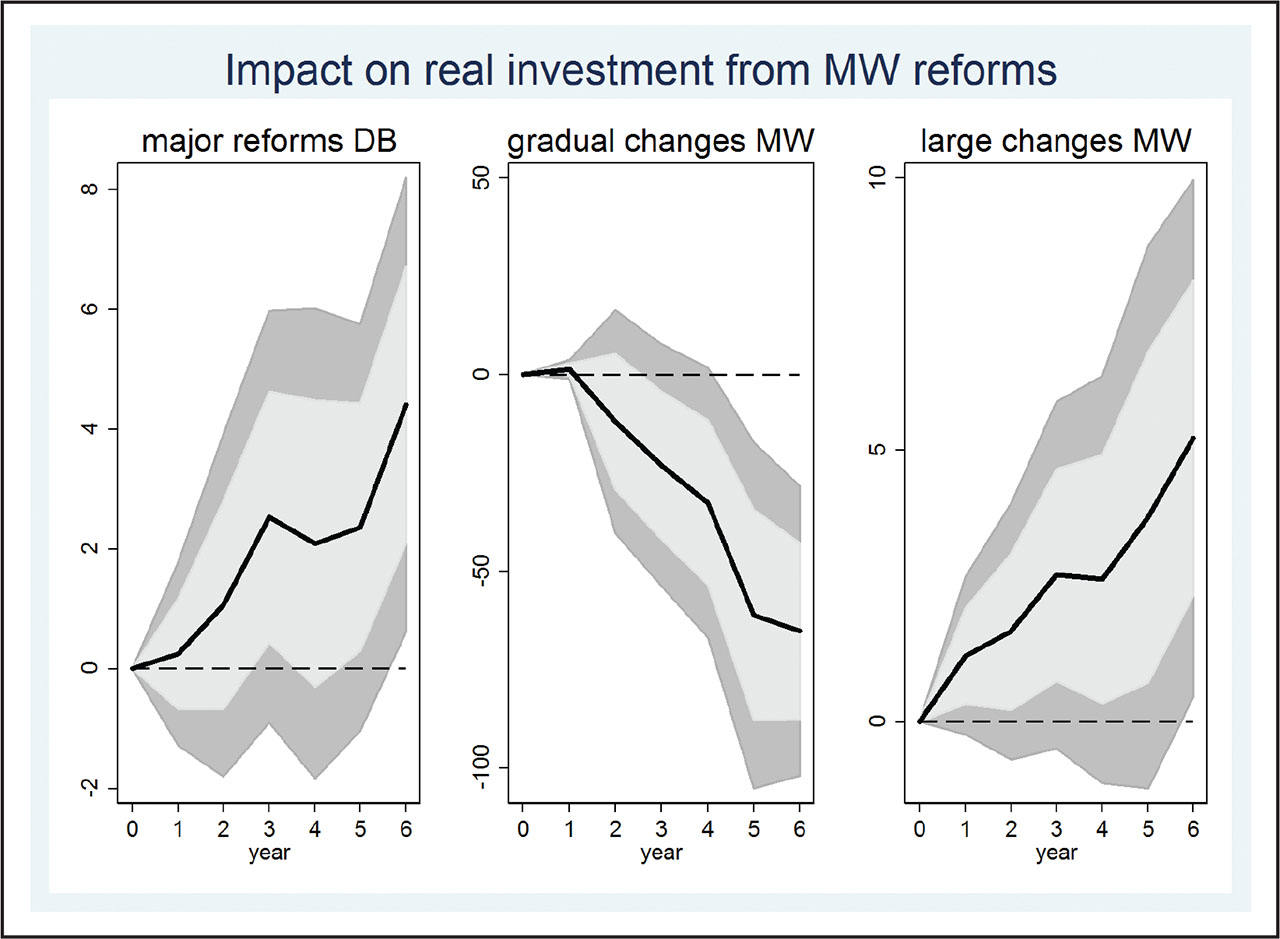
Figure 5
The Average Effect of Major Minimum Wage Shocks on real GFCF (percent).
Note: “DB” stands for “database” and refers to the new narrative data created. “Gradual changes” are yearly changes in the indicator. “Large changes” are those associated with a change in the OECD indicator in the top 5th percentile of the sample distribution of annual changes in the indicator. The x-axis indicates the number of years; t = 0 is the year of the reform shock; and t = 1 is the first year of impact. The solid black lines denote the response to a reform shock, the dark grey area denotes 90% confidence bands, and the light gray area denotes 68% confidence bands, based on standard errors clustered at the country level. MW, minimum wage; GFCF, gross fixed capital formation.
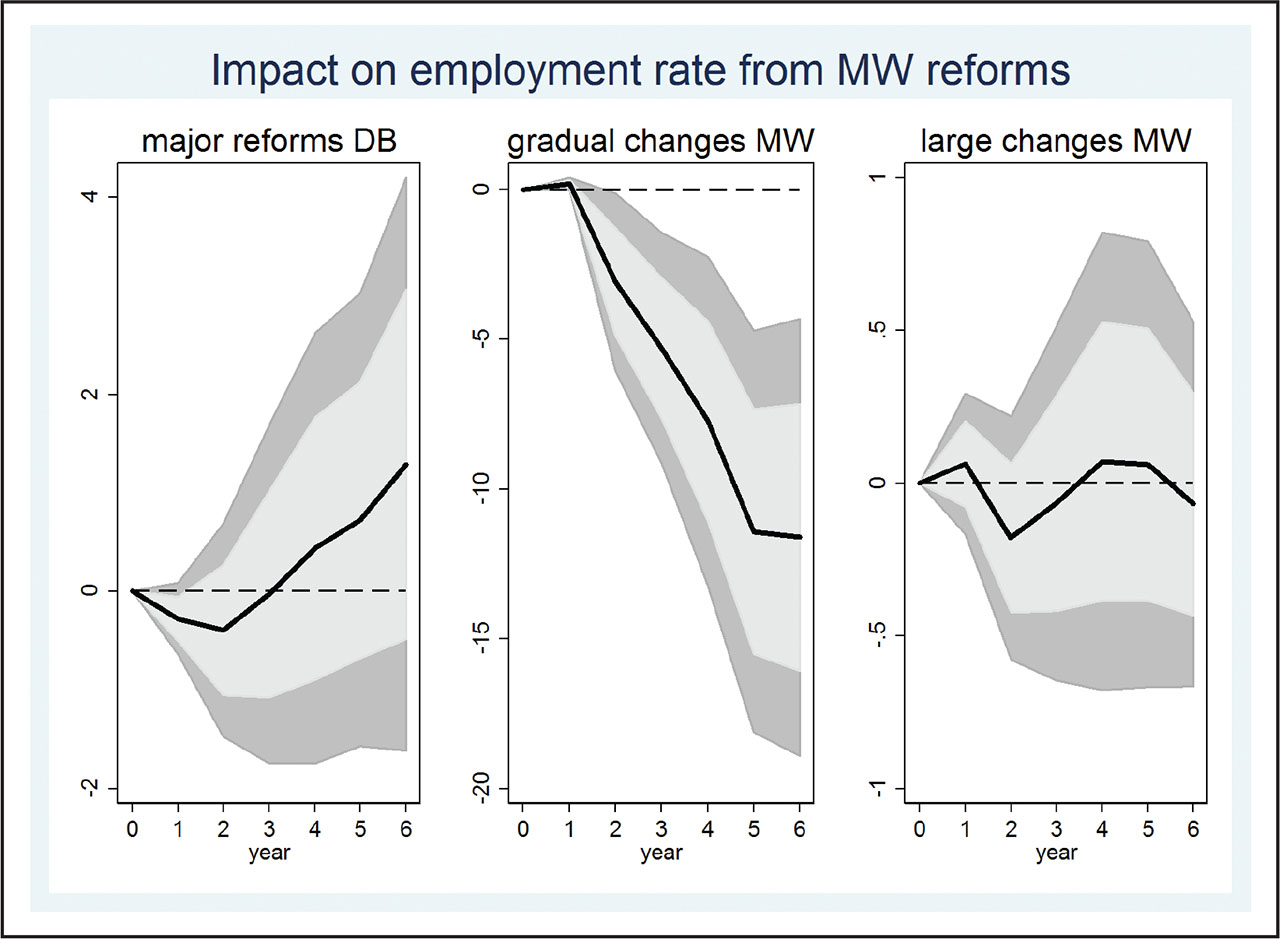
Figure 6
The Average Effect of Major Minimum Wage Shocks on employment rate (percentage points).
Note: “DB” stands for “database” and refers to the new narrative data created. “Gradual changes” are yearly changes in the indicator. “Large changes” are those associated with a change in the OECD indicator in the top 5th percentile of the sample distribution of annual changes in the indicator. The x-axis indicates the number of years; t = 0 is the year of the reform shock; and t = 1 is the first year of impact. The solid black lines denote the response to a reform shock, the dark grey area denotes 90% confidence bands, and the light gray area denotes 68% confidence bands, based on standard errors clustered at country level. MW, minimum wage.
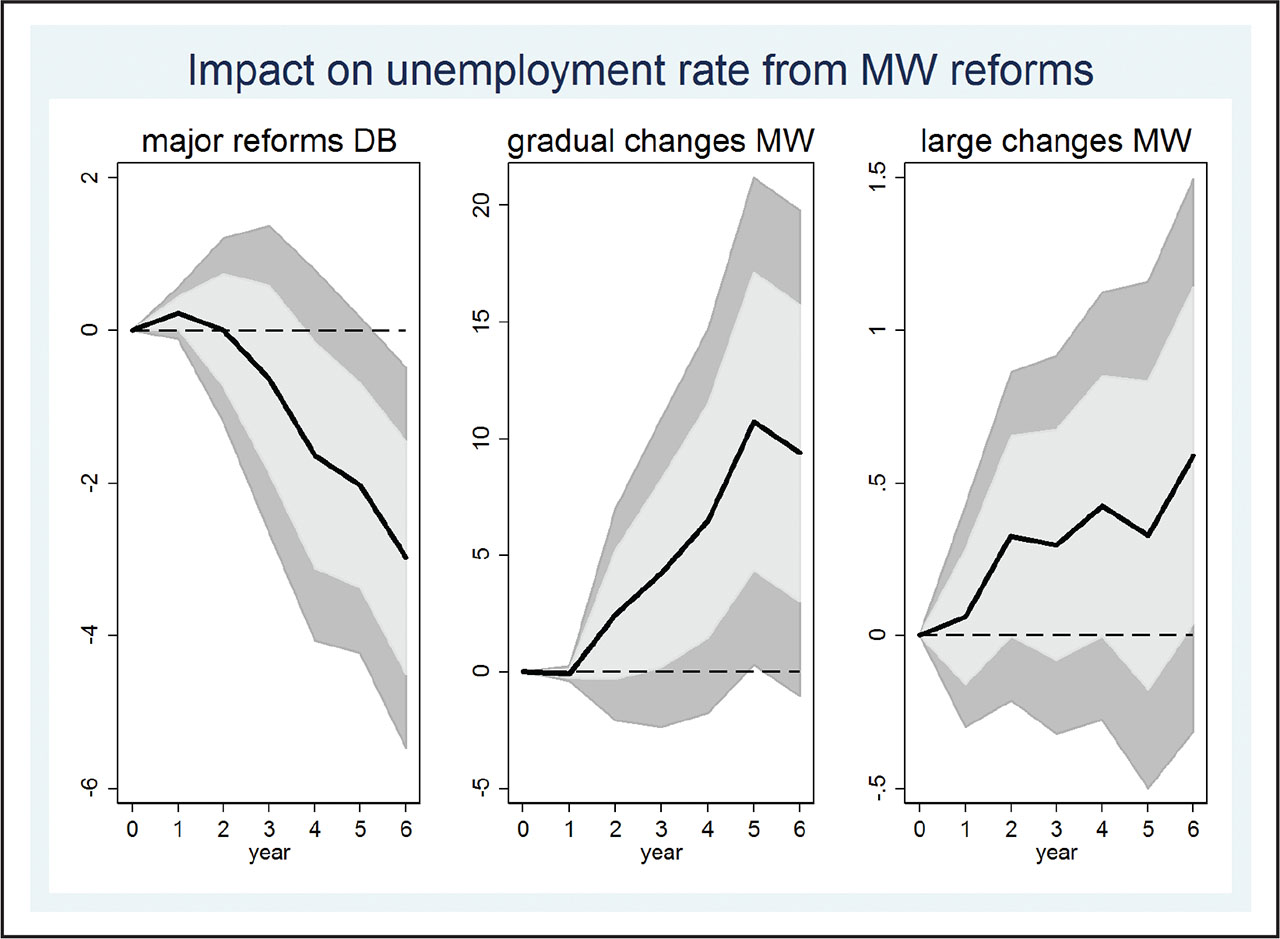
Figure 7
The Average Effect of Major Minimum Wage Reforms on unemployment rate (percentage points).
Note: “DB” stands for “database” and refers to the new narrative data created. “Gradual changes” are yearly changes in the indicator. “Large changes” are those associated with a change in the OECD indicator in the top 5th percentile of the sample distribution of annual changes in the indicator. The x-axis indicates the number of years; t = 0 is the year of the reform shock; and t = 1 is the first year of impact. The solid black lines denote the response to a reform shock, the dark grey area denotes 90% confidence bands, and the light gray area denotes 68% confidence bands, based on standard errors clustered at country level. MW, minimum wage.
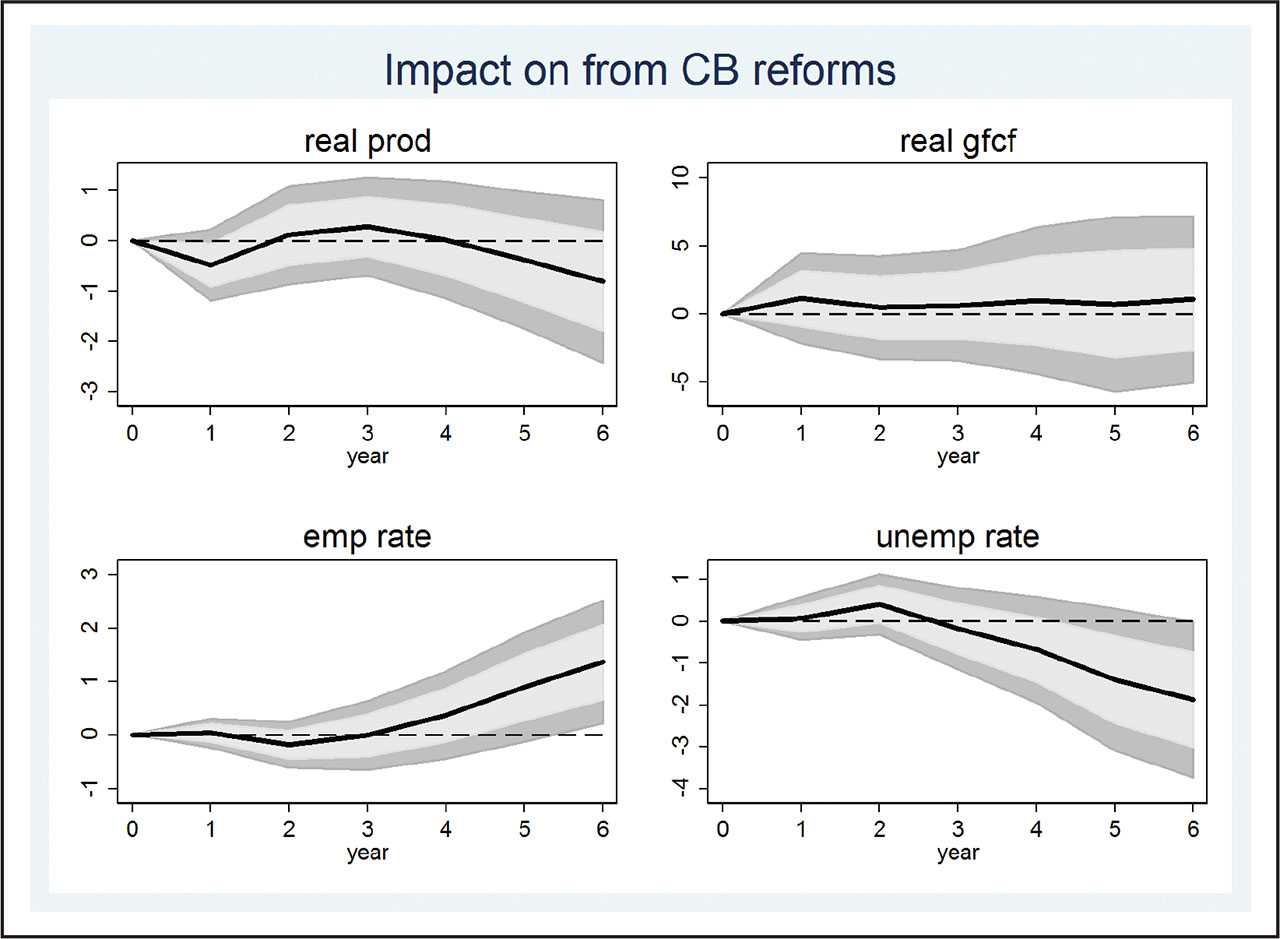
Figure 8
The Average Effect of Major Collective Bargaining Shocks on macroeconomic outcomes (percent for real variables and pp for rates).
Note: The x-axis indicates the number of years; t = 0 is the year of the reform shock; and t = 1 is the first year of impact. The solid black lines denote the response to a reform shock, the dark gray area denotes 90% confidence bands, and light gray area denotes 68% confidence bands, based on standard errors clustered at country level.
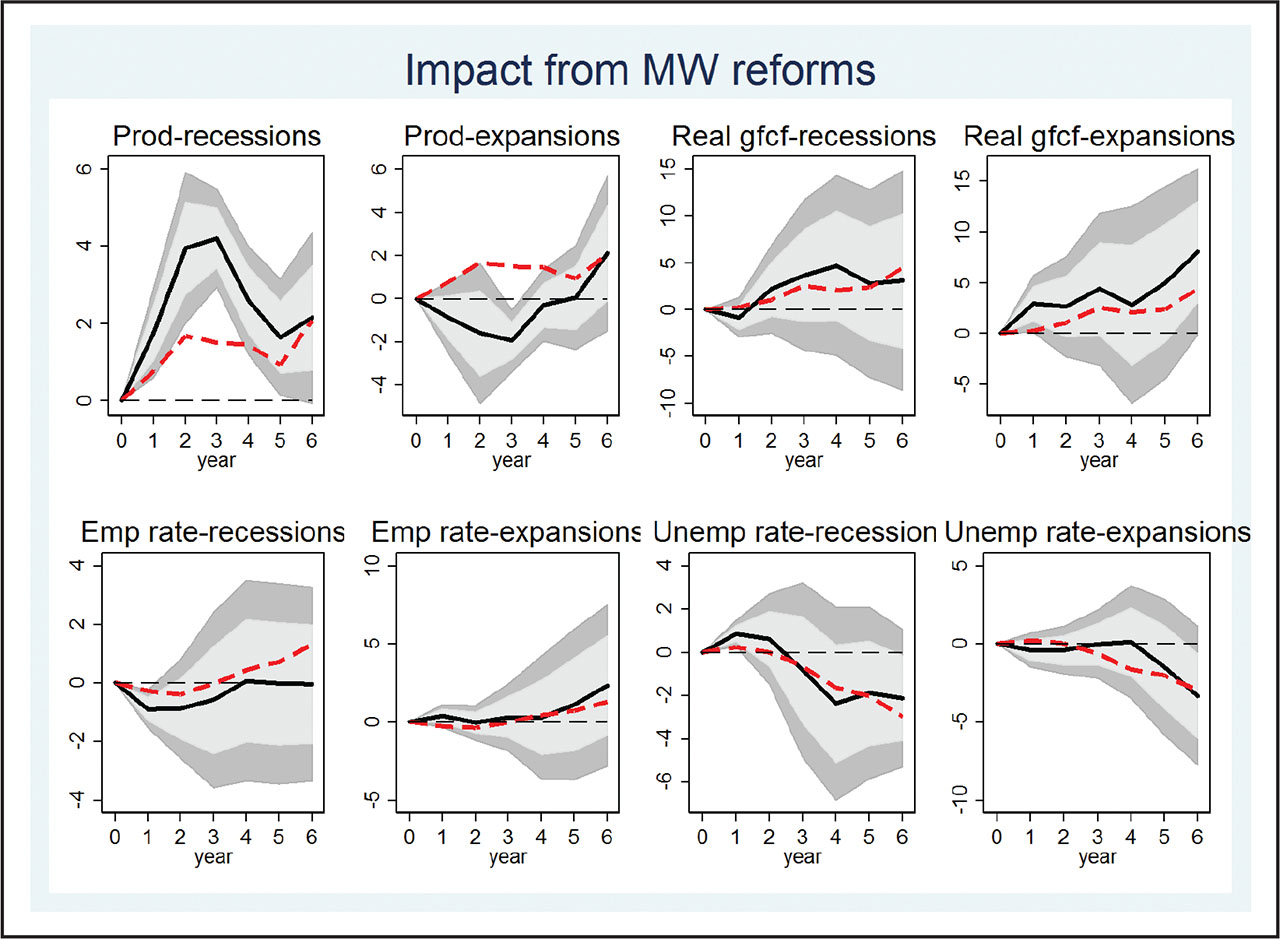
Figure 9
The Average Effect of Major Minimum Wage Shocks on macroeconomic outcomes: the role of the business cycle (percent for real variables and pp for rates).
Note: The x-axis indicates the number of years; t = 0 is the year of the reform shock; and t = 1 is the first year of impact. The solid black lines denote the response to a reform shock, the dark gray area denotes 90% confidence bands, and the light gray area denotes 68% confidence bands, based on standard errors clustered at country level. The red line denotes the unconditional baseline result from estimating Eq. (1).
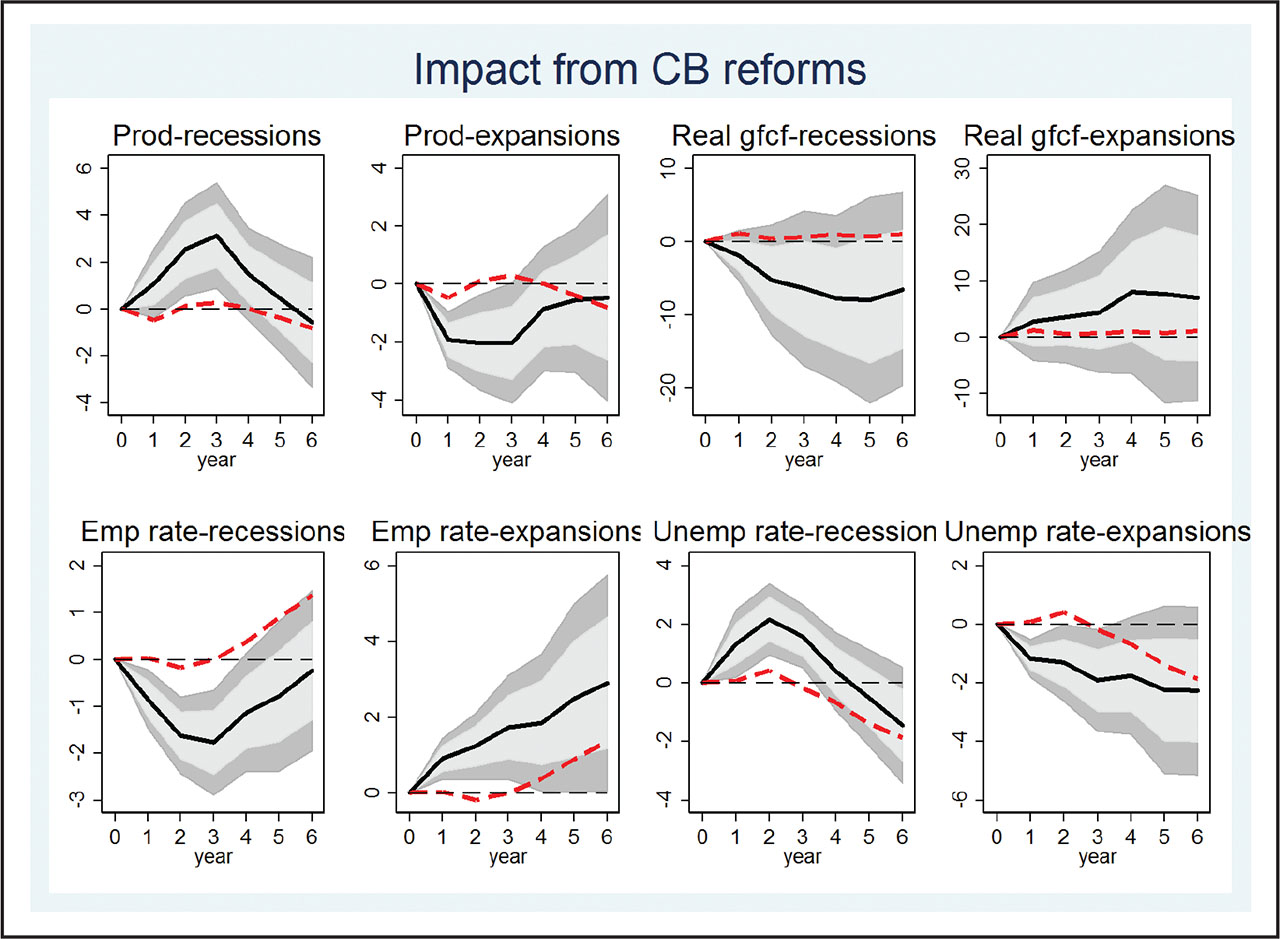
Figure 10
The Average Effect of Major Collective Bargaining Reforms on macroeconomic outcomes: the role of the business cycle (%).
Note: The x-axis indicates the number of years; t = 0 is the year of the reform shock; and t = 1 is the first year of impact. The solid black lines denote the response to a reform shock, the dark gray area denotes 90% confidence bands, and the light gray area denotes 68% confidence bands, based on standard errors clustered at country level. The red line denotes the unconditional baseline result from estimating Eq. (1).
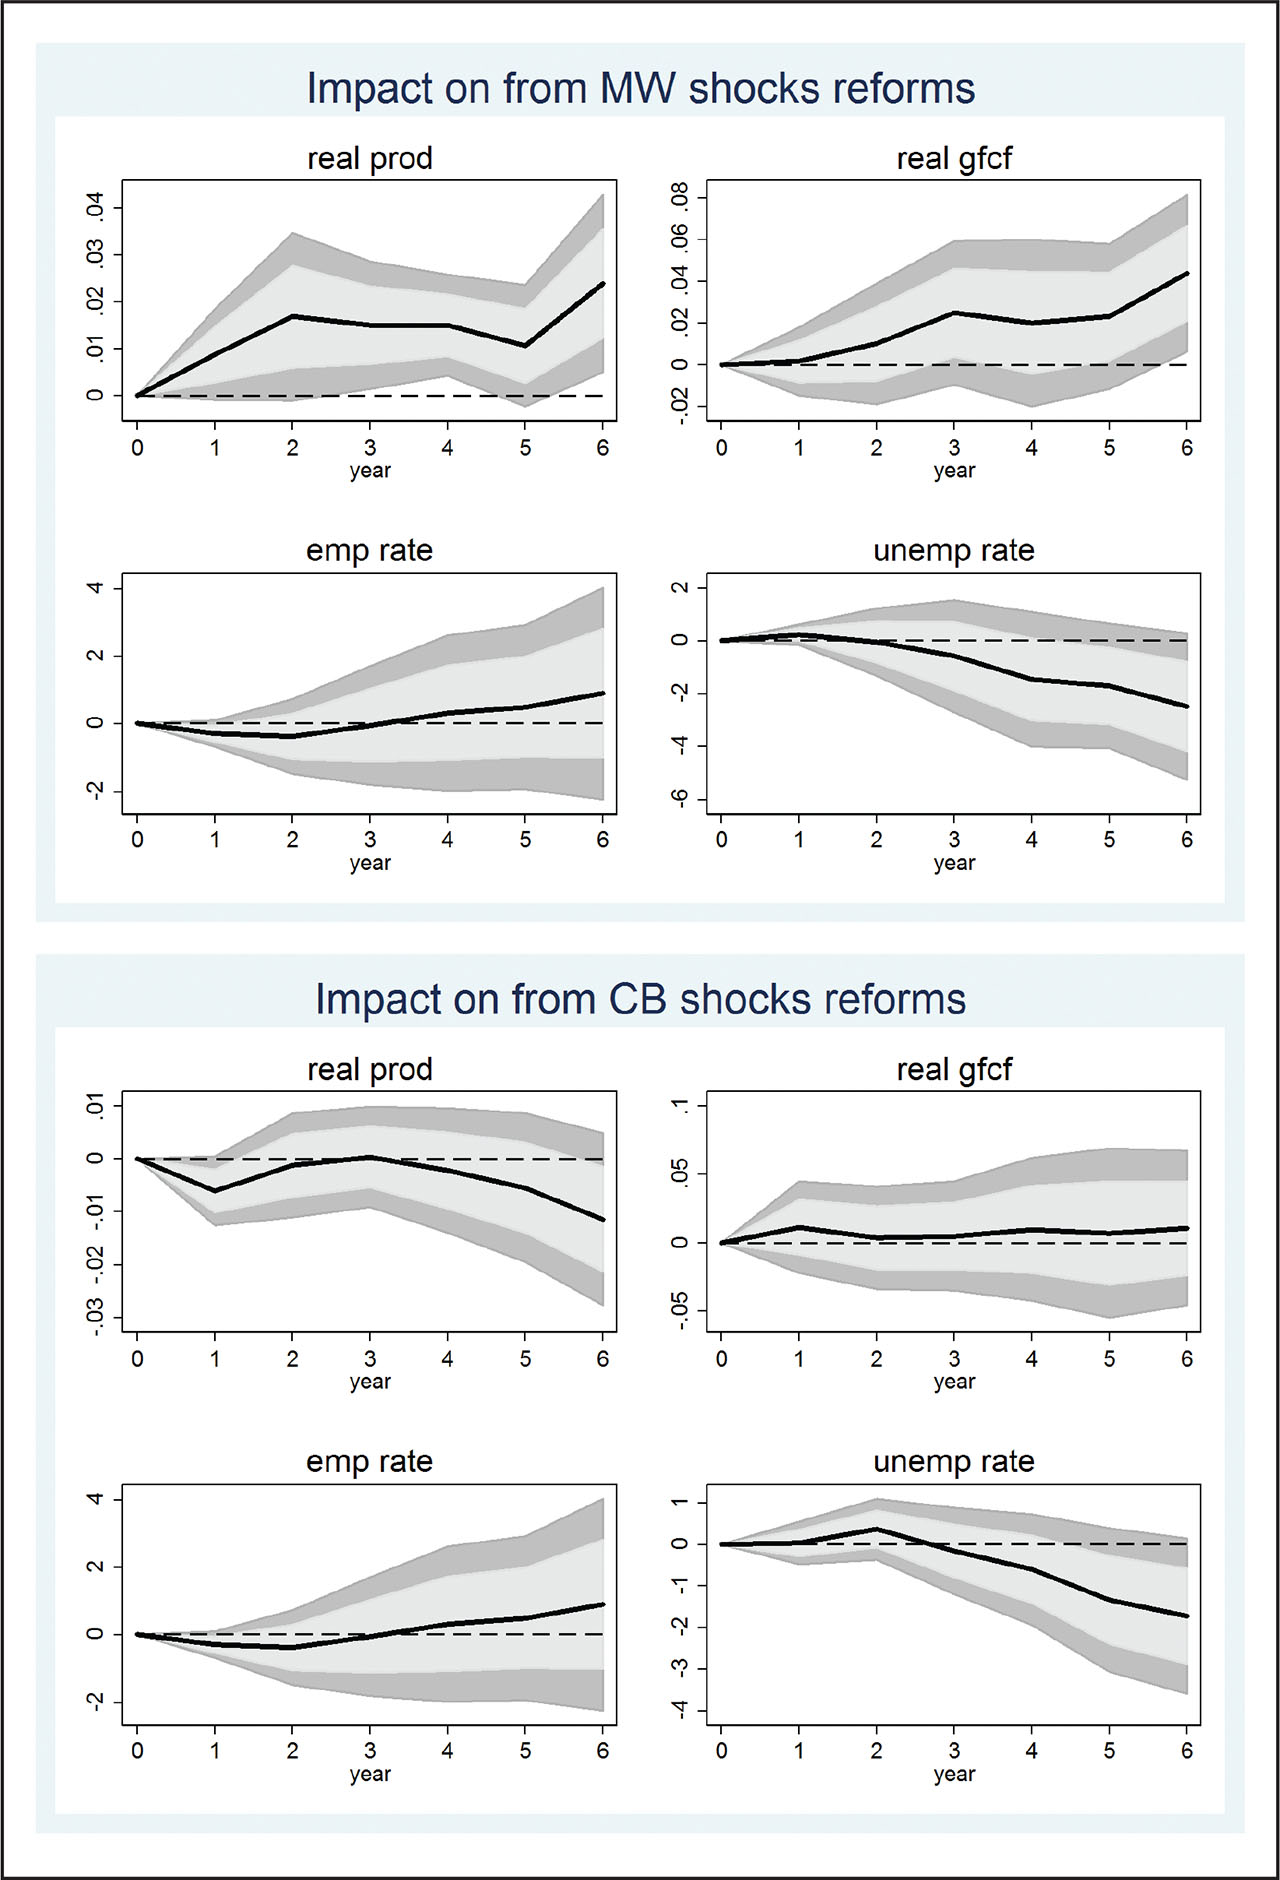
Figure A1
The Average Effect of Shocks on macroeconomic outcomes, controlling for shocks in all other areas (percent for real variables and pp for rates).
Note: The x-axis indicates the number of years; t = 0 is the year of the reform shock; and t = 1 is the first year of impact. The solid black lines denote the response to a reform shock, the dark grey area denotes 90% confidence bands, and the light gray area denotes 68% confidence bands, based on standard errors clustered at country level. CB, collective bargaining; MW, minimum wage.