
Figure 1
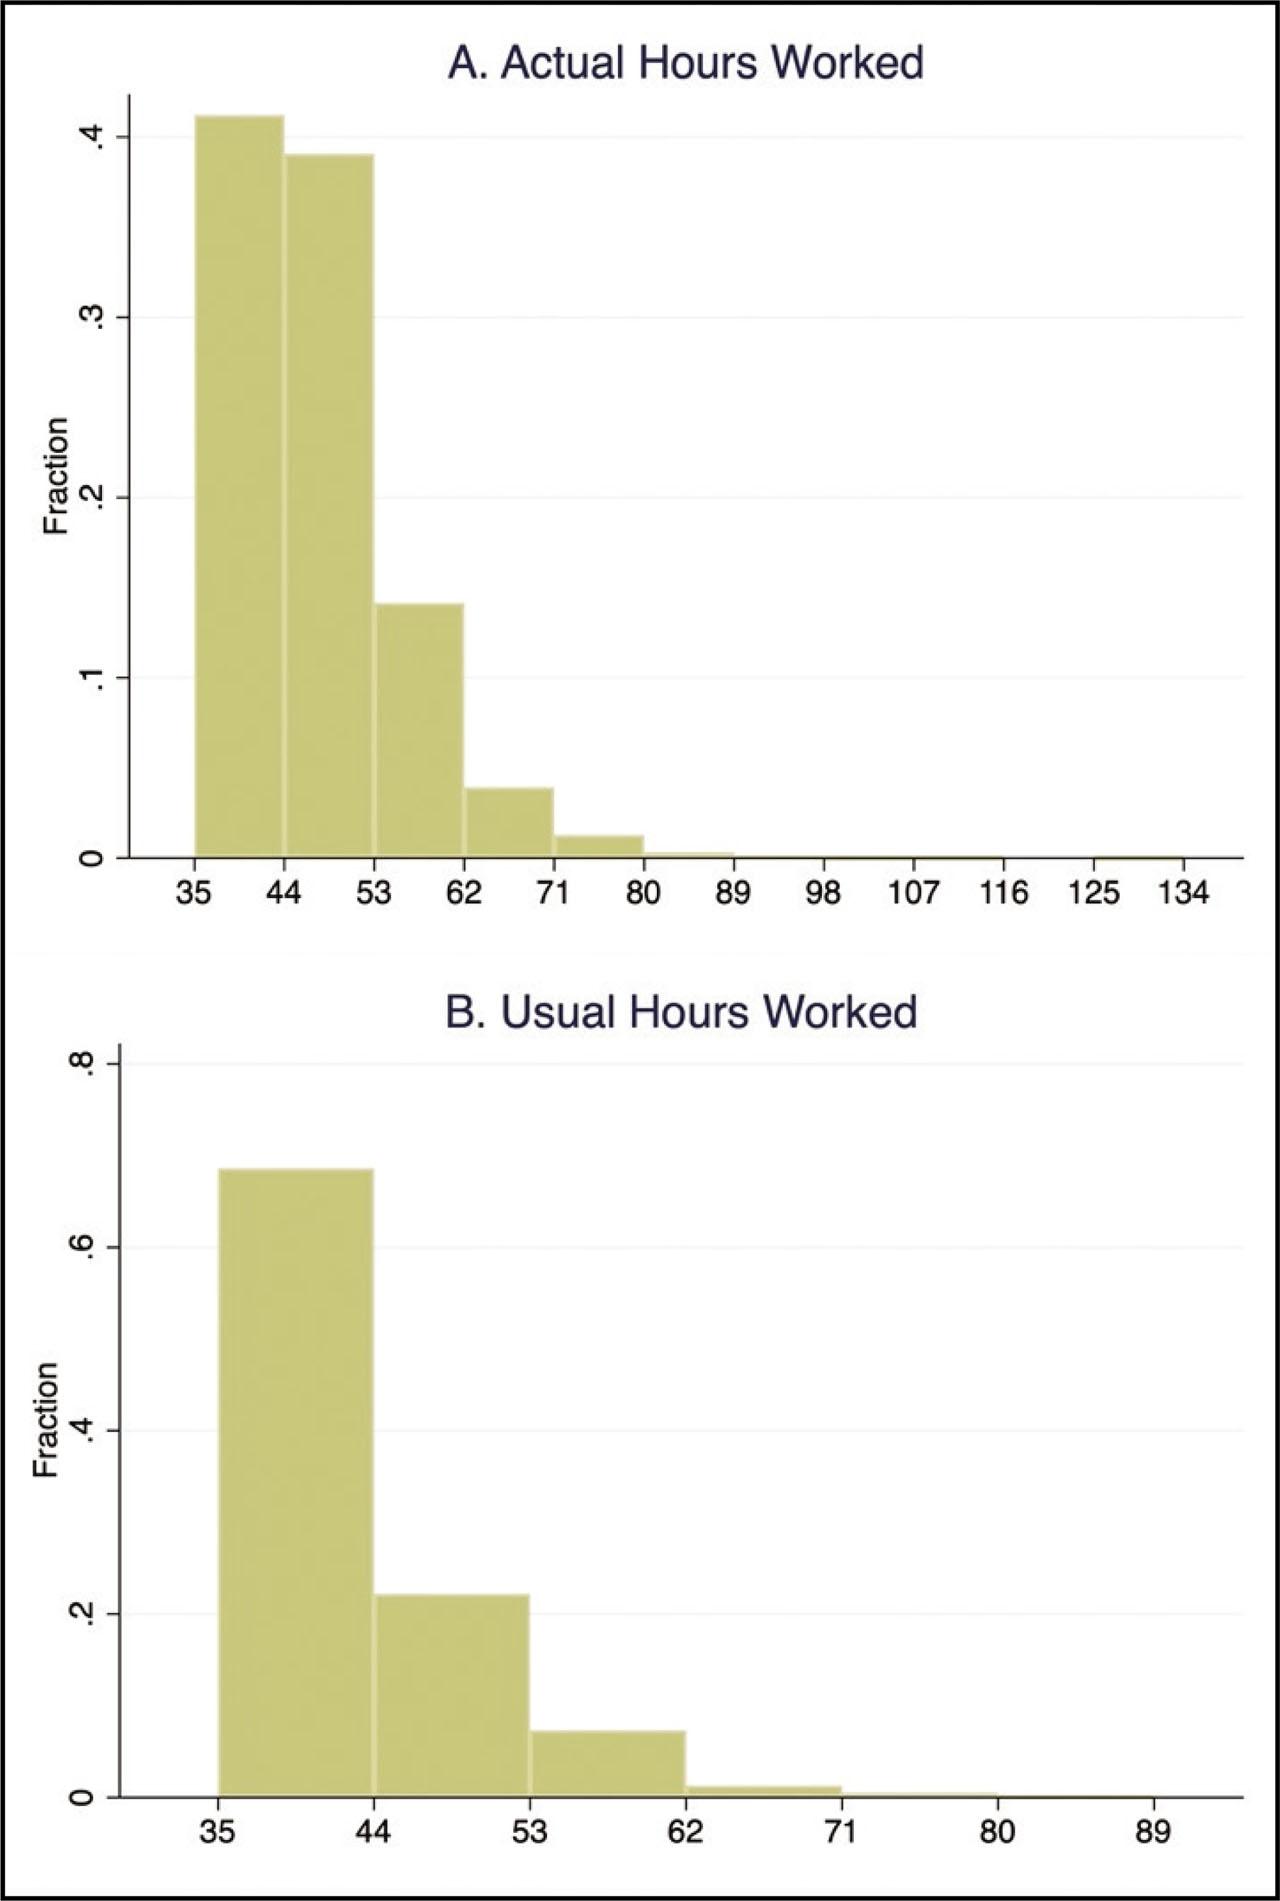
Figure 2
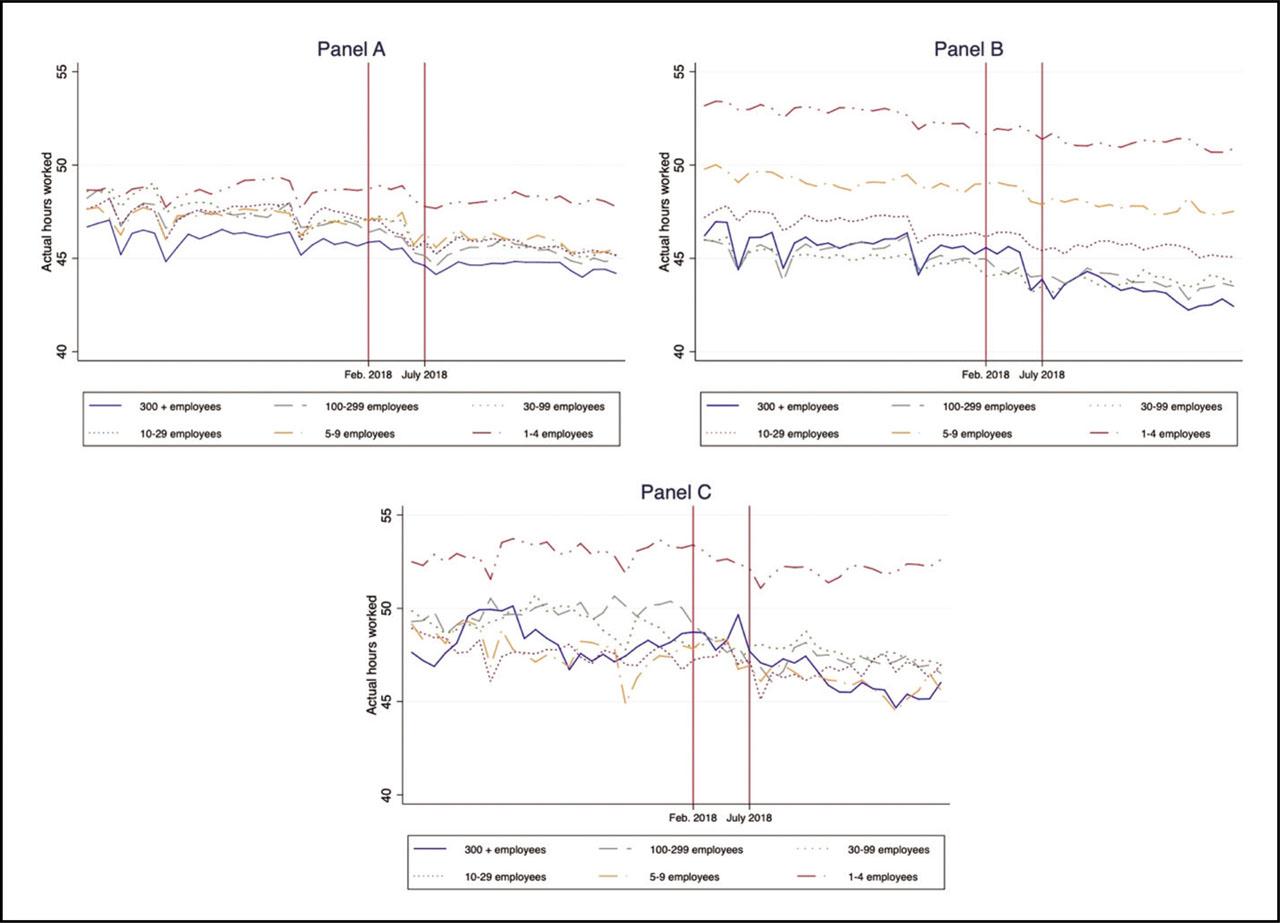
Figure 3
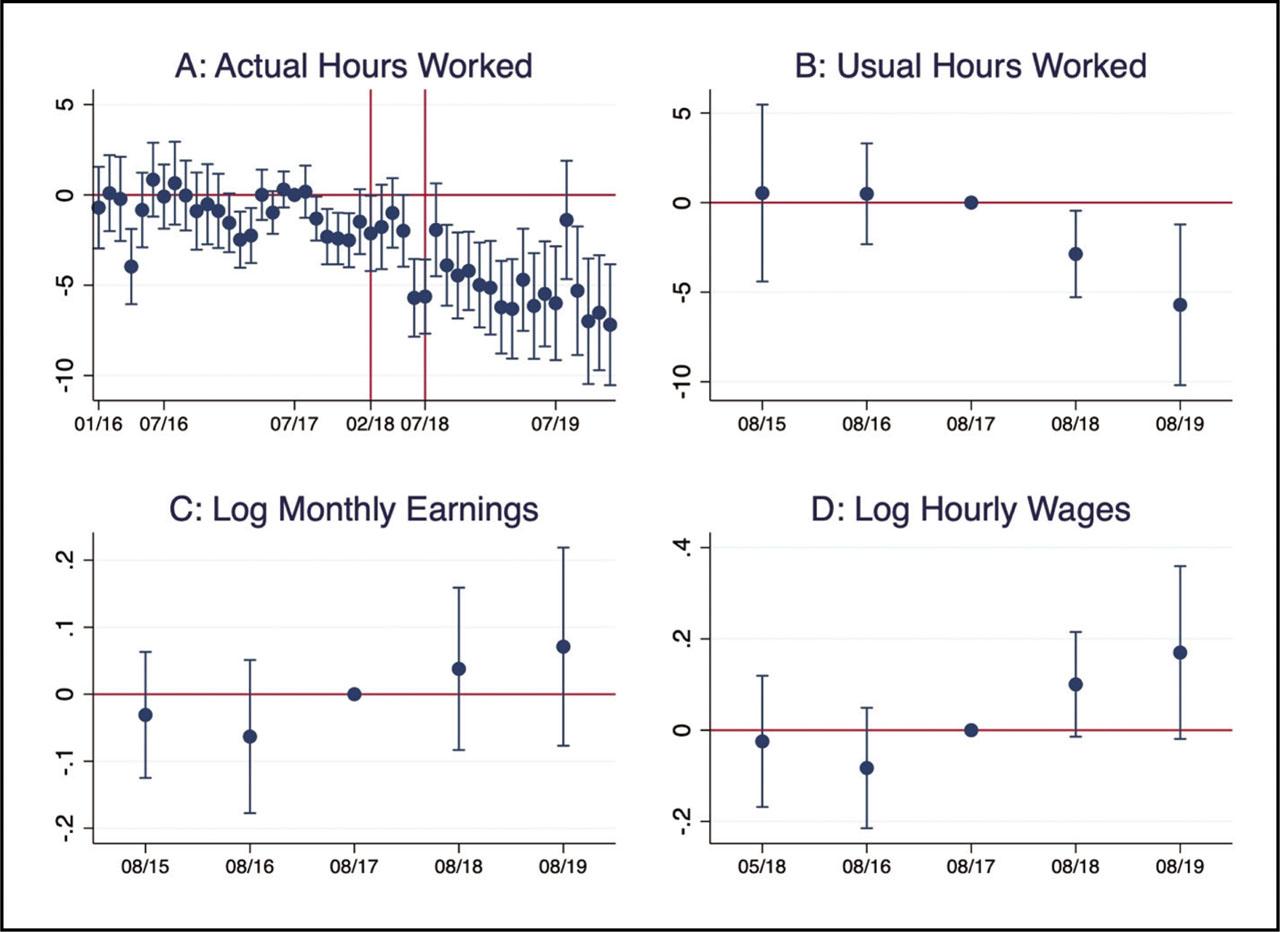
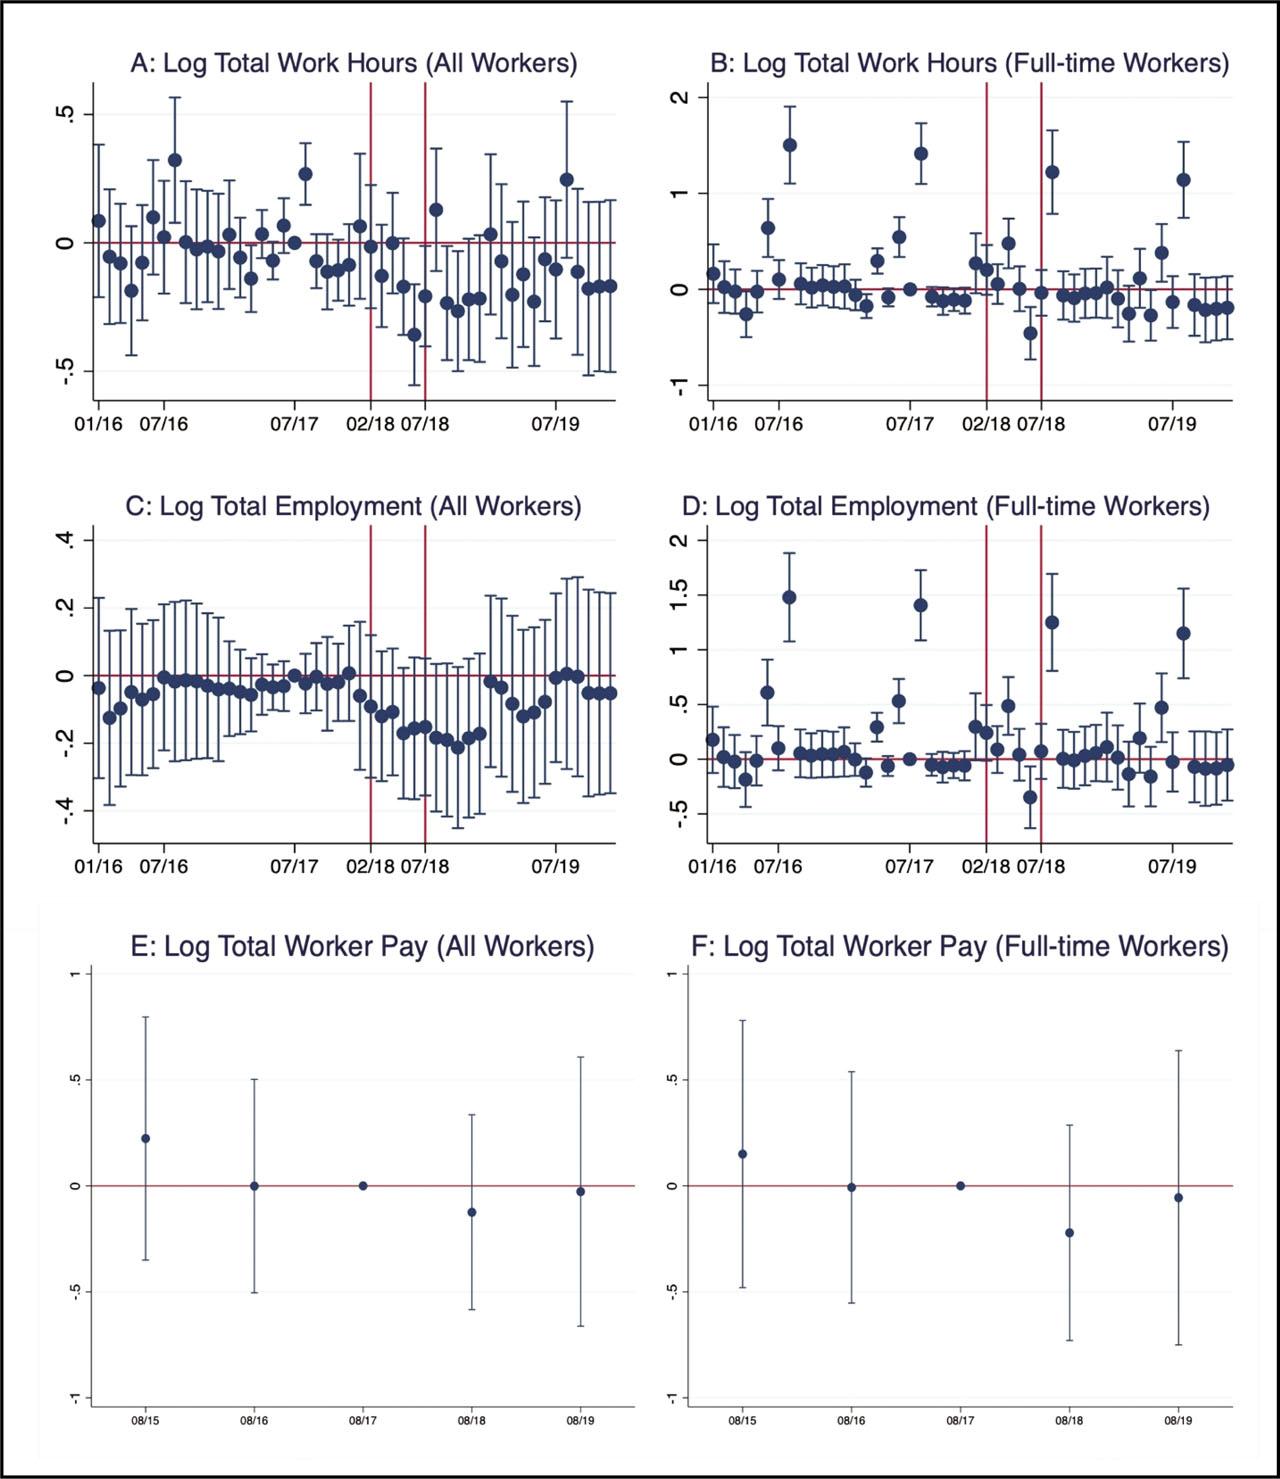
Figure 4
Individual-level estimation results
| (1) | (2) | (3) | (4) | (5) | (6) | (7) | |
|---|---|---|---|---|---|---|---|
| Actual hours | Usual hours | Log monthly earnings | Log hourly wages | Usual hours | Log monthly earnings | Log hourly wages | |
| Treatment effect | −4.242*** (1.233) | −4.334*** (0.987) | 0.068 (0.054) | 0.142** (0.061) | −4.566*** (0.973) | 0.085* (0.050) | 0.169*** (0.054) |
| Basic controls | X | X | X | X | X | X | X |
| Additional controls | X | X | X | ||||
| Observations | 288,521 | 33,802 | 33,802 | 33,802 | 33,024 | 33,024 | 33,024 |
| R-squared | 0.115 | 0.147 | 0.495 | 0.500 | 0.160 | 0.525 | 0.541 |
Pre-trend tests for individual-level outcomes
| (1) | (2) | (3) | (4) | (5) | (6) | (7) | |
|---|---|---|---|---|---|---|---|
| Actual hours | Usual hours | Log monthly earnings | Log hourly wages | Usual hours | Log monthly earnings | Log hourly wages | |
| Treatment effect | −1.092 (0.985) | −0.588 (1.742) | 0.038 (0.484) | 0.044 (0.061) | −0.513 (1.726) | 0.038 (0.470) | 0.045 (0.596) |
| Basic controls | X | X | X | X | X | X | X |
| Additional controls | X | X | X | ||||
| Observations | 146,583 | 20,699 | 20,699 | 20,699 | 20,699 | 20,699 | 20,699 |
| R-squared | 0.105 | 0.159 | 0.506 | 0.512 | 0.174 | 0.542 | 0.557 |
Summary statistics for policy intensity
| Min | 1st Quartile | 2nd Quartile | 3rd Quartile | Max | Mean | SD |
|---|---|---|---|---|---|---|
| 0.009 | 0.135 | 0.192 | 0.241 | 0.862 | 0.200 | 0.099 |
| Proportion of workers working >52 h | 19.63% | |||||
| Observations | 174,870 | |||||
Pre-trend tests for group-level outcomes
| A. All workers | ||||
|---|---|---|---|---|
| (1) | (2) | (3) | (4) | |
| Log total work hours | Log total employment | Log total worker pay | Log total worker pay | |
| Treatment effect | 0.006 (0.100) | 0.054 (0.099) | −0.026 0.275 | 0.064 (0.231) |
| Basic controls | X | X | X | X |
| Additional controls | X | |||
| R-squared | 0.183 | 0.081 | 0.306 | 0.448 |
Group-level estimation results
| A. All Workers | ||||
|---|---|---|---|---|
| (1) | (2) | (3) | (4) | |
| Log total work hours | Log total employment | Log total worker pay | Log total worker pay | |
| Treatment effect | −0.143 (0.107) | −0.083 (0.110) | −0.135 (0.261) | −0.137 (0.249) |
| Basic controls | X | X | X | X |
| Additional controls | X | |||
| R-squared | 0.187 | 0.077 | 0.267 | 0.320 |
Summary statistics
| Before | After | |||
|---|---|---|---|---|
| Mean | SD | Mean | SD | |
| A. Outcome variables for full-time workers | ||||
| Actual hours worked | 46.971 | 8.134 | 45.188 | 7.056 |
| Usual hours worked* | 43.450 | 6.401 | 43.246 | 5.857 |
| Monthly earnings (10,000 Won)* | 329.171 | 153.306 | 353.503 | 169.142 |
| Hourly wages (10,000 Won)* | 1.783 | 0.906 | 1.909 | 0.981 |
| B. Outcome variables for workers working >52 h/week | ||||
| Actual hours worked | 60.345 | 6.612 | 59.814 | 6.284 |
| Usual hours worked* | 59.894 | 5.627 | 59.436 | 5.453 |
| Monthly earnings (10,000 Won)* | 272.004 | 111.977 | 307.123 | 128.292 |
| Hourly wages (10,000 Won)* | 1.050 | 0.446 | 1.186 | 0.499 |
| C. Demographic characteristics | ||||
| Age | 40.050 | 8.358 | 40.149 | 8.393 |
| Marital status | ||||
| Single | 0.283 | 0.450 | 0.313 | 0.464 |
| Married | 0.683 | 0.465 | 0.655 | 0.476 |
| Widowed | 0.004 | 0.062 | 0.004 | 0.059 |
| Divorced | 0.030 | 0.171 | 0.029 | 0.167 |
| D. Job characteristics | ||||
| Fixed-term contract | 0.100 | 0.300 | 0.107 | 0.310 |
| Status in employment | ||||
| Regular workers | 0.844 | 0.363 | 0.859 | 0.348 |
| Temporary workers | 0.089 | 0.284 | 0.079 | 0.269 |
| Daily hired workers | 0.038 | 0.194 | 0.034 | 0.180 |
| Self-employed with employees | 0.029 | 0.169 | 0.028 | 0.166 |
| Self-employed without employees | 0.000 | 0.004 | 0.000 | 0.002 |
| Unpaid family workers | 0.000 | 0.015 | 0.000 | 0.020 |
| Establishment size | ||||
| 5–9 employees | 0.187 | 0.390 | 0.183 | 0.386 |
| 10–29 employees | 0.246 | 0.430 | 0.249 | 0.433 |
| 30–99 employees | 0.221 | 0.415 | 0.216 | 0.411 |
| 100–299 employees | 0.137 | 0.343 | 0.137 | 0.344 |
| 300+ employees | 0.211 | 0.408 | 0.215 | 0.411 |
| E. Additional job characteristics* | ||||
| Special type of employment | 0.012 | 0.107 | 0.010 | 0.097 |
| Flexible work hours | 0.064 | 0.245 | 0.152 | 0.359 |
| Employer-sponsored pension | 0.897 | 0.304 | 0.913 | 0.282 |
| Employer-sponsored health care | 0.900 | 0.300 | 0.914 | 0.280 |
| Employment insurance | 0.794 | 0.404 | 0.842 | 0.365 |
| Severance pay | 0.890 | 0.313 | 0.906 | 0.292 |
| Bonus | 0.873 | 0.332 | 0.859 | 0.348 |
| Overtime pay | 0.670 | 0.470 | 0.669 | 0.471 |
| Paid vacation | 0.810 | 0.393 | 0.827 | 0.378 |
| Training | 0.681 | 0.466 | 0.675 | 0.468 |
| Salary form | ||||
| Monthly | 0.593 | 0.491 | 0.580 | 0.494 |
| Annually | 0.303 | 0.459 | 0.320 | 0.467 |
| Others | 0.104 | 0.305 | 0.100 | 0.300 |
| Union | ||||
| No union | 0.656 | 0.475 | 0.660 | 0.474 |
| Not eligible for union | 0.076 | 0.265 | 0.077 | 0.266 |
| Eligible but did not join union | 0.078 | 0.268 | 0.082 | 0.275 |
| Union member | 0.190 | 0.392 | 0.181 | 0.385 |
| Observations for all male full-time workers | 174,870 | 113,651 | ||
| Observations for male workers working >52 h/week | 34,322 | 14,212 | ||
| Observations for all male full-time workers* | 20,699 | 13,103 | ||
| Observations for male workers working >52 h/week* | 1,914 | 901 | ||