
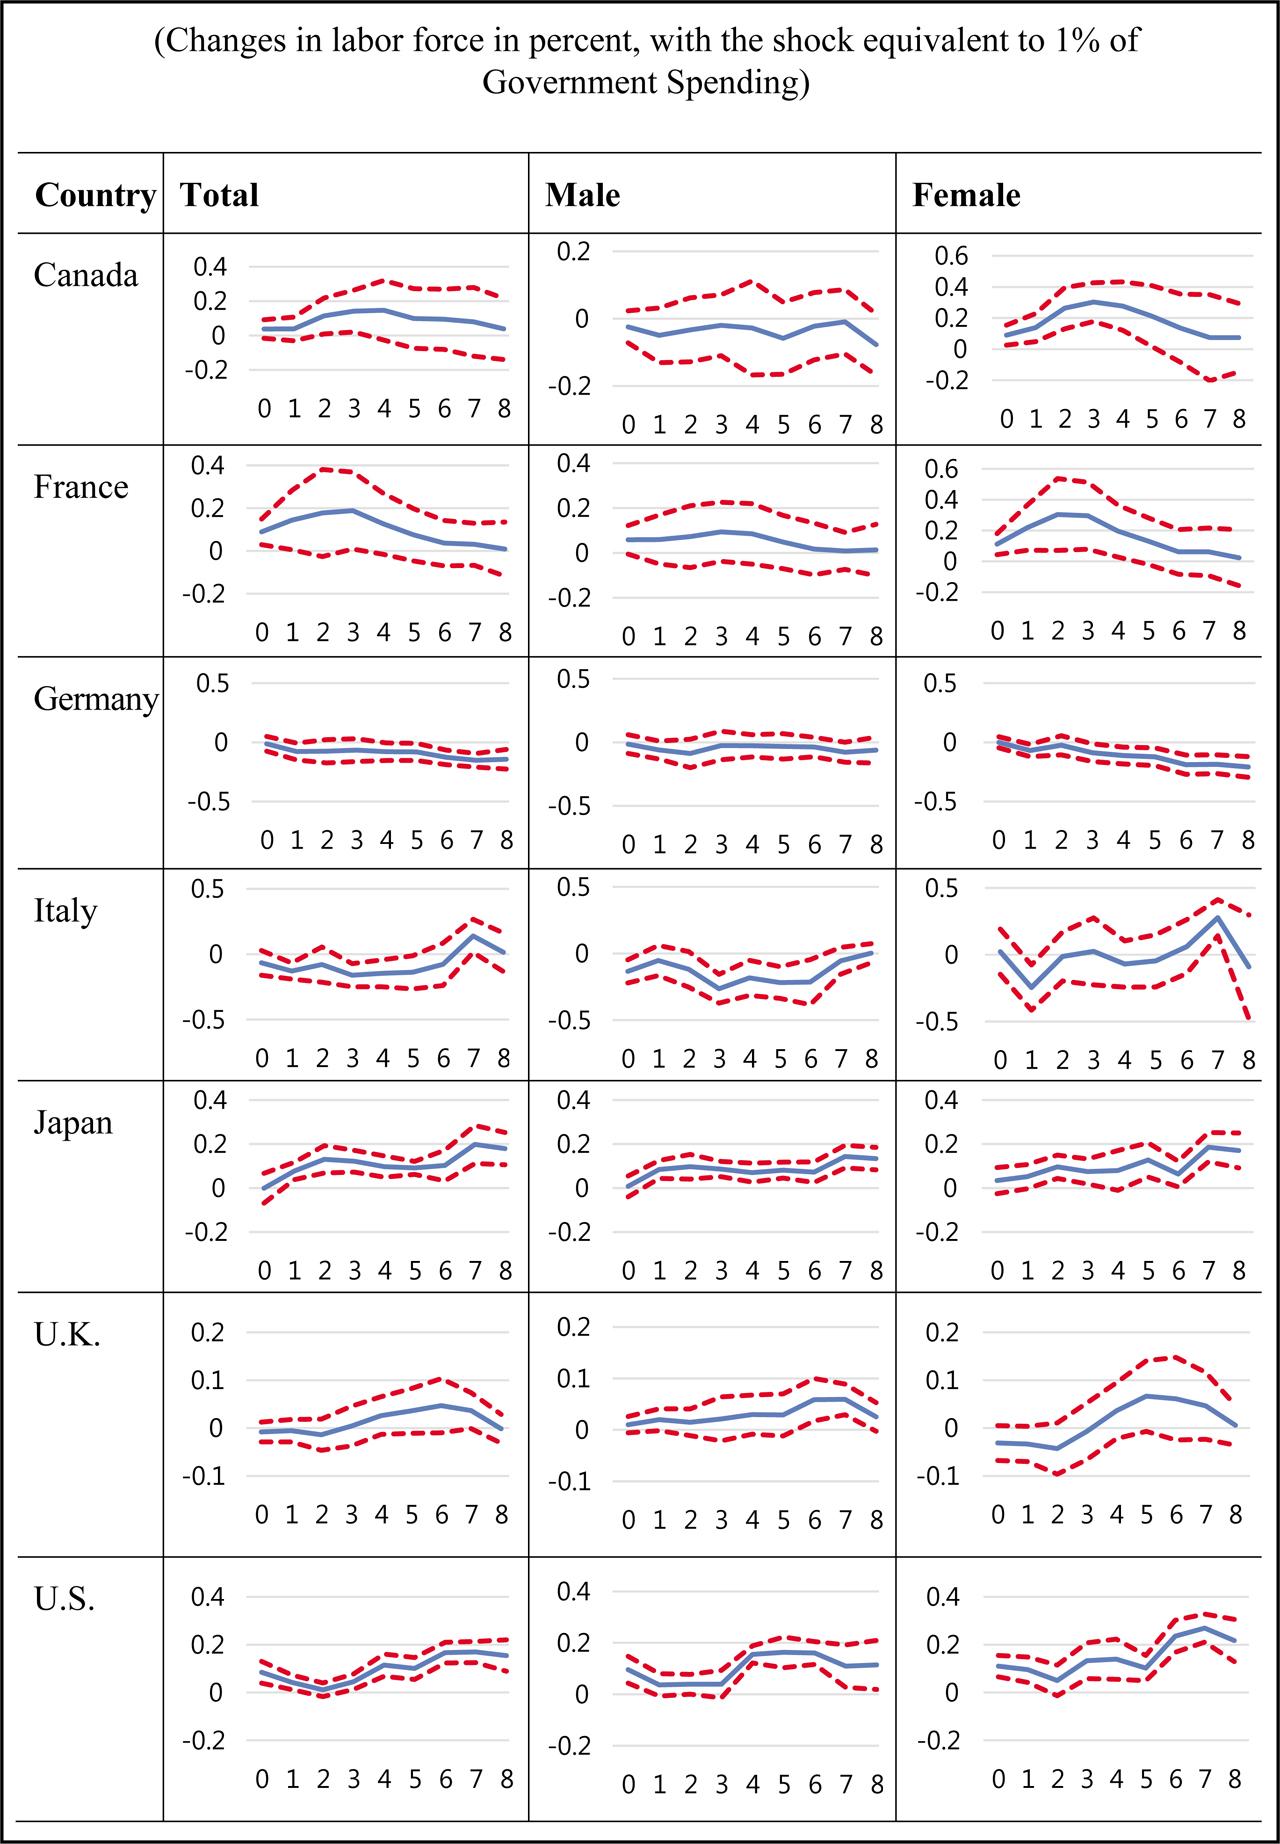
Figure 1
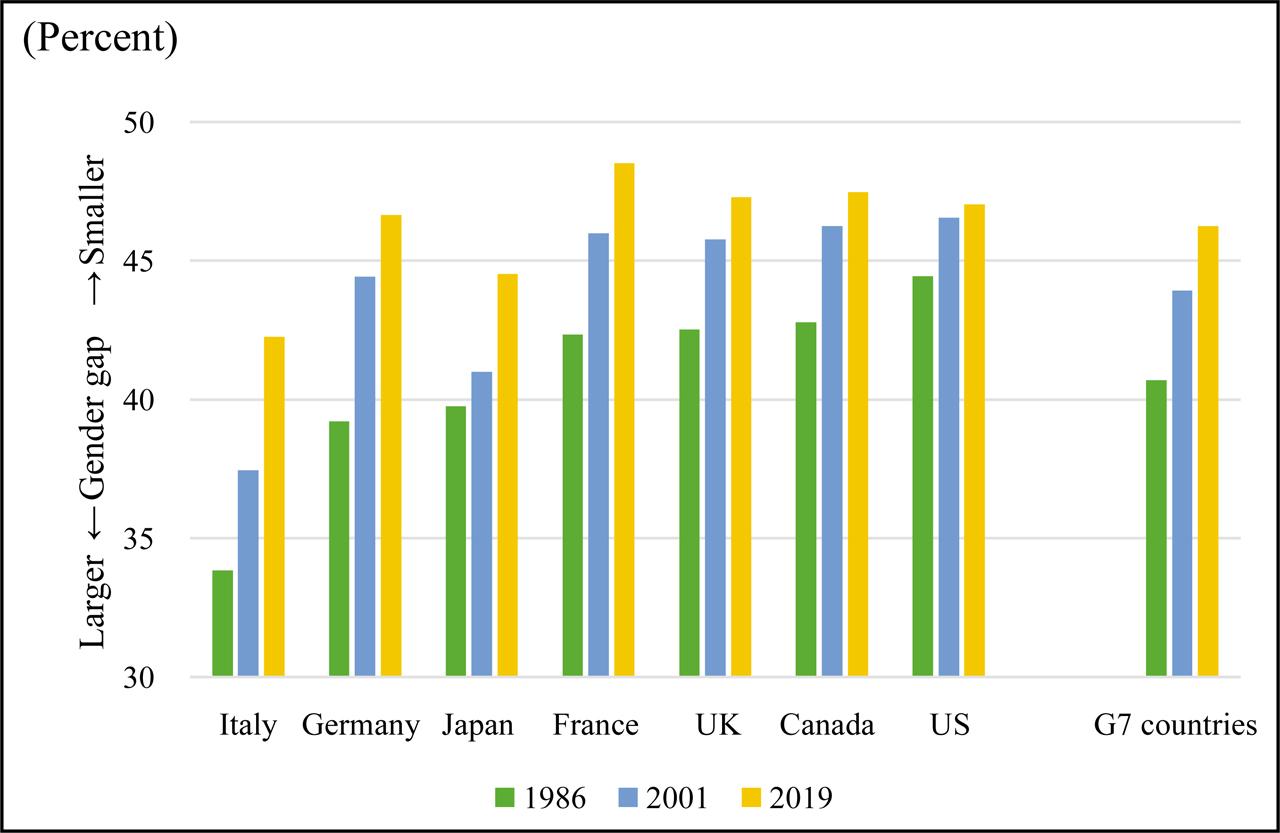
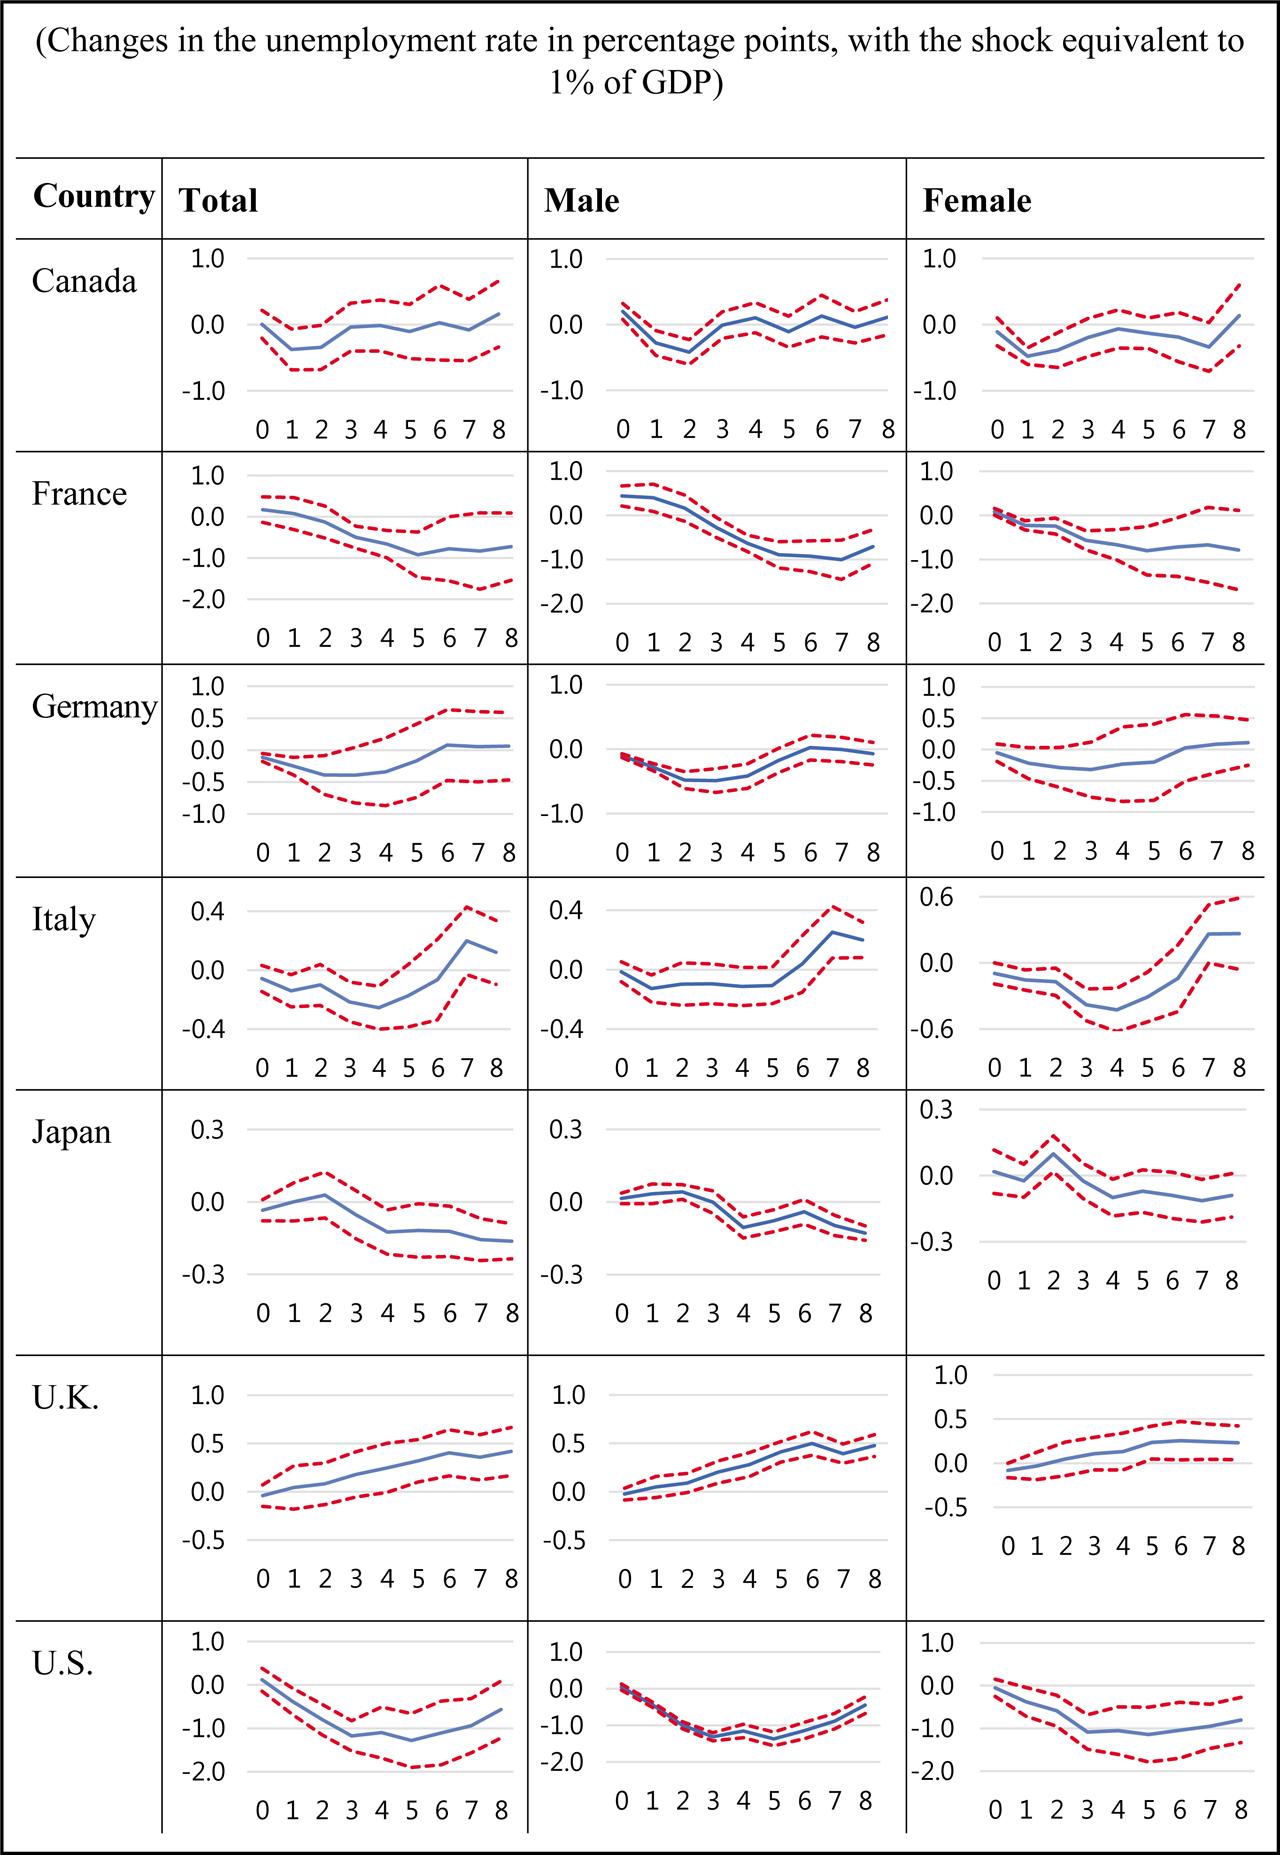
Figure 2
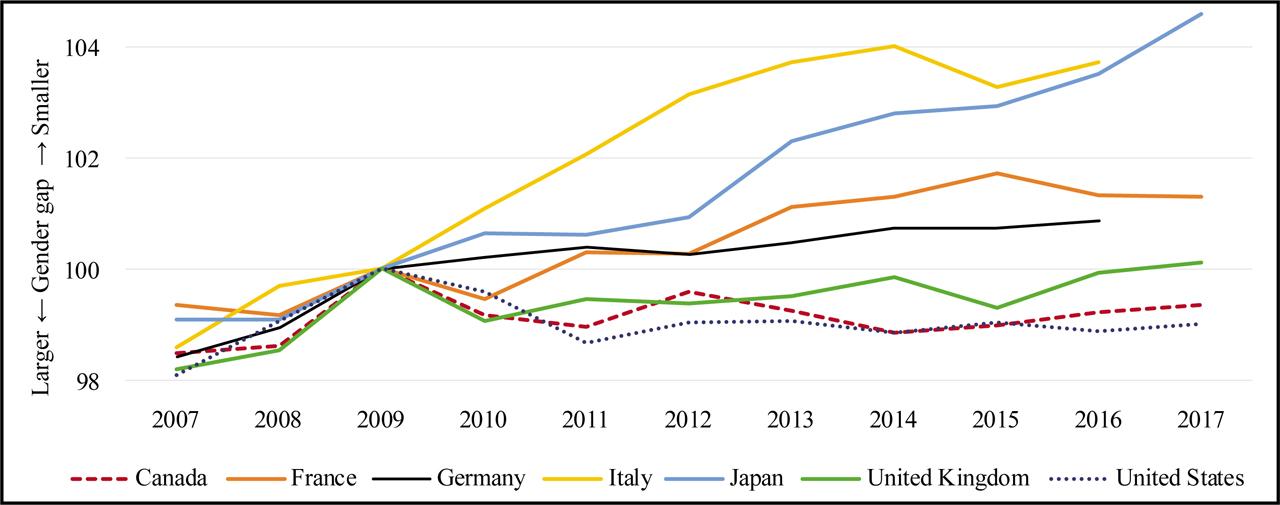
Figure 3
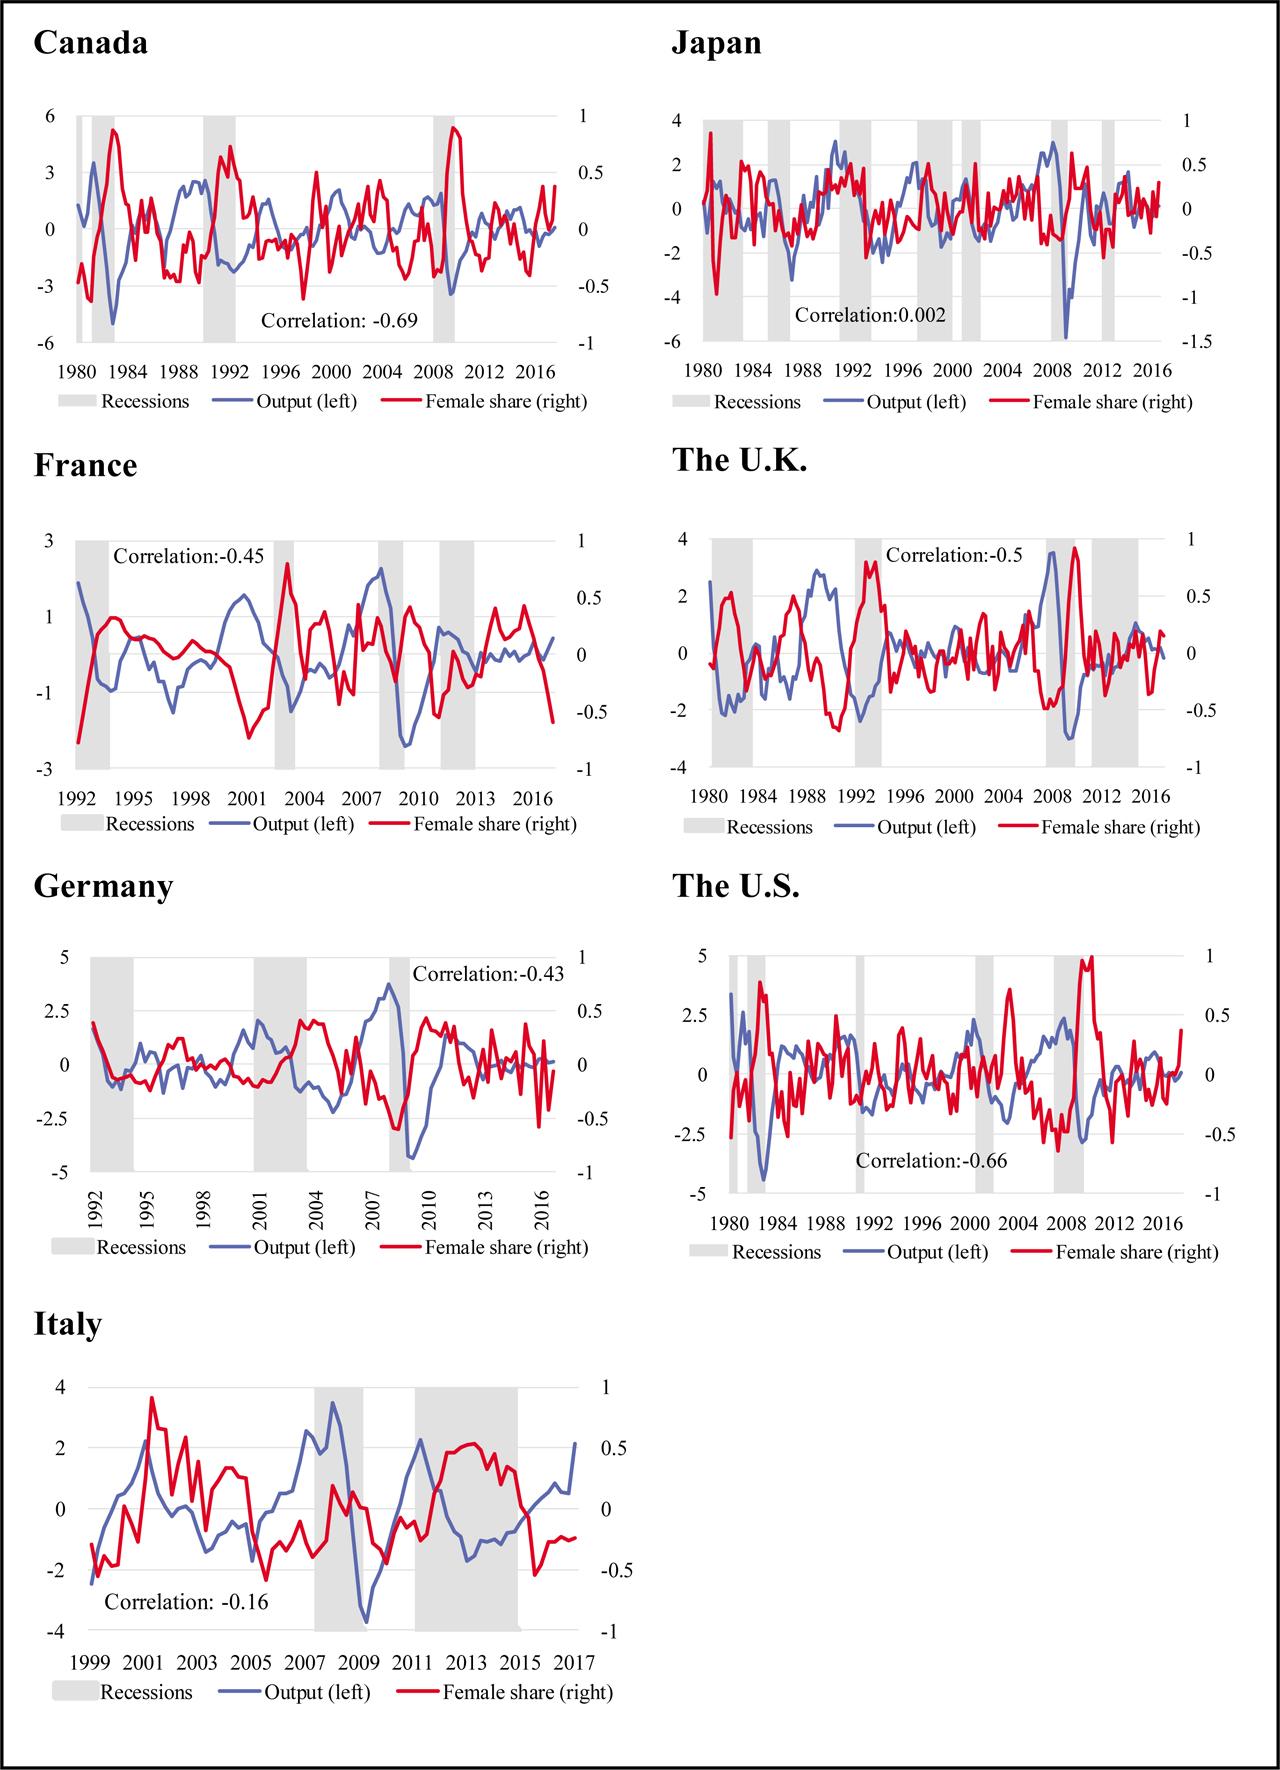
Figure 4
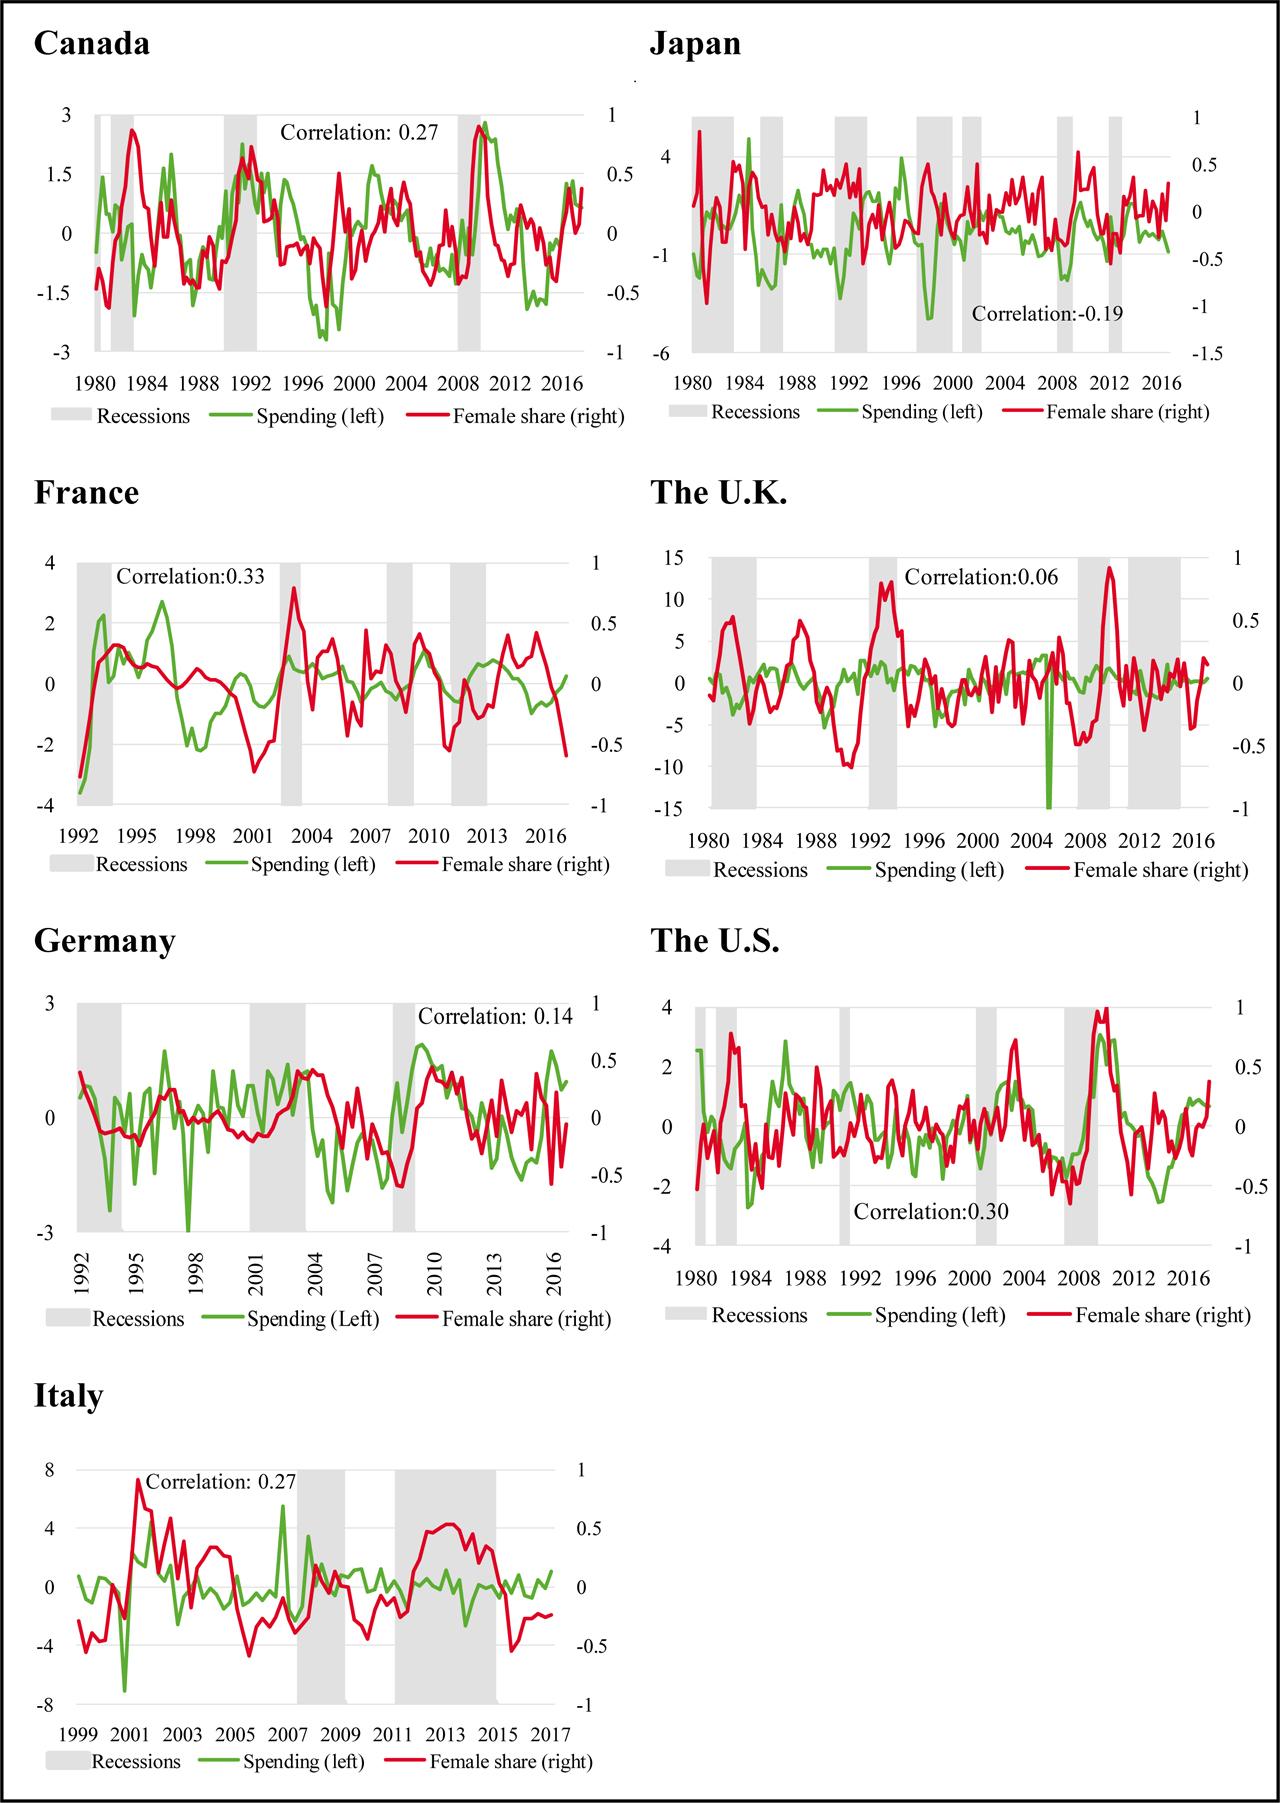
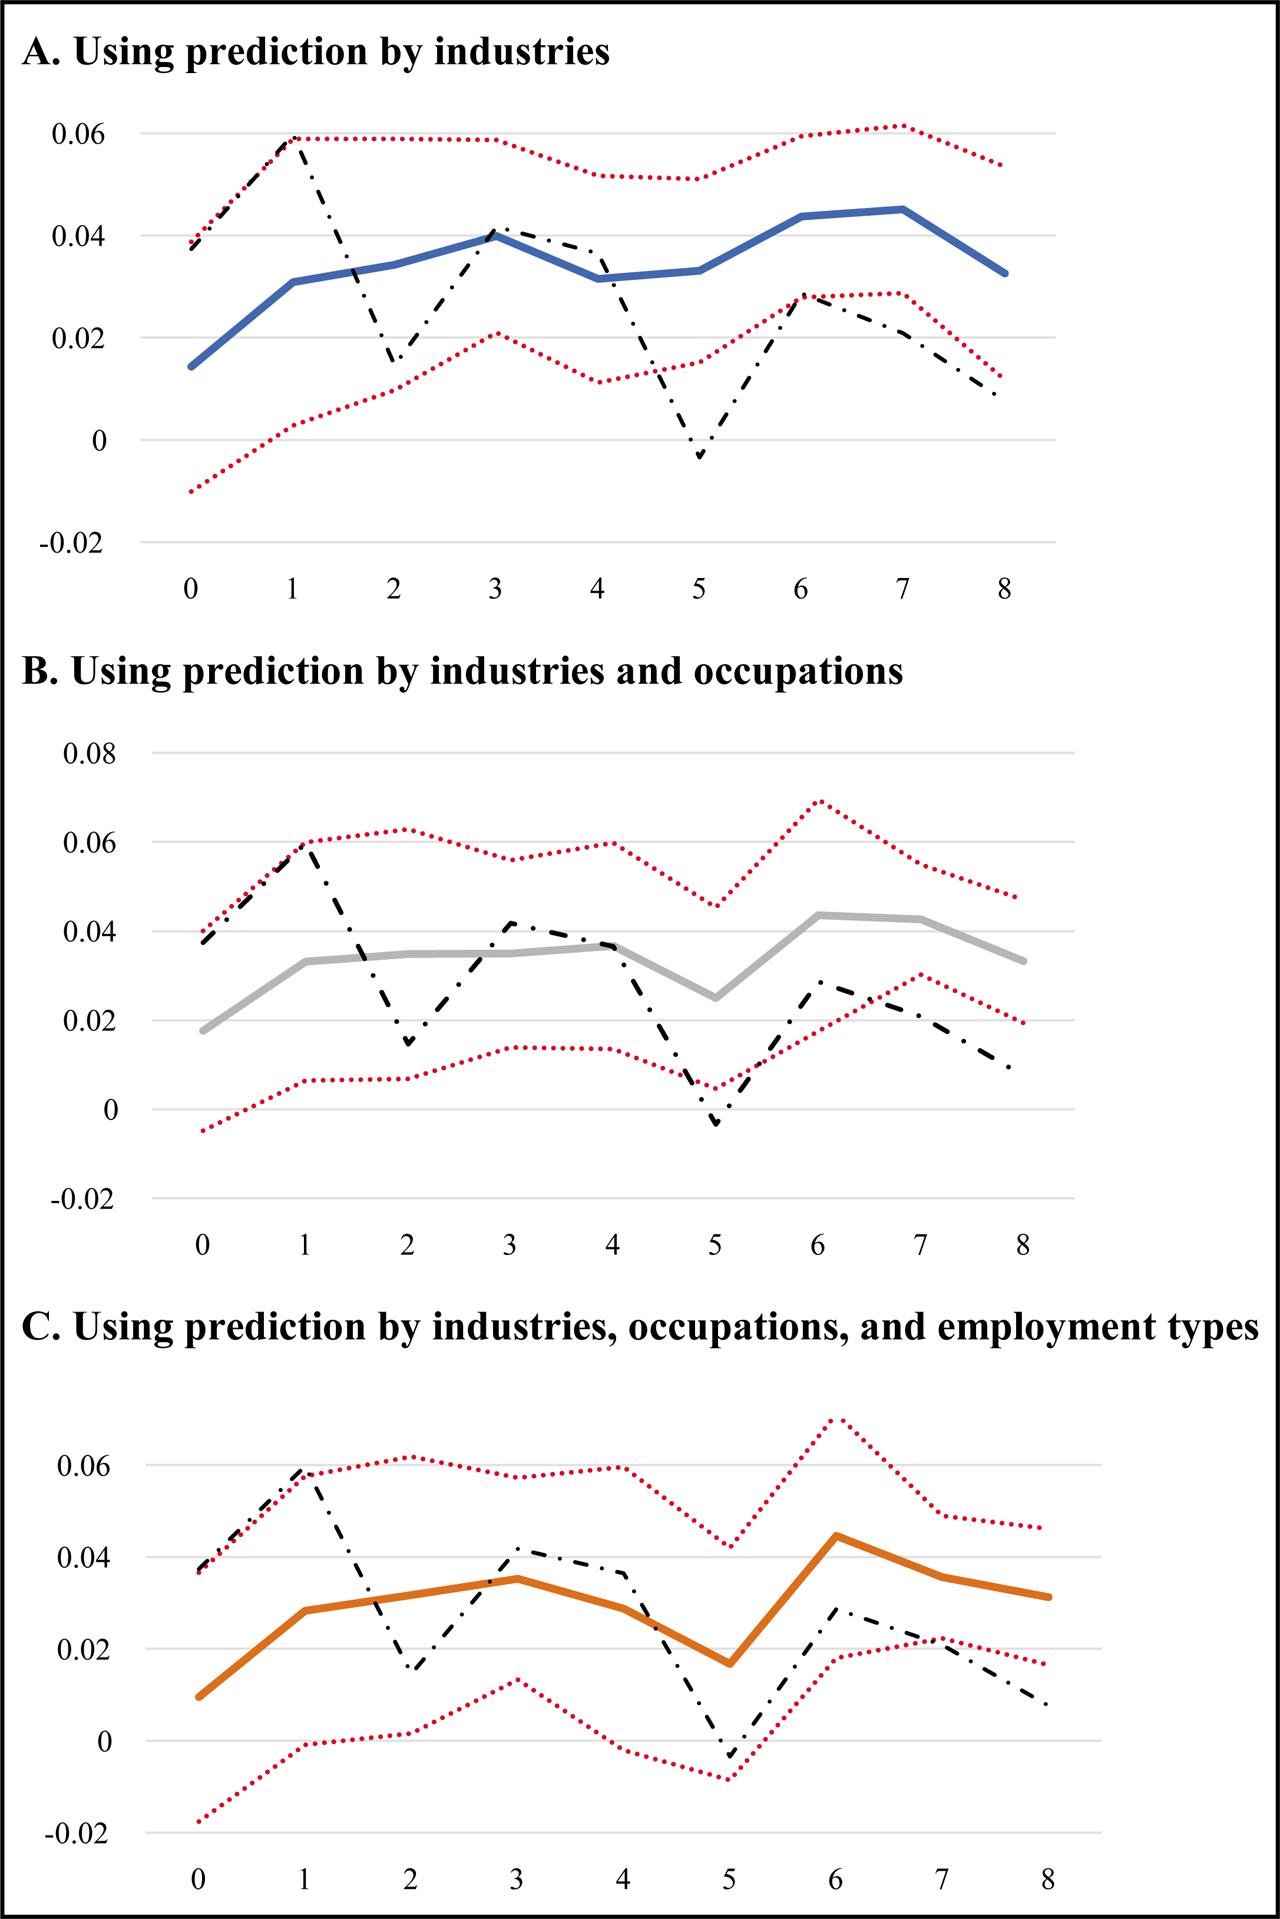
Figure 5
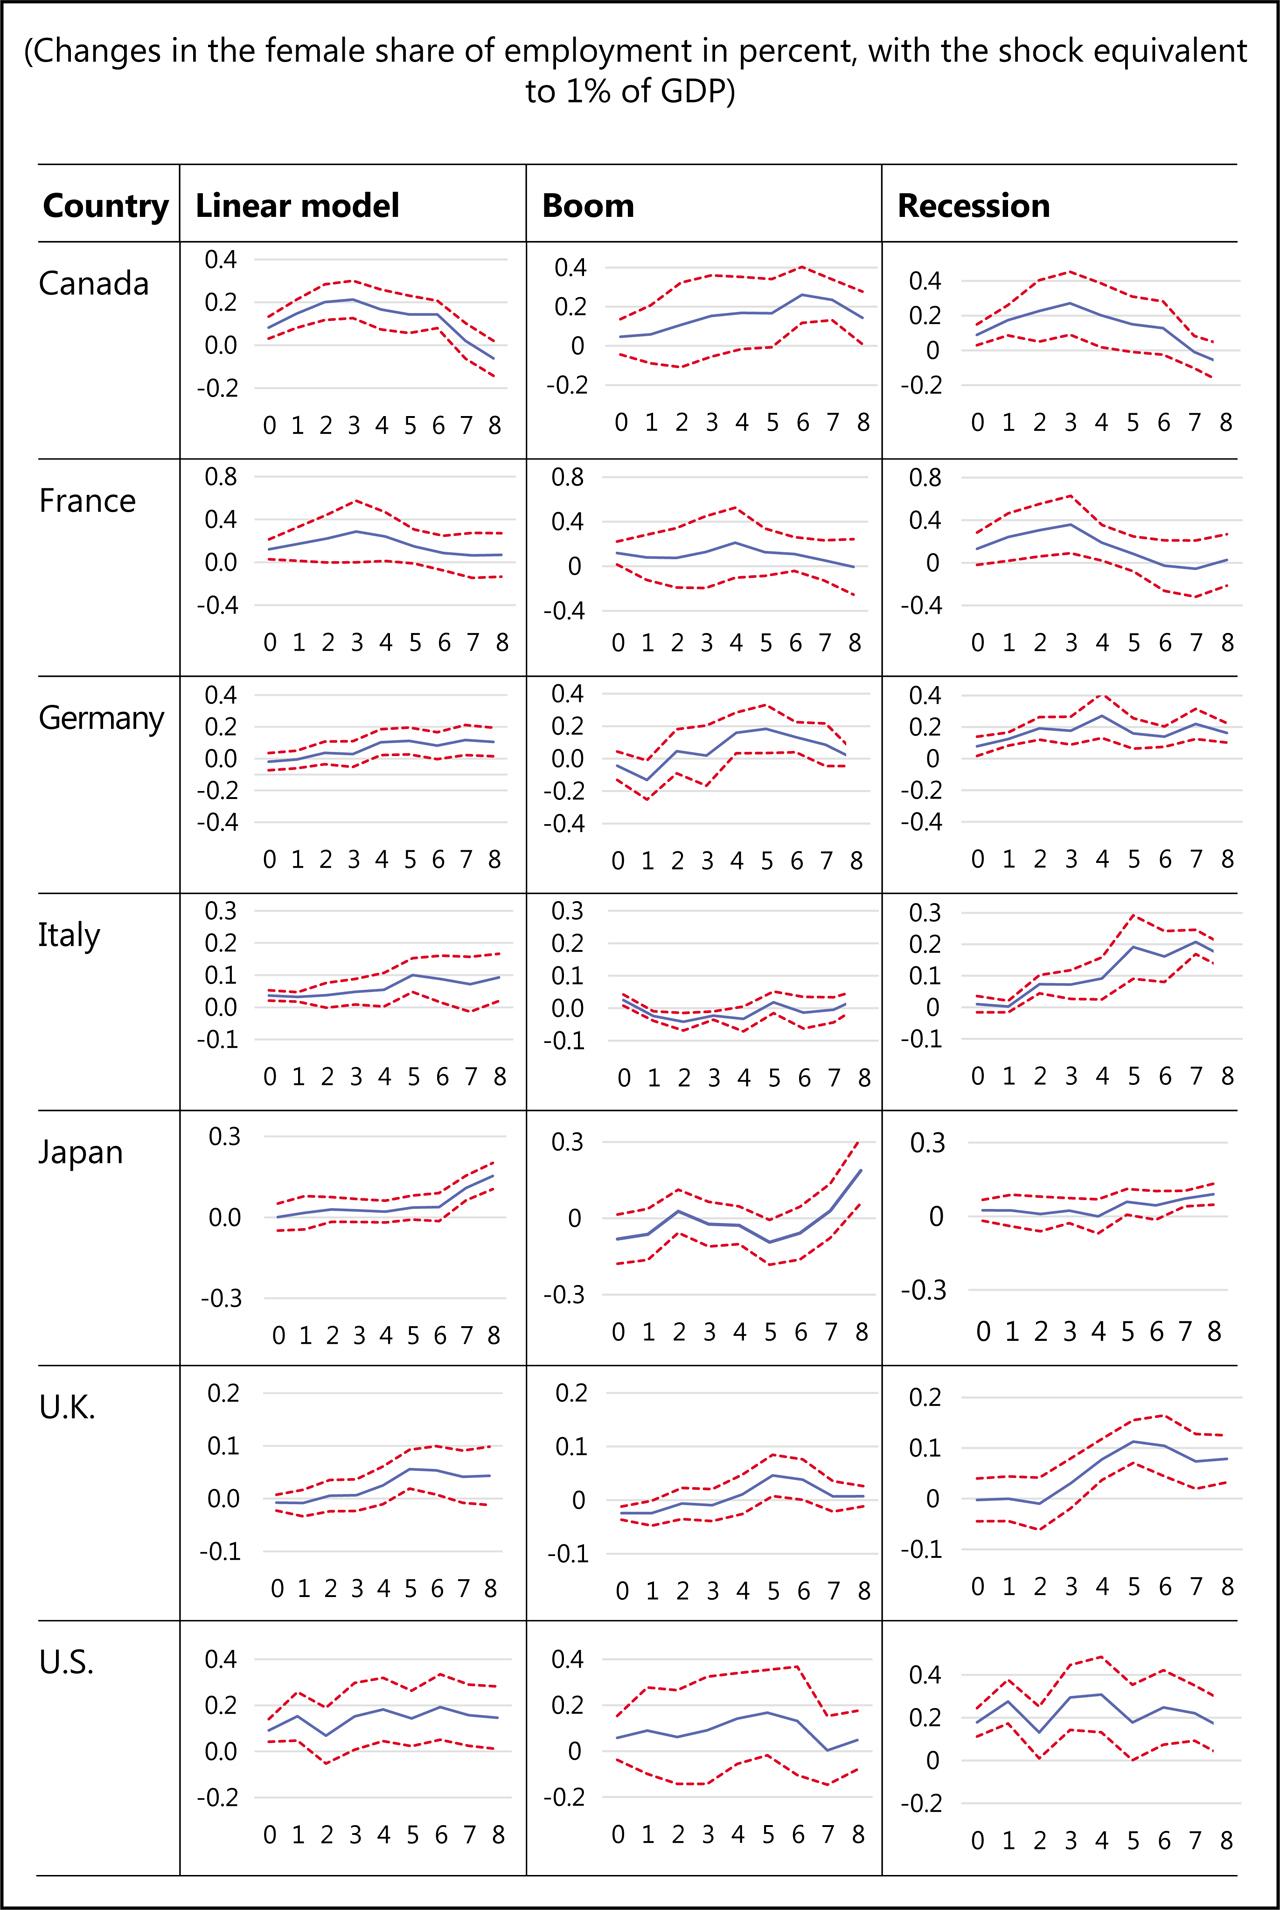
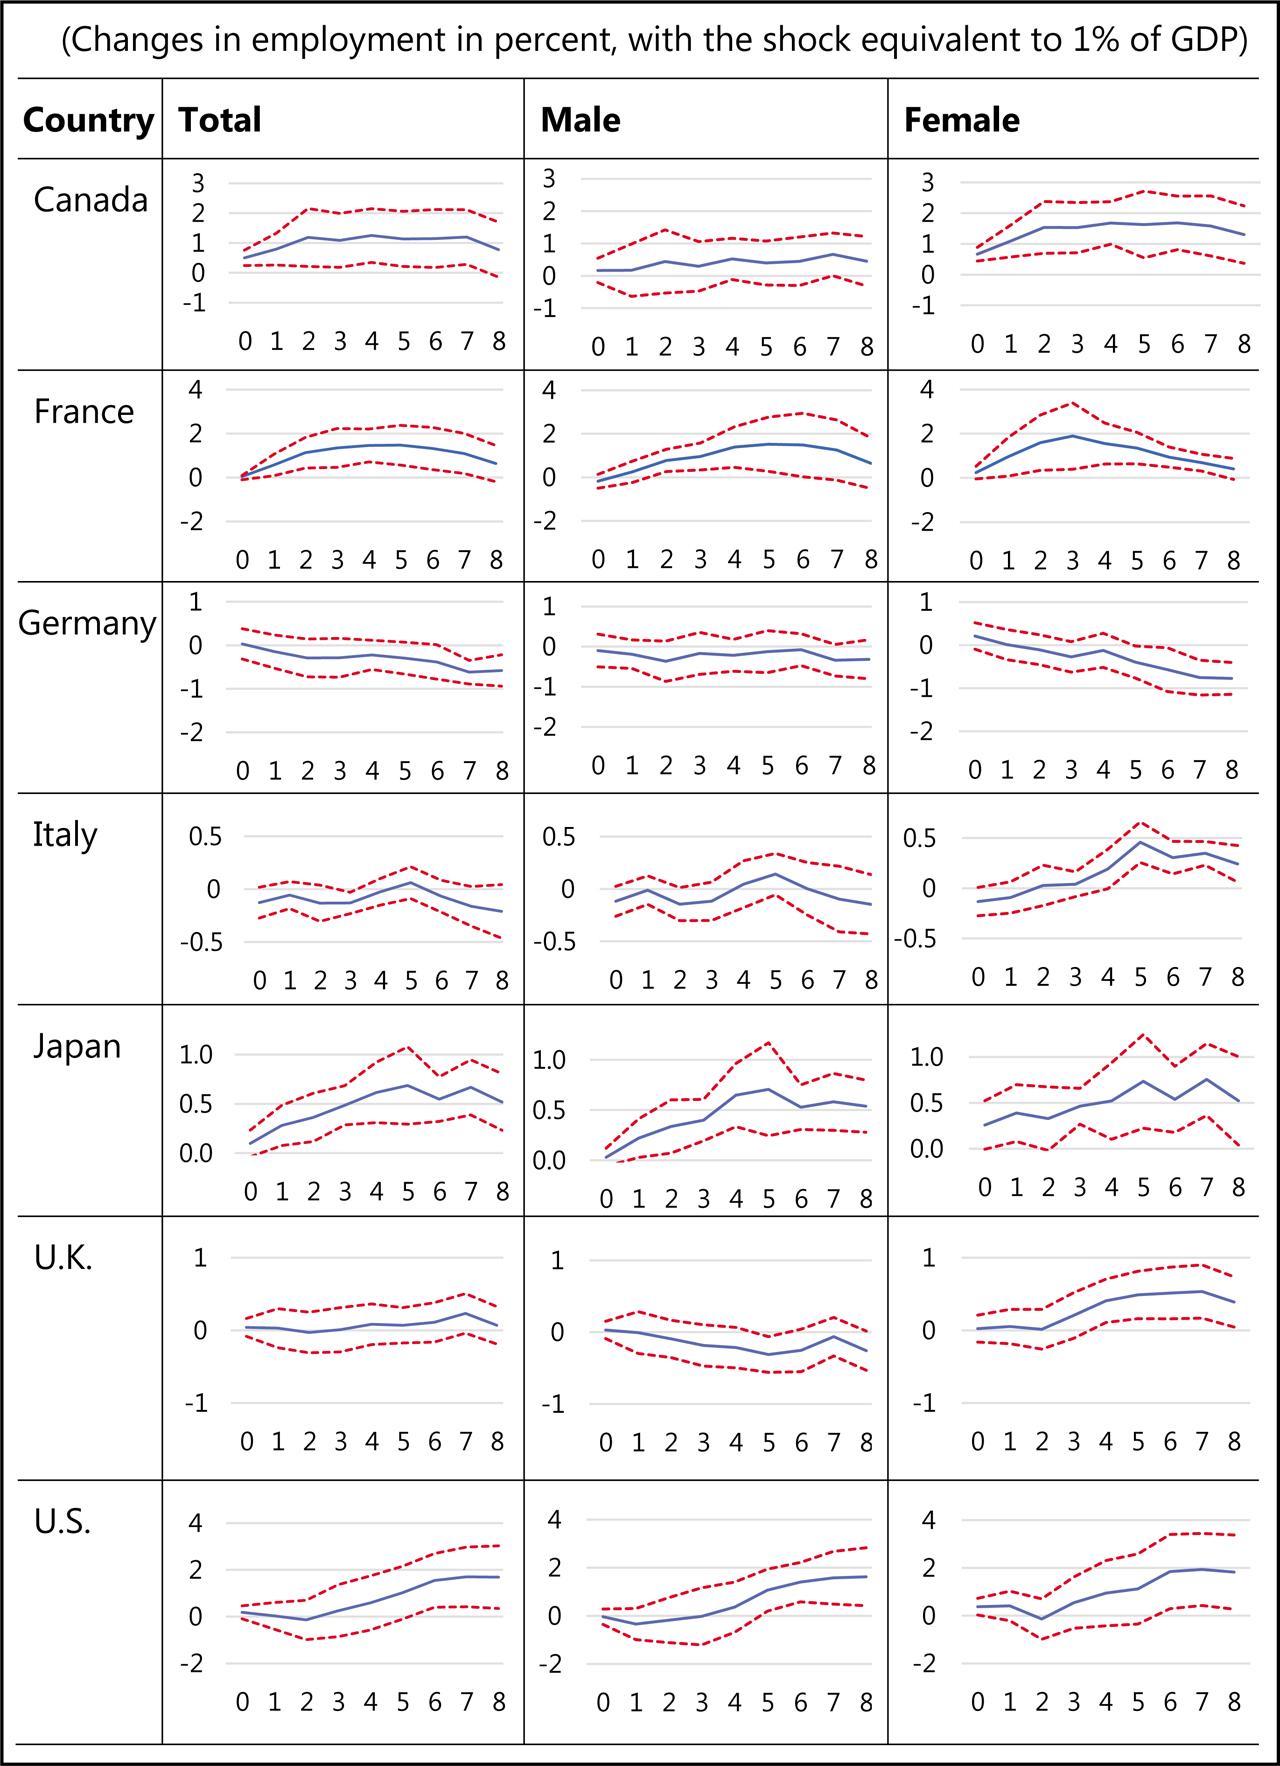
Figure 6
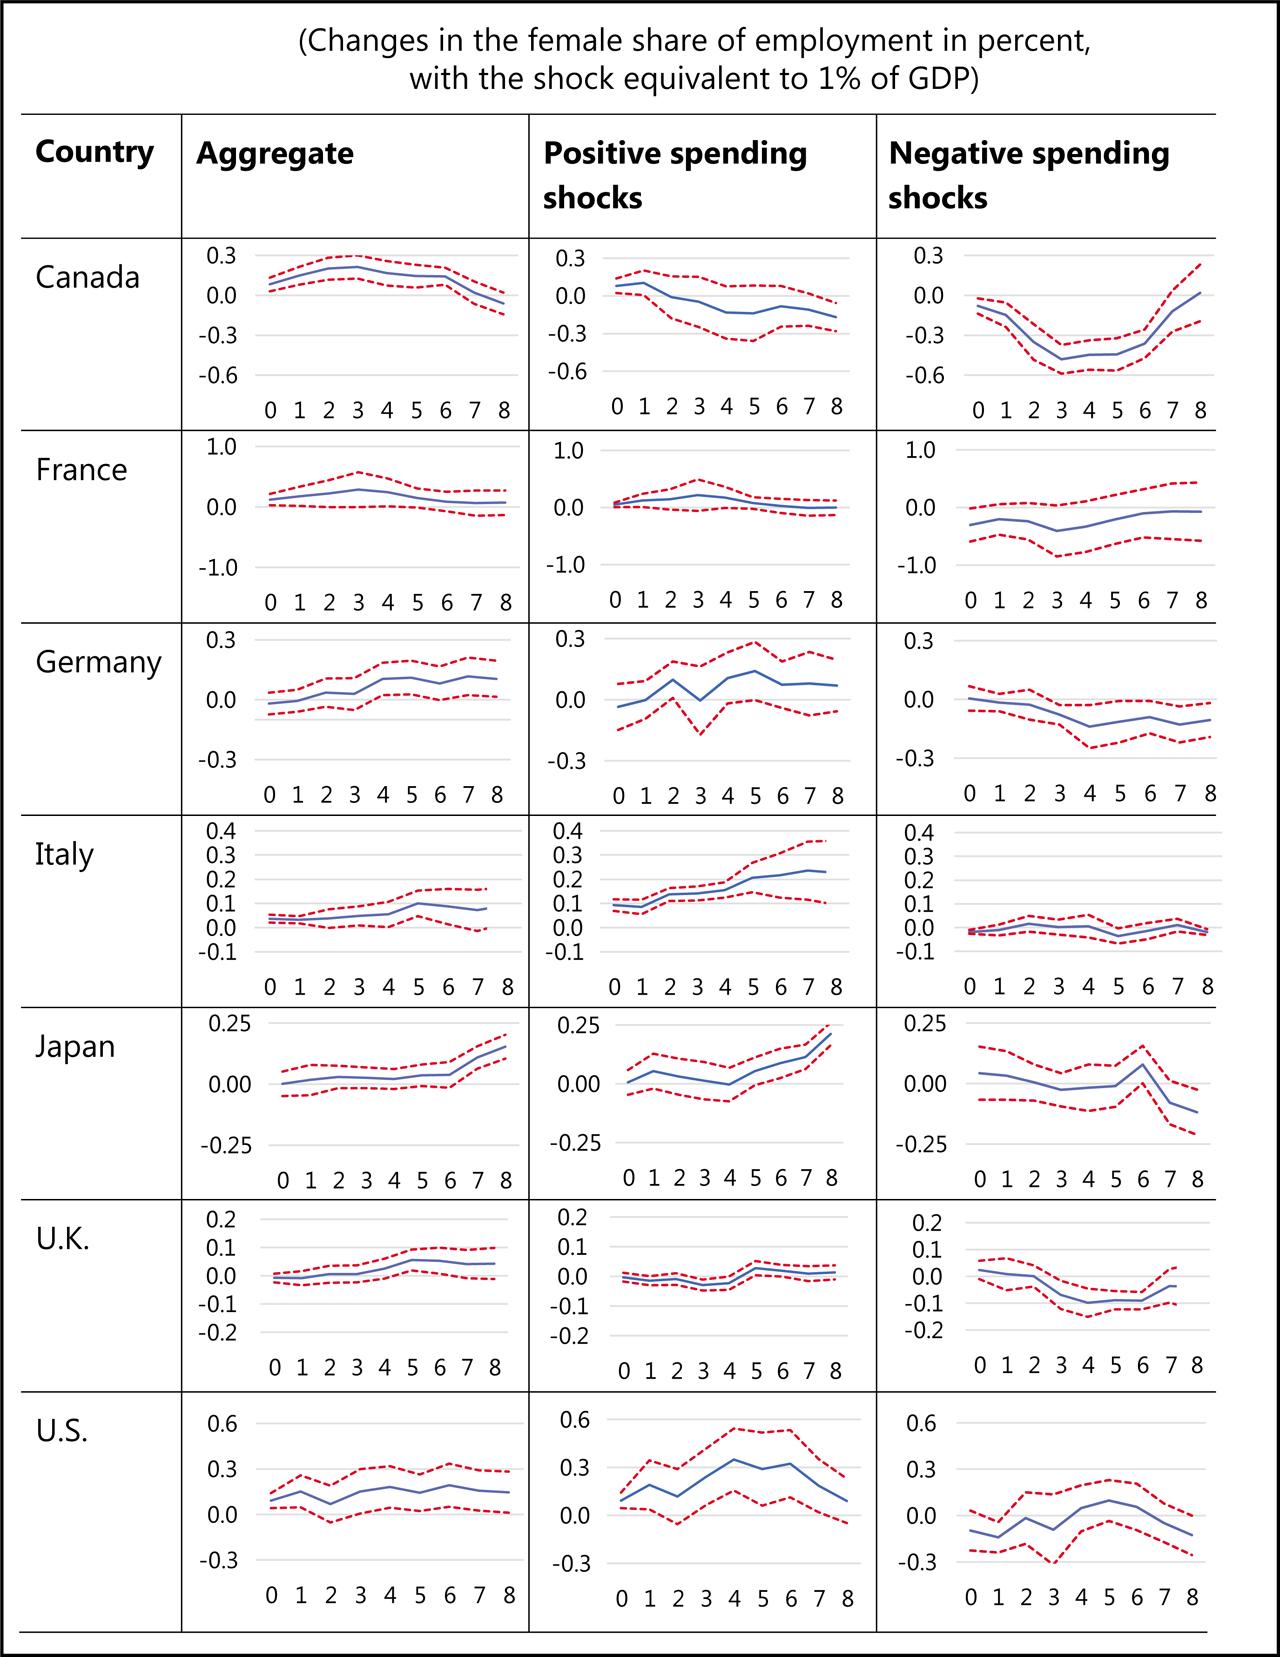
Figure 7
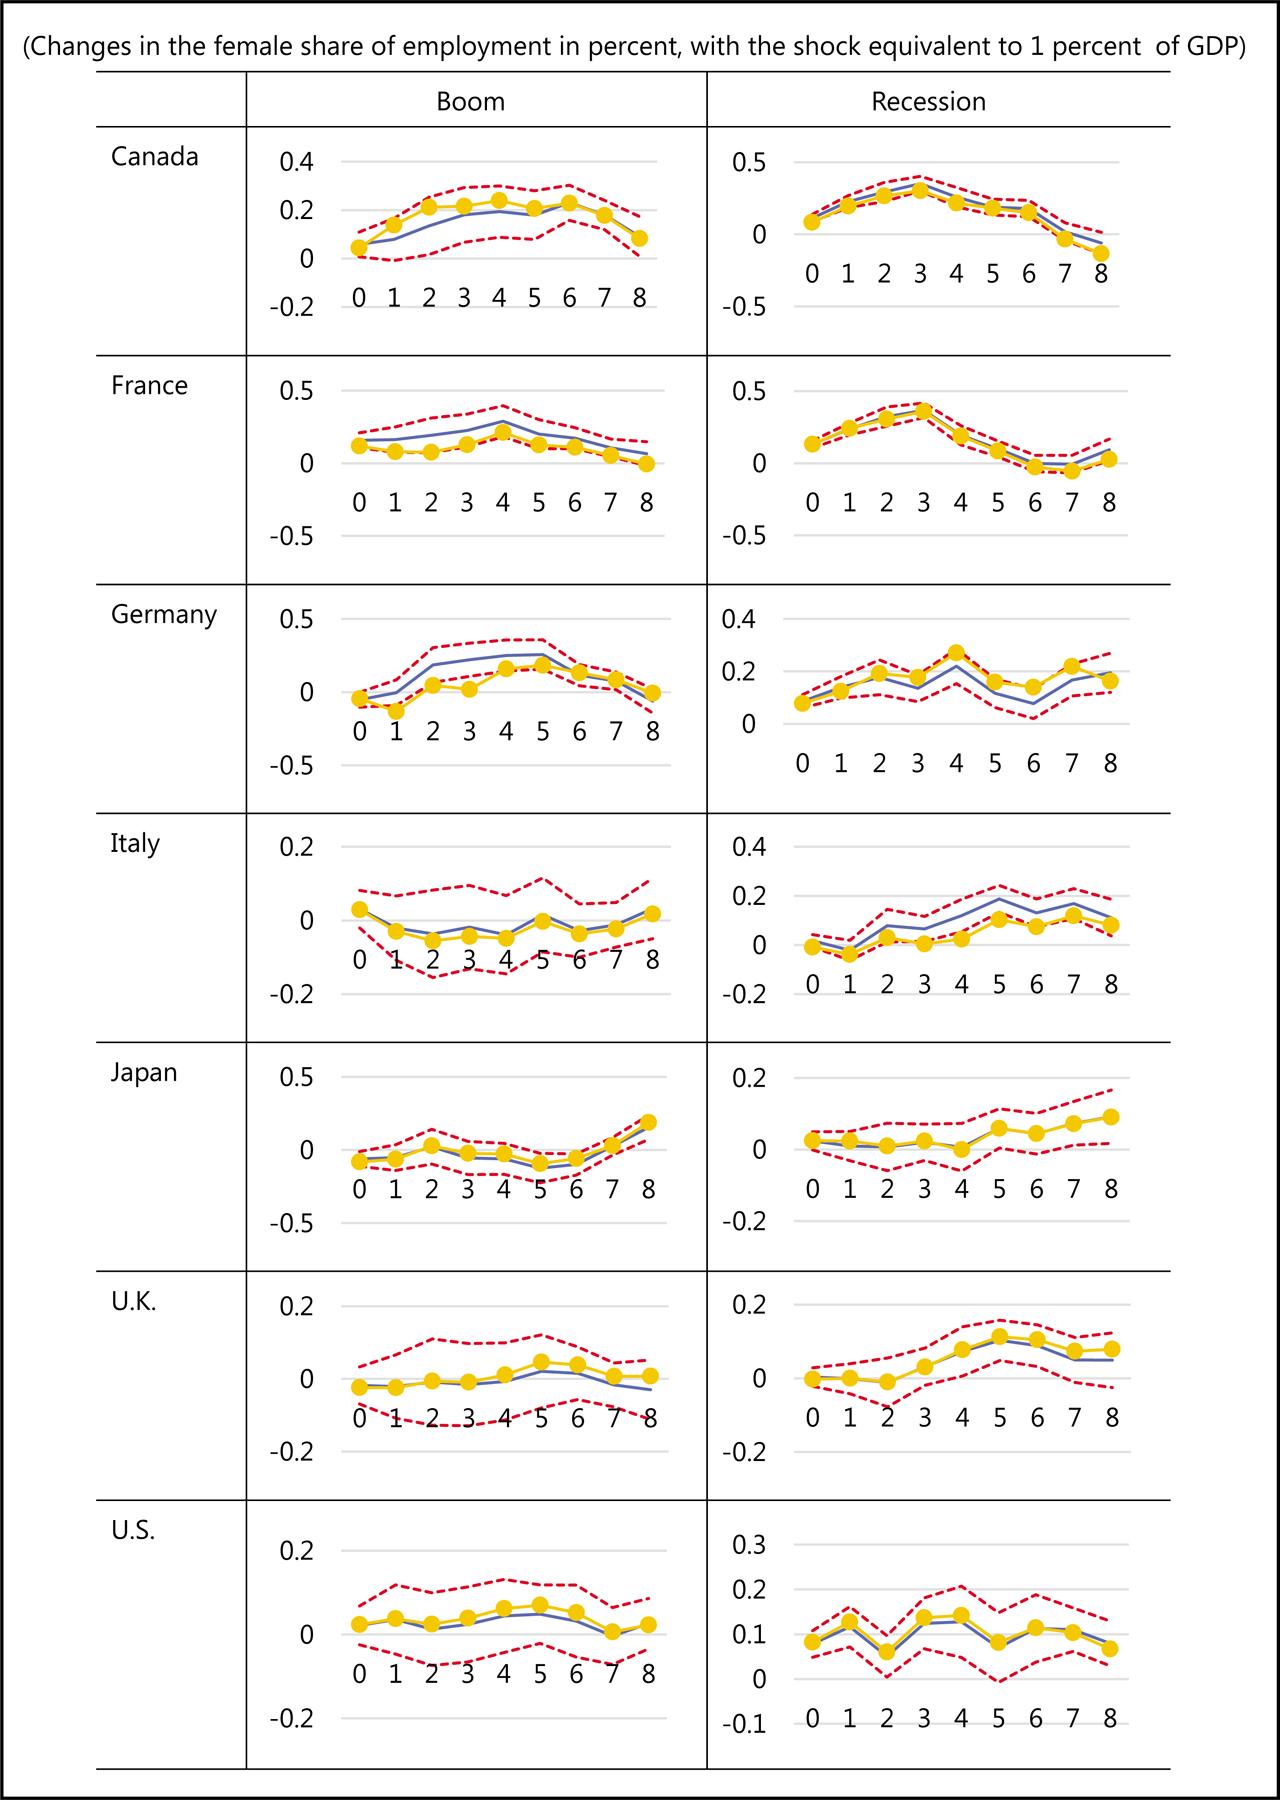
Effects of government spending shock on gender employment (Changes in the female share of total employment, in percentage points)
| Country | Boom | Recession | ||||||||
|---|---|---|---|---|---|---|---|---|---|---|
| Peak | 8th quarter | Peak | 8th quarter | |||||||
| Canada | 0.26 | * | (6) | 0.14 | * | 0.27 | * | (3) | −0.08 | |
| France | 0.21 | (4) | −0.01 | 0.36 | * | (3) | 0.03 | |||
| Germany | 0.18 | * | (5) | −0.01 | 0.27 | * | (4) | 0.16 | * | |
| Italy | 0.09 | * | (8) | 0.09 | * | 0.52 | * | (7) | 0.39 | * |
| Japan | 0.18 | (8) | 0.18 | 0.09 | * | (8) | 0.09 | * | ||
| UK | 0.05 | * | (5) | 0.01 | 0.11 | * | (5) | 0.08 | * | |
| US | 0.17 | (5) | 0.05 | 0.31 | * | (4) | 0.14 | * | ||
Impacts of spending shocks on female and male unemployment, labor force, and employment during recessions_ (Percent changes, peak after the shock)
| Male | Female | |||||||||||
|---|---|---|---|---|---|---|---|---|---|---|---|---|
| Unemployment rate | Labor force | Employment | Unemployment rate | Labor force | Employment | |||||||
| Canada | −0.2* | (2) | 0.0 | (7) | 0.7 | (7) | −0.4* | (1) | 0.3* | (3) | 1.7* | (6) |
| France | −1.0* | (7) | 0.1 | (3) | 1.5* | (5) | −0.8* | (5) | 0.3* | (2) | 1.9* | (3) |
| Germany | −0.5* | (3) | 0.0 | (0) | −0.1 | (6) | −0.3 | (3) | −0.2* | (8) | 0.2 | (0) |
| Italy | −0.1* | (1) | −0.2* | (3) | 0.1 | (5) | −0.4* | (4) | 0.3* | (8) | 0.5* | (5) |
| Japan | −0.1* | (4) | 0.1* | (7) | 0.7* | (5) | −0.1* | (2) | 0.1* | (8) | 0.8* | (7) |
| UK | 0.5* | (6) | 0.1* | (7) | 0.0 | (0) | 0.3* | (6) | 0.1 | (5) | 0.5* | (7) |
| US | −1.4* | (5) | 0.2* | (6) | 1.6* | (8) | −1.1* | (5) | 0.3* | (7) | 1.9* | (8) |
Summary Statistics
| Country | Sample period | Mean (standard deviation) | |||
|---|---|---|---|---|---|
| GDP | Government Spending | Tax revenues | Female Share of Total Employment Ratio | ||
| Canada | 1980:1–2016:3 | 12.08 (0.12) | 11.48 (0.09) | 11.56 (0.11) | −0.79 (0.05) |
| France | 1992:1–2017:1 | 5.66 (0.05) | 5.04 (0.10) | 5.31 (0.11) | −0.77 (0.03) |
| Germany | 1992:2–2016:4 | 12.39 (0.04) | 11.71 (0.04) | 11.13 (0.05) | −0.81 (0.04) |
| Italy | 1999:1–2017:1 | 5.60 (0.01) | 5.28 (0.02) | 5.11 (0.02) | −0.91 (0.03) |
| Japan | 1980:1–2016:3 | 14.62 (0.09) | 14.03 (0.08) | 13.94 (0.08) | −0.89 (0.03) |
| The UK | 1980:1–2017:1 | 12.12 (0.11) | 11.48 (0.09) | 11.50 (0.11) | −0.80 (0.05) |
| The US | 1980:1–2016:4 | 4.04 (0.13) | 3.38 (0.08) | 3.38 (0.13) | −0.78 (0.03) |
Key Gender-Related Fiscal Policies Implemented by G7 Countries
| Policy Measure | Country Practices |
|---|---|
| Tax Policies | |
| Individual income tax | Canada, Italy, Japan, and UK |
| Tax relief for single or working parents | Most or all G7 |
| Targeted in-work tax credits or benefits | France, Japan |
| Expenditure Policies | |
| Gender-responsive public employment | All G7 |
| Quotas in managerial positions | France, Germany |
| Public sector equal pay | Canada, France, Germany-Laender, Italy |
| Work-life balance | Canada, France, Italy, Japan |
| Women in low-income support | France, Germany, Italy, Japan |
| Education, STEM, elimination of stereotypes | All G7 |
| Health prevention and age-related issues | All G7 |
| Child care support | Canada, Japan, UK, Italy, Germany |
| Paid parental leave | Canada, France, Germany, Italy, Japan |
| Gender-related social security reforms | Canada, France, Italy, UK |
| Pensions linked to the number of children | Germany |
| Programs to counter domestic violence | All G7 |
| Gender-responsive foreign aid and cooperation | Canada, France, Japan |