
Figure 1
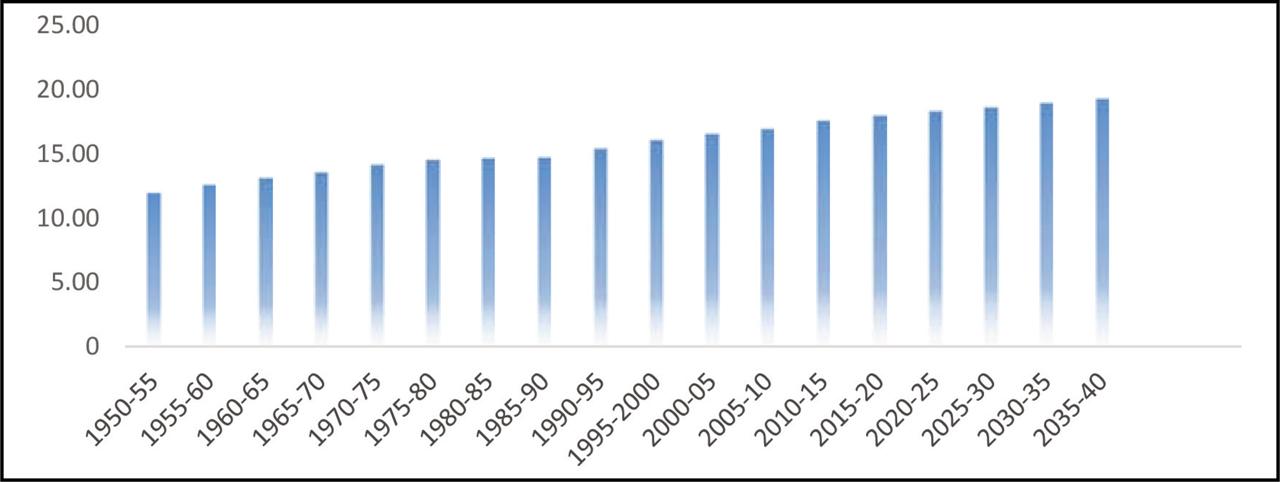
Figure 2
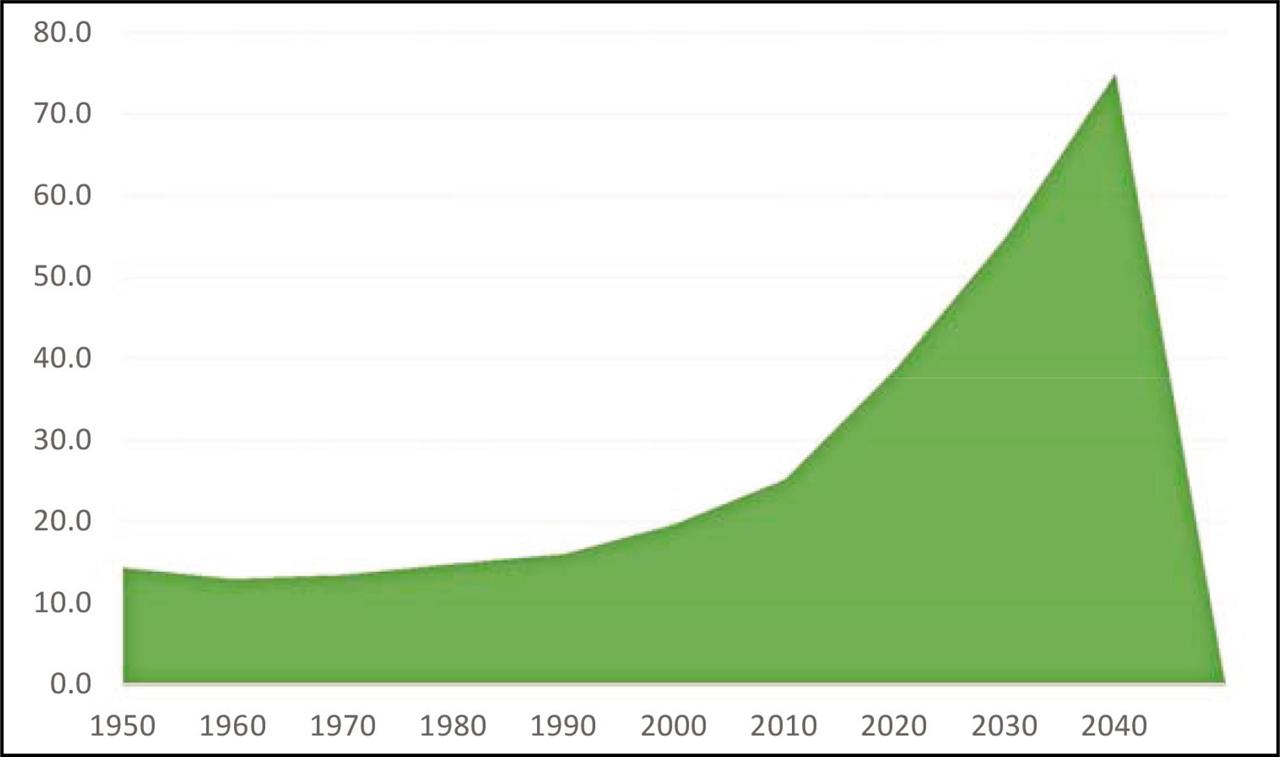
Figure 3
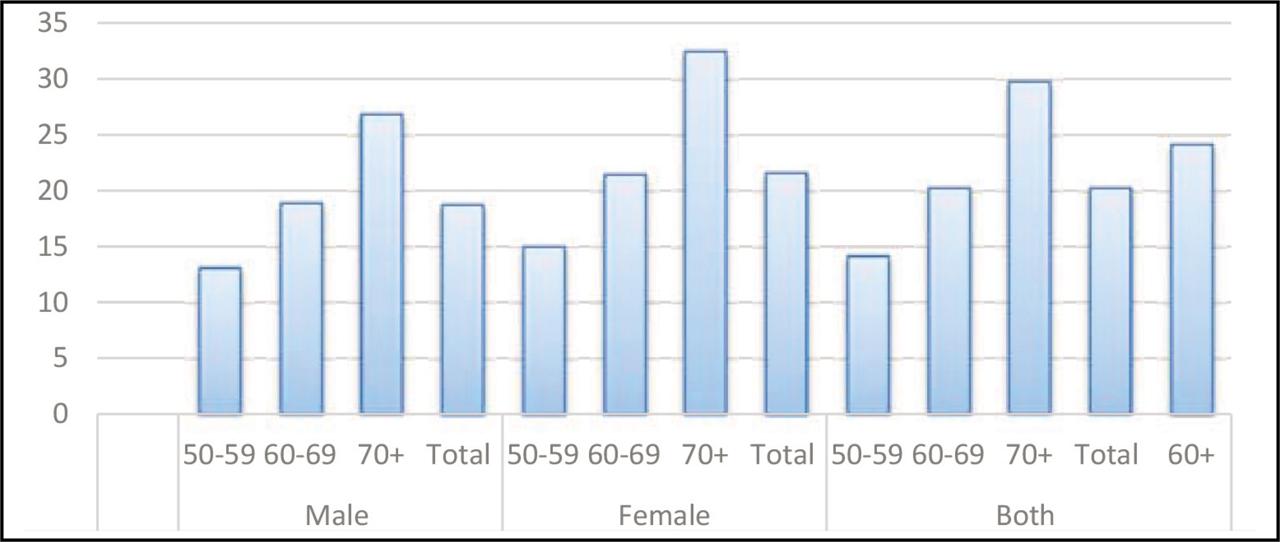
Figure 4
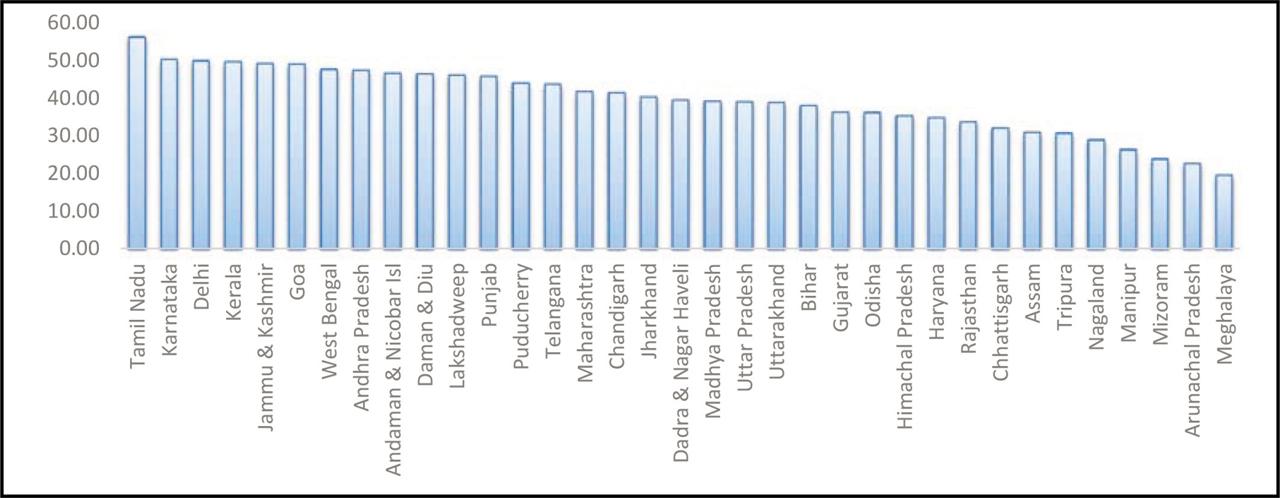
Figure 5
Morbidity and behavioral risk factors of the aging population in India (LASI-2017–18)_
| Gender | Age groups (years) | Multi-morbidity | Obesity | Hypertension | Episodic drinking | Smoking |
|---|---|---|---|---|---|---|
| Any single morbidity | BMI >25 | Yes | Yes | Yes | ||
| Male | 50–59 | 15.66 | 25.55 | 30.13 | 6.94 | 52.08 |
| 60–69 | 21.66 | 20.06 | 33.64 | 5.81 | 52.2 | |
| ≥70 | 23.56 | 14.06 | 34.23 | 3.68 | 47.64 | |
| Total | 19.92 | 20.57 | 32.49 | 5.68 | 50.98 | |
| Female | 50–59 | 17.47 | 37.21 | 28.41 | 0.58 | 16.36 |
| 60–69 | 23.87 | 30.41 | 36.87 | 0.69 | 19.18 | |
| ≥70 | 27.8 | 19.92 | 39.91 | 0.44 | 20.26 | |
| Total | 22.36 | 30.6 | 34.29 | 0.58 | 18.33 | |
| Both | 50–59 | 16.65 | 31.95 | 29.19 | 3.45 | 32.49 |
| 60–69 | 22.83 | 25.57 | 35.36 | 3.08 | 34.63 | |
| ≥70 | 25.78 | 17.08 | 37.16 | 2.01 | 33.51 | |
| Total | 21.22 | 25.94 | 33.45 | 2.95 | 33.53 | |
| ≥60 | 24.05 | 22.19 | 36.09 | 2.65 | 34.17 | |
Life satisfaction and living arrangements of the aging population in India (LASI-2017–18)_
| Gender | Age groups (years) | Living arrangements | Low life satisfaction | Socially active |
|---|---|---|---|---|
| Living alone | Low satisfaction | Not active | ||
| Male | 50–59 | 1.01 | 30.61 | 64.20 |
| 60–69 | 2.10 | 30.71 | 56.21 | |
| ≥70 | 3.11 | 29.85 | 47.21 | |
| Total | 1.96 | 30.45 | 56.79 | |
| Female | 50–59 | 2.77 | 35.49 | 60.26 |
| 60–69 | 6.64 | 32.51 | 51.44 | |
| ≥70 | 11.28 | 35.6 | 43.49 | |
| Total | 6.29 | 34.44 | 52.90 | |
| Both | 50–59 | 1.97 | 33.30 | 62.03 |
| 60–69 | 4.51 | 31.66 | 53.67 | |
| ≥70 | 7.33 | 32.86 | 45.27 | |
| Total | 4.27 | 32.59 | 54.71 | |
| ≥60 | 8.53 | 33.75 | 50.21 | |
Mental health conditions of the aging population in India (LASI-2017–18)_
| Gender | Age groups (years) | Depression CIDI-SF | Depressive symptoms | Cognition score |
|---|---|---|---|---|
| Yes | Yes | Total word recall | ||
| Male | 50–59 | 7.42 | 24.46 | 34.12 |
| 60–69 | 7.40 | 26.74 | 44.25 | |
| ≥70 | 7.17 | 28.71 | 56.52 | |
| Total | 7.35 | 26.39 | 43.56 | |
| Female | 50–59 | 8.01 | 29.81 | 41.66 |
| 60–69 | 8.78 | 30.71 | 51.54 | |
| ≥70 | 10.16 | 35.36 | 64.33 | |
| Total | 8.81 | 31.48 | 50.72 | |
| Both | 50–59 | 7.74 | 27.41 | 38.23 |
| 60–69 | 8.13 | 28.85 | 48.12 | |
| 70+ | 8.73 | 32.19 | 60.58 | |
| Total | 8.13 | 29.13 | 47.38 | |
| ≥60 | 8.37 | 30.2 | 53.16 | |
Economic conditions of the aging population in India (LASI-2017-18)_
| Gender | Age groups (years) | Work status | Work type | Place of work | Work-related pension | ||||||||
|---|---|---|---|---|---|---|---|---|---|---|---|---|---|
| Working | Not working currently | Never worked | Agriculture | Non-agriculture | Wage and salary | Own farm or dwelling | Employers’ place | Others | Pension | Insurance | None | ||
| Male | 50–59 | 90.21 | 7.57 | 2.22 | 46.26 | 22.34 | 31.4 | 39.94 | 16.23 | 43.83 | 5.05 | 4.72 | 89.06 |
| 60–69 | 63.45 | 33.18 | 3.37 | 61.11 | 19.18 | 19.71 | 52.15 | 12.58 | 35.27 | 11.37 | 4.28 | 78 | |
| ≥70 | 33.62 | 61.93 | 4.46 | 65.44 | 20.53 | 14.03 | 59.42 | 11.24 | 29.34 | 13.18 | 3.18 | 64.14 | |
| Total | 65.46 | 31.3 | 3.23 | 54.08 | 20.98 | 24.94 | 46.88 | 14.27 | 38.85 | 9.45 | 4.16 | 80.63 | |
| Female | 50–59 | 40.63 | 14.65 | 44.71 | 64.31 | 10.51 | 25.18 | 47.45 | 16.94 | 35.62 | 1.56 | 1.89 | 93.92 |
| 60–69 | 28.63 | 27.25 | 44.12 | 69.67 | 10.43 | 19.9 | 47.21 | 15.45 | 37.33 | 2.74 | 1.53 | 90.97 | |
| ≥70 | 12.47 | 36.76 | 50.77 | 71.16 | 10.85 | 17.98 | 45.55 | 19.38 | 35.07 | 3.33 | 0.83 | 82.96 | |
| Total | 29.27 | 24.72 | 46.01 | 66.93 | 10.52 | 22.56 | 47.16 | 16.67 | 36.16 | 2.4 | 1.51 | 91.74 | |
| Total | 50–59 | 63.19 | 11.43 | 25.38 | 52.58 | 18.2 | 29.22 | 42.57 | 16.48 | 40.95 | 3.64 | 3.58 | 90.84 |
| 60–69 | 44.96 | 30.03 | 25.01 | 64 | 16.22 | 19.77 | 50.48 | 13.55 | 35.97 | 7.95 | 3.19 | 82.14 | |
| ≥70 | 22.67 | 48.9 | 28.43 | 67.08 | 17.77 | 15.16 | 55.47 | 13.55 | 30.97 | 9.62 | 2.33 | 68.38 | |
| Total | 46.18 | 27.79 | 26.03 | 58.42 | 17.45 | 24.13 | 46.98 | 15.08 | 37.94 | 6.7 | 3.13 | 84.28 | |
| ≥60 | 35.71 | 37.86 | 26.43 | 64.81 | 16.63 | 18.56 | 51.79 | 13.55 | 34.66 | 8.62 | 2.85 | 78.28 | |
Functional health of the aging population in India (LASI-2017–18)_
| Gender | Age groups (years) | ADL | IADL | Impairments | ||
|---|---|---|---|---|---|---|
| 2+ ADL | Any ADL | 2+ IADL | Any IADL | Any impairment | ||
| Male | 50–59 | 4.33 | 9.82 | 11.31 | 19.65 | 7.50 |
| 60–69 | 8.05 | 15.65 | 19.15 | 30.92 | 9.49 | |
| ≥70 | 16.78 | 28.16 | 38.62 | 49.91 | 11.65 | |
| Total | 8.95 | 16.75 | 21.32 | 31.69 | 9.33 | |
| Female | 50–59 | 7.05 | 13.15 | 25.61 | 37.63 | 5.77 |
| 60–69 | 10.29 | 19.57 | 37.5 | 49.61 | 8.31 | |
| ≥70 | 25.15 | 36.2 | 59.44 | 67.34 | 13.29 | |
| Total | 12.74 | 21.22 | 38.34 | 49.36 | 8.56 | |
| Both | 50–59 | 5.81 | 11.64 | 19.11 | 29.46 | 6.55 |
| 60–69 | 9.24 | 17.73 | 28.9 | 40.85 | 8.86 | |
| ≥70 | 21.16 | 32.36 | 49.51 | 59.03 | 12.5 | |
| Total | 10.97 | 19.14 | 30.42 | 41.14 | 8.92 | |
| ≥60 | 14.16 | 23.77 | 37.41 | 48.35 | 10.37 | |