
Figure 1
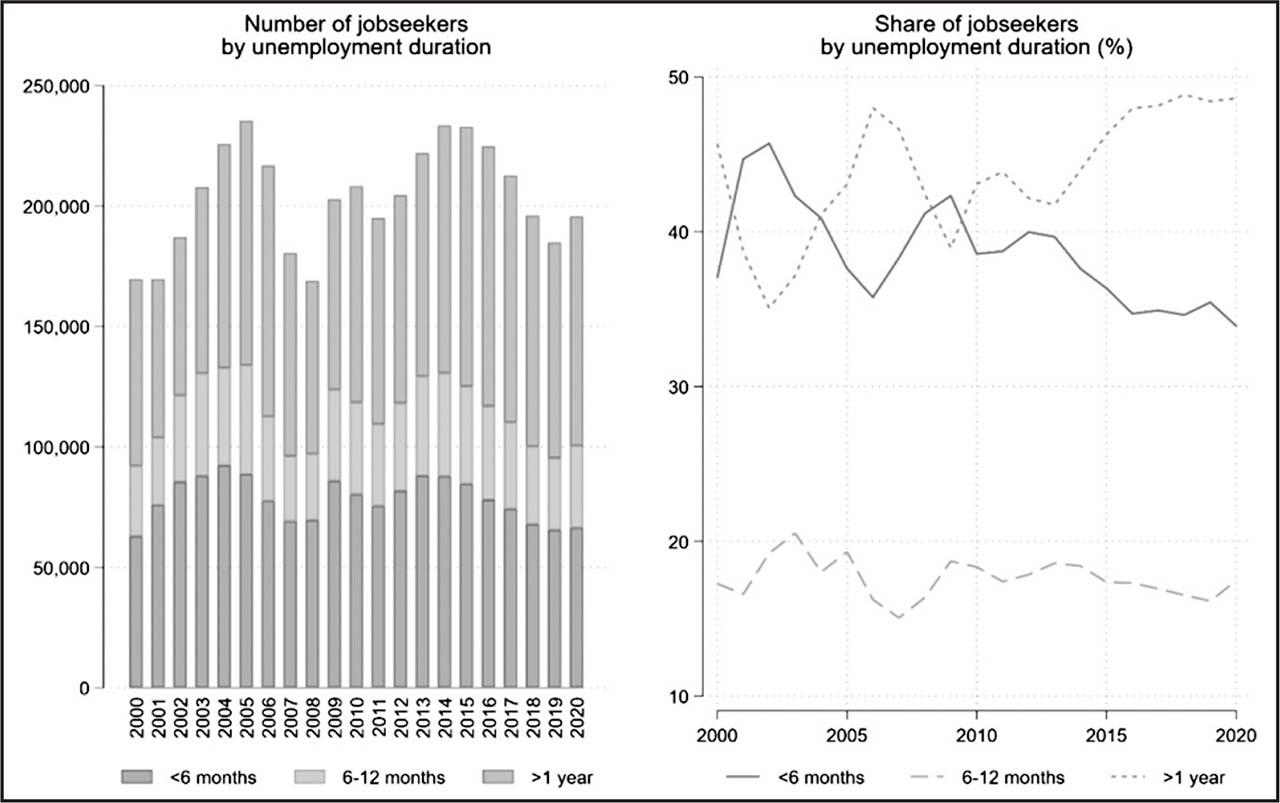
Figure 2
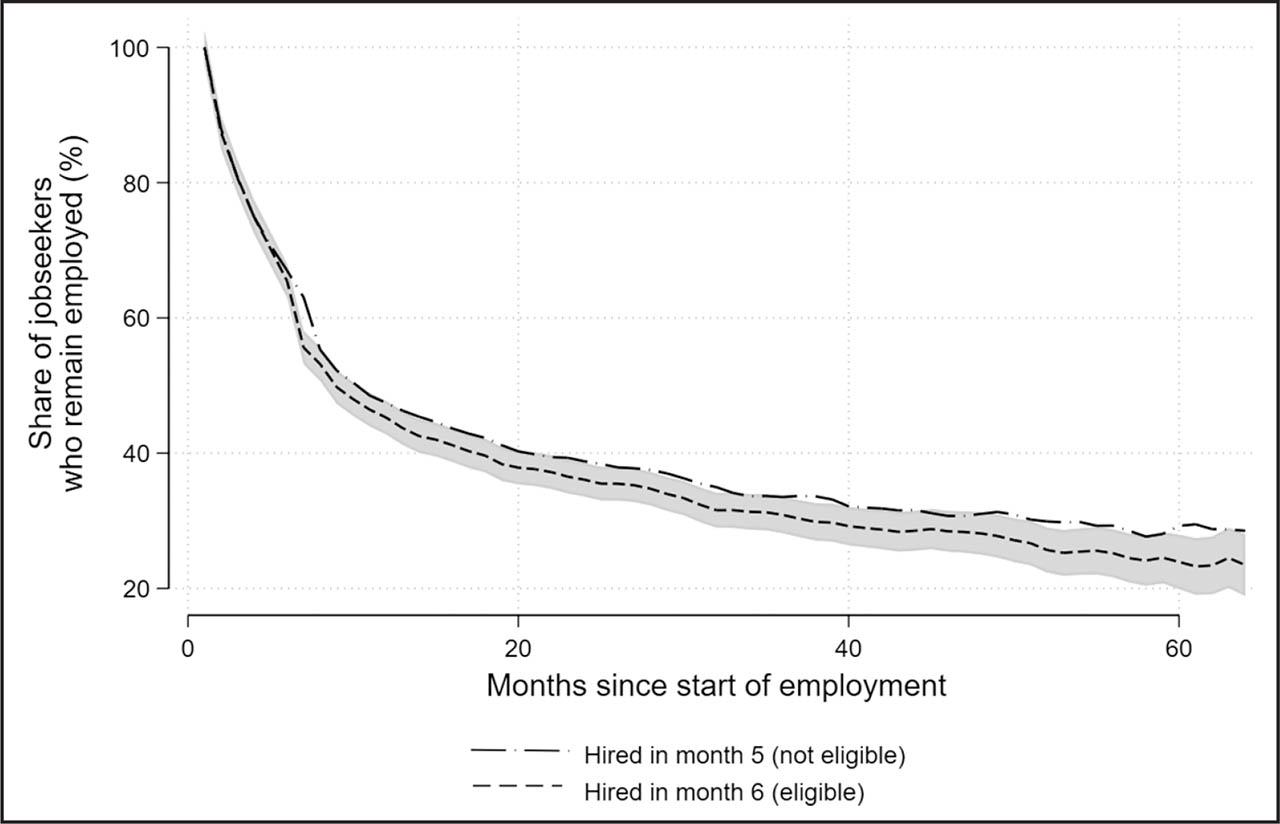
Figure 3
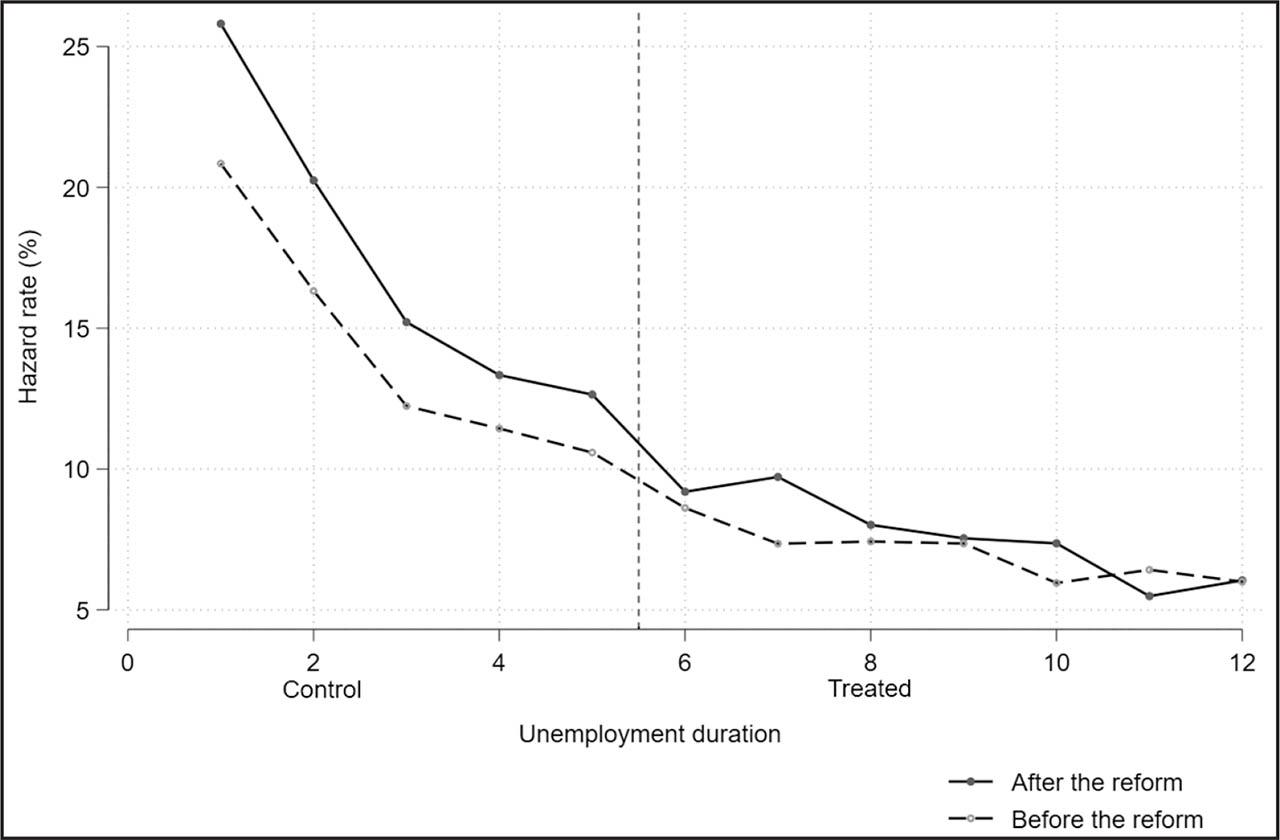
Figure 4

Figure A1
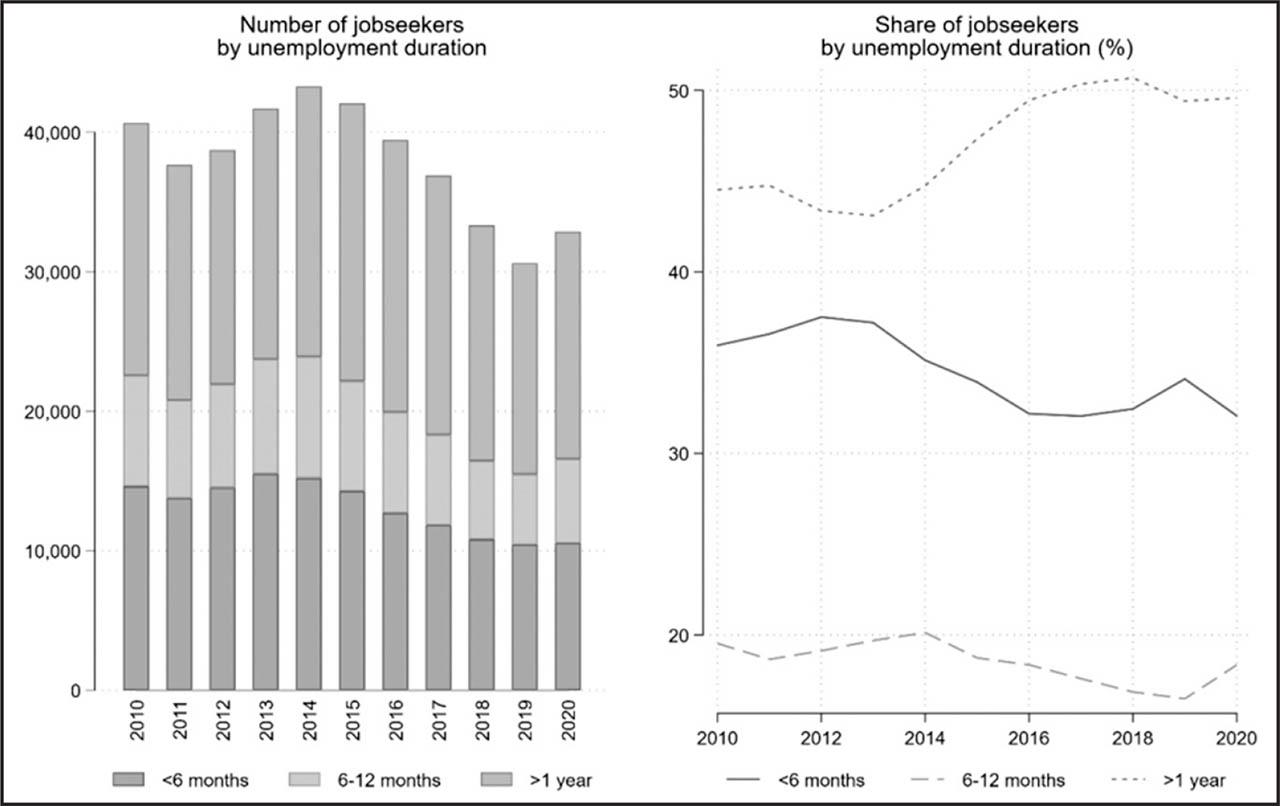
Figure A2
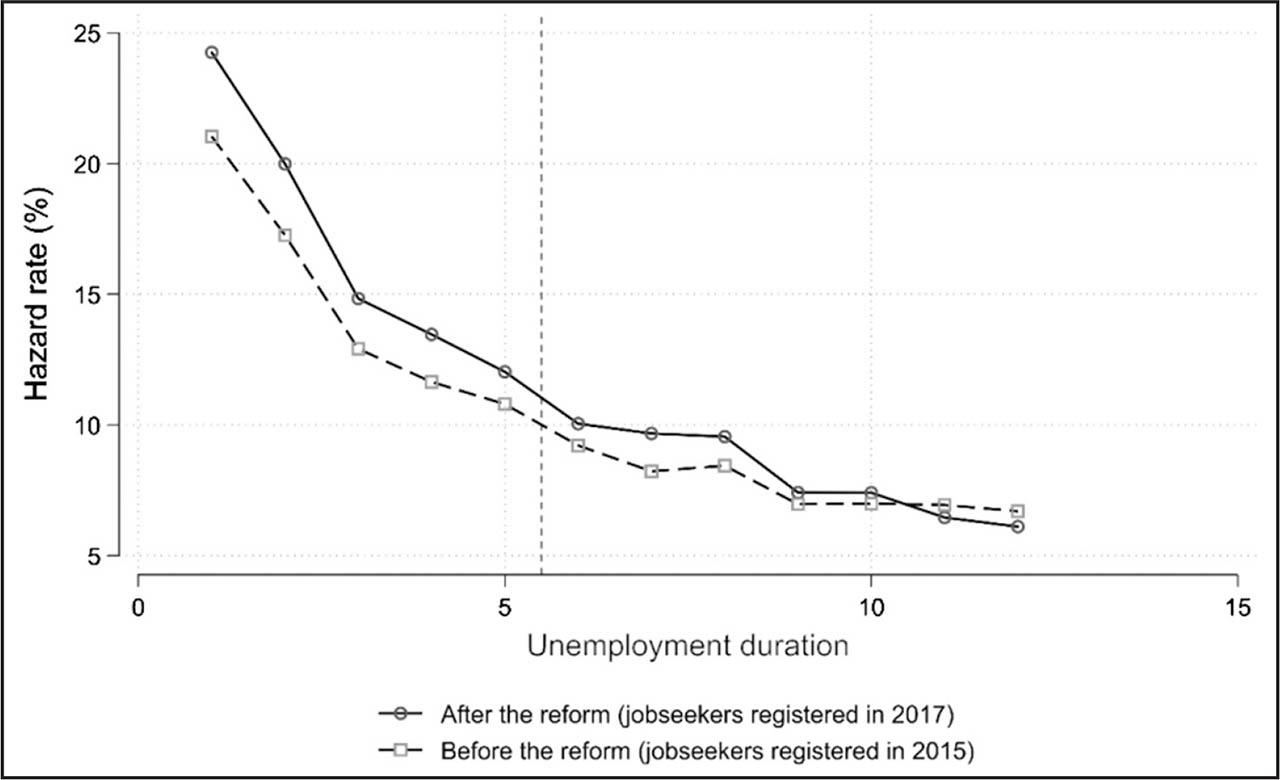
Figure A3

The impact of abolition of the hiring subsidy on the job-finding rate: full results of the benchmark specification
| Benchmark | |
|---|---|
| Unemployment duration (base level: Month 1) | |
| Month 2 | −0.0407*** (0.00183) |
| Month 3 | −0.0841*** (0.00181) |
| Month 4 | −0.0998*** (0.00183) |
| Month 5 | −0.109*** (0.00185) |
| Month 6 | −0.111*** (0.00213) |
| Month 7 | −0.122*** (0.00213) |
| Month 8 | −0.129*** (0.00213) |
| Month 9 | −0.132*** (0.00214) |
| Month 10 | −0.141*** (0.00212) |
| Month 11 | −0.141*** (0.00215) |
| Month 12 | −0.143*** (0.00217) |
| Post-reform | 0.0250*** (0.00275) |
| Age 45–48 years | −0.00487*** (0.00144) |
| Age 45–48 years ## post-reform | 0.0101*** (0.00261) |
| Post-reform ## long-term unemployed | −0.0231*** (0.00247) |
| Post-reform ## age 45–48 years ## long-term unemployed | −0.0118*** (0.00358) |
| Year of registration at the PES (base level: 2012) | |
| 2013 | −0.00498*** (0.00147) |
| 2014 | 0.00309** (0.00154) |
| 2015 | 0.0131*** (0.00159) |
| 2016 | 0.0115*** (0.00205) |
| 2017 | 0.0162*** (0.00283) |
| 2018 | 0.0205*** (0.00298) |
| Education (base level: high level) | |
| Low | −0.00236** (0.00116) |
| Medium | 0.00423*** (0.00115) |
| Man | 0.00759*** (0.000845) |
| Proficiency in Dutch (base level: no proficiency) | |
| Limited proficiency | −0.00967*** (0.00332) |
| Good proficiency | 0.00455 (0.00325) |
| Excellent proficiency | 0.00491 (0.00329) |
| Origin (base level: EU-15) | |
| EU-13 | −0.0196*** (0.00261) |
| Other | −0.0250*** (0.00110) |
| Constant | 0.197*** (0.00387) |
| No. of unemployment spells | 104,437 |
| No. of observations | 602,916 |
| R2 | 0.032 |
Placebo tests for the benchmark analysis
| Parallel trend | Placebo test for the short-term unemployed | |
|---|---|---|
| Age 45–48 years ## long-term unemployed ## | ||
| 2012 | 0.00494 (0.00613) | |
| 2013 | 0.00441 (0.00534) | |
| 2014 | −0.000794 (0.00559) | |
| 2016 Q1–Q2 | 0.00574 (0.00762) | |
| 2016 Q3–Q4 | −0.00516 (0.00715) | |
| 2017 | −0.0101* (0.00616) | |
| 2018 | −0.0137* (0.00721) | |
| Age 45–48 years ## after reform ## unemployed for (base level: 5 months) | ||
| Less than 5 months | 0.00134 (0.00668) | |
| 6–12 months | −0.0112* (0.00650) | |
| No. of unemployment spells | 104,437 | 104,437 |
| No. of observations | 602,916 | 602,916 |
| R2 | 0.032 | 602,916 |
| Pre-reform parallel trend (F-test, p-value) | 0.74 | |
| Post-reform parallel trend (F-test, p-value) | 0.59 | |
| No effect on the short-term unemployed (p-value) | 0.84 | |
The effect of the subsidy for different populations
| Job-finding rate | Job stability: remaining employed for 6 consecutive months | |
|---|---|---|
| Benchmark specification | −0.0118*** (0.00358) | −0.00408 (0.00286) |
| Population: all jobseekers | −0.0101*** (0.00269) | −0.00521** (0.00209) |
| Population: all jobseekers who worked 4 months prior to registration + jobseekers whose unemployment history is not known | −0.0110*** (0.00330) | −0.00417 (0.00265) |
The effect of the abolition of the hiring subsidy on finding a job and remaining employed for 1–12 consecutive months (Figure 4, left panel in the main text plots the results)
| Employed for at least: | ||||||||||||
|---|---|---|---|---|---|---|---|---|---|---|---|---|
| 1 month | 2 months | 3 months | 4 months | 5 months | 6 months | 7 months | 8 months | 9 months | 10 months | 11 months | 12 months | |
| Effect | −0.0118*** (0.00358) | −0.00934*** (0.00337) | −0.00786** (0.00322) | −0.00445 (0.00308) | −0.00459 (0.00297) | −0.00408 (0.00286) | −0.00361 (0.00273) | −0.00383 (0.00264) | −0.00347 (0.00256) | −0.00191 (0.00248) | −0.000313 (0.00238) | −0.000546 (0.00230) |
| No. of unemployment spells | 104,437 | 104,437 | 104,158 | 103,949 | 103,699 | 103,444 | 103,157 | 102,837 | 102,726 | 102,601 | 102,430 | 102,280 |
| No. of observations | 602,916 | 602,323 | 601,458 | 600,846 | 600,165 | 599,403 | 598,250 | 597,607 | 597,227 | 596,763 | 596,209 | 595,688 |
| R2 | 0.032 | 0.028 | 0.026 | 0.024 | 0.022 | 0.021 | 0.021 | 0.022 | 0.022 | 0.022 | 0.021 | 0.020 |
| Post-reform placebo test (F-test, p-value) | 0.58 | 0.73 | 0.81 | 0.62 | 0.84 | 0.88 | 0.64 | 0.96 | 0.93 | 0.78 | 0.32 | 0.37 |
| Effect on the short-term unemployed (p-value) | 0.91 | 0.85 | 0.75 | 0.94 | 0.94 | 0.77 | 0.89 | 0.87 | 0.73 | 0.50 | 0.44 | 0.39 |
The Breusch–Godfrey LM test on grouped errors
| Weighted OLS | |
|---|---|
| Lagged grouped error | 0.0526*** (0.0109) |
| Number of observations | 9,742 |
| R2 | 0.021 |
DiD exploiting differences across unemployment duration among older jobseekers and placebo tests
| DiD: short-term vs. long-term unemployed, among jobseekers aged 45–48 years | Placebo test 1: post-reform parallel trends | Placebo test 2: jobseekers aged 40–43 years | |
|---|---|---|---|
| Post-reform ## long-term unemployed | −0.0352*** (0.00264) | −0.0230*** (0.00248) | |
| Long-term unemployed ## year (base level: 2015) | |||
| 2012 | 0.00626 (0.00444) | ||
| 2013 | 0.0162*** (0.00384) | ||
| 2014 | 0.00572 (0.00403) | ||
| 2016 Q1–Q2 | −0.000136 (0.00548) | ||
| 2016 Q3–Q4 | −0.0194*** (0.00523) | ||
| 2017 | −0.0283*** (0.00448) | ||
| 2018 | −0.0377*** (0.00522) | ||
| No. of observations | 283,469 | 283,469 | 319,447 |
| R2 | 0.034 | 0.034 | 0.031 |
| Post-reform parallel trend (F-test, p-value) | 0.012** | ||
The impact of the abolition of the hiring subsidy on the job-finding rate: triple-difference estimates
| Benchmark | Ruling out: | More stringent definition of “work” (excluding short-lived temporary work) | |||
|---|---|---|---|---|---|
| Substitution between age groups | Substitution between the short-term and long-term unemployed | Anticipation effects | |||
| Age 45–48 years ## post-reform ## long-term unemployed (base level: 40–43 years) | |||||
| −0.0118*** (0.00358) | −0.0119*** (0.00377) | −0.0133*** (0.00408) | −0.00636** (0.00273) | ||
| Post-reform ## long-term unemployed (base level: 35–37 years) | |||||
| ## Age 38 years | 0.00779** (0.00389) | ||||
| ## Age 39 years | 0.000466 (0.00394) | ||||
| ## Age 40 years | 0.00170 (0.00399) | ||||
| ## Age 41 years | −0.00158 (0.00404) | ||||
| ## Age 42 years | 0.00222 (0.00413) | ||||
| ## Age 43 years | −0.000159 (0.00410) | ||||
| ## Age 44–44.5 years | 0.000781 (0.00558) | ||||
| Age 45–48 years ## post-reform ## unemployed for 5 months | |||||
| −0.000717 (0.00667) | |||||
| No. of unemployment spells | 104,437 | 281,701 | 104,437 | 89,291 | 104,437 |
| No. of observations | 602,916 | 1,686,890 | 602,916 | 516,196 | 753,119 |
| R2 | 0.032 | 0.033 | 0.032 | 0.032 | 0.013 |
| Placebo tests | |||||
| Post-reform parallel trend test (F-test, p-value) | 0.59 | 0.93 | 0.75 | 0.63 | 0.20 |
| Effect on the short-term unemployed (p-value) | 0.84 | – | – | 0.86 | 0.91 |
The effect of the subsidy by gender and level of education
| Job-finding rate | Job stability | ||
|---|---|---|---|
| Benchmark specification | More stringent definition of “work” (excluding short-lived temporary work) | Remaining employed for 6 consecutive months | |
| Sex | |||
| Men | −0.0076 (0.0118) | −0.0048 (0.0039) | −0.0044 (0.0039) |
| Women | −0.0168*** (0.0052) | −0.0083** (0.0038) | −0.0041 (0.0042) |
| Education | |||
| Less than a bachelor's degree | −0.0074*, a (0.004) | −0.0051* (0.003) | −0.0005a (0.0032) |
| At least a bachelor's degree | −0.0264***, a (0.0077) | −0.0113* (0.0062) | −0.0163**, a (0.0064) |
DiD exploiting differences across age groups for the long-term unemployed and placebo tests
| DiD: young vs. older long-term unemployed jobseekers | Placebo test 1: post-reform parallel trends | Placebo test 2: short-term unemployed | |
|---|---|---|---|
| Post-reform ## age 45–48 years | −0.00138 (0.00245) | 0.0101*** (0.00261) | |
| Age 45–48 years ## year (base level: 2015) | |||
| 2012 | 0.00769* (0.00394) | ||
| 2013 | 0.00220 (0.00346) | ||
| 2014 | 0.00463 (0.00363) | ||
| 2016 Q1–Q2 | 0.00444 (0.00495) | ||
| 2016 Q3–Q4 | 0.00652 (0.00473) | ||
| 2017 | 0.00102 (0.00407) | ||
| 2018 | −0.00195 (0.00538) | ||
| No. of observations | 241,611 | 241,611 | 361,305 |
| R2 | 0.005 | 0.005 | 0.020 |
| Post-reform parallel trend (F-test, p-value) | 0.34 | ||
Studies on the effectiveness of private employment programs for the long-term unemployed included in the review by Card et al_ (2018) (studies not included in the bibliography)
| Title | Authors | Year of publication | Journal | Country |
|---|---|---|---|---|
| Active labor market policies in Denmark: A comparative analysis of postprogram effects | Blanche | 2011 | U | Denmark |
| Evaluating the impact of a well-targeted wage subsidy using administrative data | Cseres-Gergely, Scharle, Földessy | 2012 | U | Hungary |
| The effectiveness of targeted wage subsidies for hard-to-place workers | Jaenichen, Stephan | 2011 | Applied Economics | Germany |
| Evaluation of subsidized employment programs for long-term unemployed in Bulgaria | Mihaylov | 2011 | Economic Studies | Bulgaria |
| Do long-term unemployed workers benefit from targeted wage subsidies? | Schünemann, Lechner, Wunsch | 2013 | German Econ Rev | Germany |
| Employment subsidies: A fast lane from unemployment to work? | Forslund, Johansson, Lindquist | 2004 | U | Sweden |
| Income support policies for part-time workers: A stepping-stone to regular jobs? | Cockx, Robin, Goebel | 2010 | U | Belgium |
| An application to young long-term unemployed women in Belgium | ||||
| Dynamic treatment assignment: The consequences for evaluations using observational data | Fredriksson, Johansson | 2008 | U | Sweden |
| Do active labor market policies help unemployed workers to find and keep regular jobs? | Van Ours | 2000 | Book | Slovakia |
| The locking-in effect of subsidized jobs | Van Ours | 2004 | Journal of Comparative Economics | Slovakia |
Characteristics of jobseekers by age group and unemployment duration: Age group; Unemployment duration, before and after the reform
| Jobseekers aged 40–43 years | Jobseekers aged 45–48 years | Triple difference2 | ||||||||
|---|---|---|---|---|---|---|---|---|---|---|
| Short-term unemployed | Long-term unemployed | Short-term unemployed | Long-term unemployed | |||||||
| Before | After | Before | After | Before | After | Before | After | Hired with a subsidy1 | ||
| Age, years | 41.48 | 41.44 | 41.49 | 41.44 | 46.47 | 46.47 | 46.48 | 46.46 | 47.13 | 0.77 |
| Men, % | 54.12 | 54.77 | 54.76 | 54.10 | 53.80 | 54.84 | 54.83 | 54.13 | 56.84 | 0.43 |
| Education, % | ||||||||||
| Low | 38.74 | 37.66 | 40.99 | 39.50 | 42.73 | 39.37 | 44.15 | 41.56 | 43.33 | −1.18 |
| Medium | 39.69 | 39.01 | 38.72 | 37.59 | 37.47 | 38.53 | 36.41 | 37.10 | 43.73 | −0.08 |
| High | 21.57 | 23.34 | 20.30 | 22.91 | 19.80 | 22.11 | 19.44 | 21.34 | 12.94 | 1.25 |
| Proficiency in Dutch, % | ||||||||||
| No | 1.26 | 2.80 | 1.35 | 2.83 | 1.07 | 2.58 | 1.20 | 2.71 | 2.22 | −0.05 |
| Limited | 11.22 | 14.17 | 13.25 | 16.06 | 10.06 | 13.08 | 11.79 | 15.48 | 9.61 | −0.81 |
| Good | 37.40 | 32.47 | 37.70 | 32.32 | 39.04 | 35.13 | 39.50 | 35.32 | 37.60 | −0.18 |
| Excellent | 50.13 | 50.57 | 47.70 | 48.79 | 49.83 | 49.21 | 47.51 | 46.50 | 50.57 | 1.04 |
| Origin, % | ||||||||||
| EU-15 | 74.46 | 68.08 | 70.33 | 63.86 | 80.16 | 73.80 | 76.42 | 70.15 | 77.97 | −0.17 |
| EU-13 | 2.16 | 3.46 | 2.44 | 3.58 | 1.76 | 2.97 | 1.95 | 3.35 | 3.11 | −0.34 |
| Other | 23.38 | 28.47 | 27.24 | 32.56 | 18.08 | 23.23 | 21.63 | 26.50 | 18.92 | 0.52 |
| No. of individuals | 34,318 | 21,127 | 18,259 | 8,332 | 30,405 | 18,587 | 16,381 | 7,192 | 1,221 | – |
The five most important sectors in terms of new hires with a subsidy in each quarter (2015Q2–2016Q4)
| Sector | Share of new hires with a subsidy, 2015Q2–2016Q4 |
|---|---|
| Temporary employment agency activities | 61% |
| Cleaning activities | 4% |
| Restaurants and mobile food service activities | 2% |
| Retail sale in nonspecialized stores | 2% |
| Other social work activities without accommodation | 2% |
The effect of the subsidy on the job-finding rate: robustness checks
| Censor spells when jobseekers leave the labor market | Treatment group includes jobseekers aged 44.5–48 years | Sensitivity to classification of jobseekers into pre-reform and post-reform periods | Effect by month | |||
|---|---|---|---|---|---|---|
| Using July 1, 2016, as cutoff date | Excluding jobseekers registering in June 2016 | Excluding jobseekers registering in the period April–June 2016 | ||||
| Effect | −0.0125*** (0.00394) | −0.0113*** (0.00347) | −0.0113*** (0.00363) | −0.0116*** (0.00364) | −0.0115*** (0.00365) | |
| Age 45–48 years ## post-reform | ||||||
| ## Unemployed for 6 months | −0.0168** (0.00664) | |||||
| ## Unemployed for 7 months | −0.00731 (0.00678) | |||||
| ## Unemployed for 8 months | −0.00979 (0.00684) | |||||
| ## Unemployed for 9–12 months | −0.0262*** (0.00292) | |||||
| No. of unemployment spells | 104,437 | 110,930 | 104,437 | 103,322 | 101,296 | 104,437 |
| No. of observations | 545,580 | 640,138 | 602,916 | 596,171 | 583,026 | 602,916 |
| R2 | 0.028 | 0.032 | 0.032 | 0.032 | 0.033 | 0.032 |