
Graph 1
Graph 2
Graph 3
Graph 4
Graph 5
Graph 6
Graph 7
Logit analysis of unemployment entries (transitions from employment to unemployment)
| Dependent var: Probability to enter unemployment | Specification 1 | Specification 2 | ||||||
|---|---|---|---|---|---|---|---|---|
| Total Period | Period 1 | Period 2 | Period 3 | Total Period | Period 1 | Period 2 | Period 3 | |
| Minwage (% dif) | 1.00 | 1.05 | 0.98*** | 0.98 | 0.99 | 1.06 | 0.99 | 0.95 |
| Minwage (% dif) # age group (15–24) | 1.01 | 1.01 | 1.00 | 1.03 | ||||
| Minwage (% dif) # age group (25–34) | 1.01 | 1.01 | 1.00 | 1.09* | ||||
| Minwage (% dif) # age group (35–49) | 1.00 | 0.99 | 1.00 | 1.02 | ||||
| Age groups—baseline: age group 50+ | ||||||||
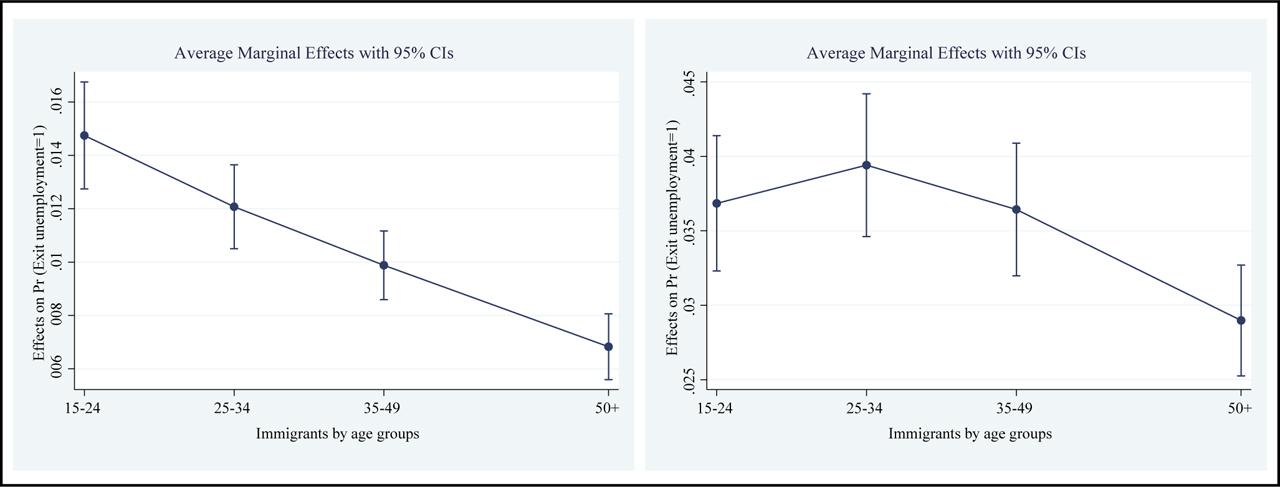
| Age group 15–24 | 3.81*** | 3.58*** | 5.96 | 4.12*** | 3.81*** | 3.77 | 5.19*** | 4.11*** |
| Age group 25–34 | 2.63*** | 2.61*** | 3.62*** | 2.55*** | 2.63*** | 2.72*** | 3.25*** | 2.51*** |
| Age group 35–49 | 1.85*** | 1.98*** | 2.16*** | 1.58*** | 1.85*** | 2.08*** | 2.04*** | 1.58*** |
| Gender—baseline: male | ||||||||
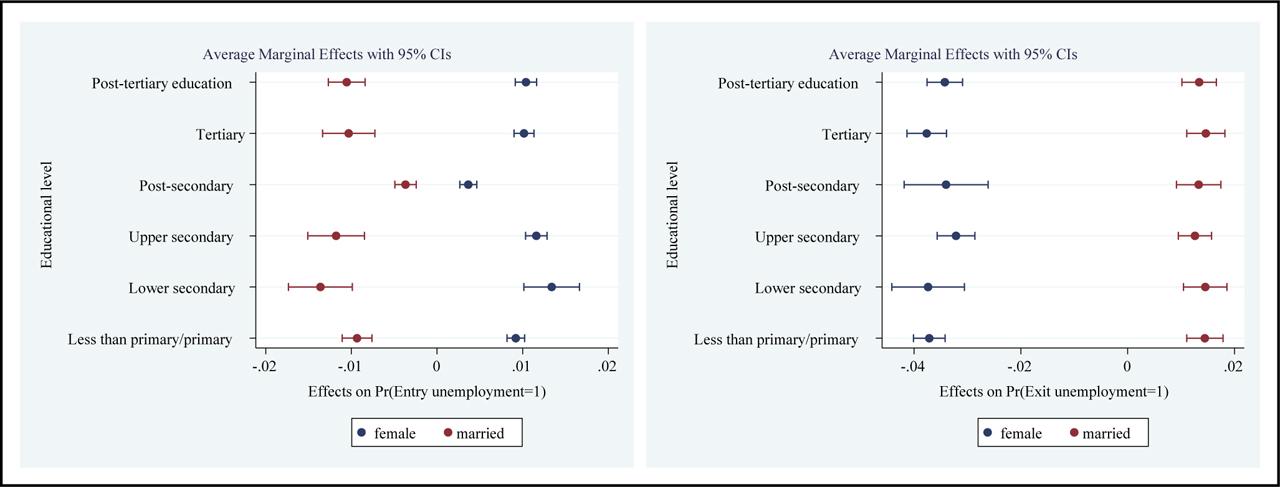
| Female | 2.24*** | 2.58*** | 2.30*** | 2.28*** | 2.24*** | 2.71*** | 2.13*** | 2.28*** |
| Marital status—baseline: non-married | ||||||||
| Married | 0.57*** | 0.45*** | 0.71* | 0.46*** | 0.57*** | 0.44*** | 0.74 | 0.46*** |
| Female # Married | 0.78*** | 1.01 | 0.58*** | 1.04 | 0.78*** | 1.01 | 0.61*** | 1.04 |
| Educational level—baseline: Upper Secondary | ||||||||
| Less than primary/primary | 0.66 | 0.42*** | 0.82 | 0.67 | 0.66 | 0.41 | 0.84 | 0.66 |
| Lower secondary | 1.31 | 1.38 | 1.63 | 0.82 | 1.31 | 1.41 | 1.54 | 0.82 |
| Post-secondary | 0.15*** | 0.20*** | 0.11*** | 0.11*** | 0.15*** | 0.19*** | 0.14* | 0.11*** |
| Tertiary | 0.78*** | 0.64** | 0.99 | 0.57*** | 0.78*** | 0.64*** | 0.99 | 0.57*** |
| Post-tertiary education | 0.82*** | 0.69*** | 0.89 | 0.65*** | 0.82** | 0.68** | 0.90 | 0.65*** |
| Nationality—baseline: Greek | ||||||||
| Immigrant | 2.11*** | 1.06 | 2.38*** | 3.00*** | 2.11*** | 1.07 | 2.20*** | 3.01*** |
| Regions—baseline: Attica | ||||||||
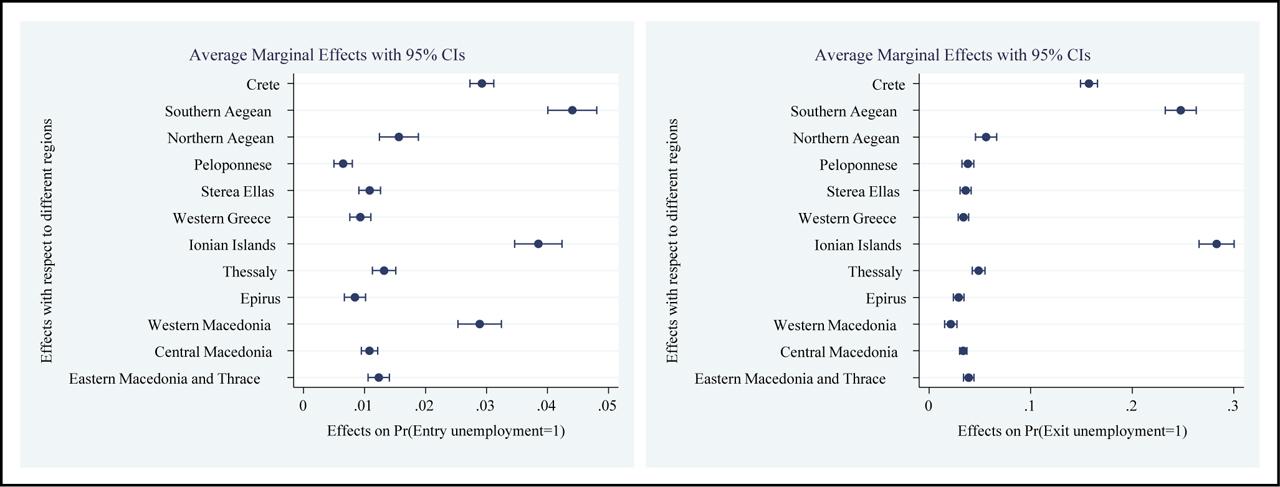
| Eastern Macedonia and Thrace | 3.40*** | 4.76*** | 3.66*** | 2.51*** | 3.40*** | 5.08*** | 3.30*** | 2.52*** |
| Central Macedonia | 3.04*** | 3.82*** | 2.59*** | 4.41*** | 3.04*** | 4.04*** | 2.42*** | 4.41*** |
| Western Macedonia | 8.32*** | 9.30*** | 7.69*** | 13.62*** | 8.32*** | 10.26*** | 6.36*** | 13.64*** |
| Epirus | 2.52*** | 2.45*** | 2.66*** | 2.75*** | 2.52*** | 2.54*** | 2.48*** | 2.75*** |
| Thessaly | 3.61*** | 3.99*** | 3.68*** | 3.92*** | 3.61*** | 4.22*** | 3.31*** | 3.92*** |
| Ionian Islands | 12.12*** | 24.65*** | 10.79*** | 12.22*** | 12.12*** | 28.55*** | 8.73*** | 12.25*** |
| Western Greece | 2.71*** | 2.15*** | 2.70*** | 4.05*** | 2.71*** | 2.22*** | 2.50*** | 4.05*** |
| Sterea Ellas | 3.05*** | 5.32*** | 2.66*** | 2.52*** | 3.05*** | 5.71*** | 2.48*** | 2.52*** |
| Peloponnese | 2.13*** | 2.58*** | 1.85 | 2.62*** | 2.13*** | 2.67*** | 1.79*** | 2.63*** |
| Northern Aegean | 4.22*** | 2.96*** | 3.13*** | 9.91*** | 4.22*** | 3.09*** | 2.87*** | 9.92*** |
| Southern Aegean | 14.66*** | 23.06*** | 15.13*** | 14.22*** | 14.66*** | 26.55*** | 12.04*** | 14.25*** |
| Crete | 8.45*** | 9.38*** | 9.77*** | 9.14*** | 8.45*** | 10.32*** | 7.95*** | 9.16*** |
| Quarter—baseline q2 | ||||||||
| q1 | 2.32*** | 1.84** | 2.05*** | 2.90*** | 2.32*** | 1.88*** | 2.00*** | 2.93*** |
| q3 | 1.02 | 0.86 | 1.15 | 0.96 | 1.02 | 0.84 | 1.19 | 0.97 |
| q4 | 2.12*** | 1.99*** | 1.88*** | 3.28*** | 2.12*** | 2.01*** | 1.89*** | 3.29*** |
| GDP (% dif qoq) | 0.94*** | 1.13*** | 1.01 | 0.96 | 0.94*** | 1.14*** | 1.01 | 0.96 |
| _cons | 0.00 | 0.00 | 0.00 | 0.00 | 0.00 | 0.00 | 0.00 | 0.00 |
| sigma_u | 2.83*** | 2.95*** | 3.07*** | 2.99*** | 2.83*** | 3.15*** | 2.74*** | 2.99*** |
| Rho | 0.71*** | 0.73*** | 0.74*** | 0.73*** | 0.71*** | 0.75*** | 0.69*** | 0.73*** |
| AIC | 124,755 | 31,267 | 66,365 | 26,344 | 124,760 | 31,258 | 66,344 | 26,345 |
| BIC | 125,096 | 31,577 | 66,649 | 26,638 | 125,136 | 31,590 | 66,694 | 26,669 |
Logit analysis of unemployment exits (transitions from unemployment to employment)
| Dependent var: Probability to exit unemployment | Specification 1 | Specification 2 | ||||||
|---|---|---|---|---|---|---|---|---|
| Total Period | Period 1 | Period 2 | Period 3 | Total Period | Period 1 | Period 2 | Period 3 | |
| Minwage (% dif) | 1.04*** | 1.07*** | 1.03*** | 1.04*** | 1.02*** | 1.02 | 1.03** | 1.05** |
| Minwage (% dif) # age group (15–24) | 1.03** | 1.08*** | 1.01 | 1.00 | ||||
| Minwage (% dif) # age group (25–34) | 1.02 | 1.05* | 1.01 | 0.99 | ||||
| Minwage (% dif) # age group (35–49) | 1.01 | 1.05* | 1.01 | 0.99 | ||||
| Age groups—baseline: age group 50+ | ||||||||
| Age group 15–24 | 1.51*** | 1.01 | 1.35*** | 1.76*** | 1.52*** | 0.99 | 1.36*** | 1.76*** |
| Age group 25–34 | 1.71*** | 1.20* | 1.61*** | 1.91*** | 1.71*** | 1.19* | 1.62*** | 1.92*** |
| Age group 35–49 | 1.48*** | 1.16* | 1.49*** | 1.60*** | 1.48*** | 1.15 | 1.50*** | 1.61*** |
| Gender — baseline: male | ||||||||
| Female | 0.71*** | 0.50*** | 0.76*** | 0.92 | 0.71*** | 0.50*** | 0.76*** | 0.92 |
| Marital status—baseline: non-married | ||||||||
| Married | 1.72*** | 1.74*** | 1.62*** | 1.89*** | 1.72*** | 1.74*** | 1.62*** | 1.89*** |
| Female # Married | 0.54*** | 0.54*** | 0.53*** | 0.49*** | 0.54*** | 0.54*** | 0.53*** | 0.49*** |
| Educational level—baseline: Upper Secondary | ||||||||
| Less than primary/primary | 1.30*** | 1.56*** | 1.25* | 1.10 | 1.30*** | 1.56*** | 1.25* | 1.10 |
| Lower secondary | 1.31 | 2.57*** | 0.99 | 0.28* | 1.31 | 2.56*** | 0.99 | 0.28* |
| Post-secondary | 1.10 | 1.29 | 1.02 | 0.52 | 1.10 | 1.28 | 1.02 | 0.52 |
| Tertiary | 1.33*** | 1.34** | 1.37*** | 1.24** | 1.33** | 1.34** | 1.37** | 1.25** |
| Post-tertiary education | 1.12** | 1.42** | 1.08** | 1.00 | 1.12** | 1.42** | 1.08** | 1.00 |
| Nationality—baseline: Greek | ||||||||
| Immigrant | 1.91*** | 1.98*** | 1.91*** | 2.36*** | 1.91*** | 1.98*** | 1.91*** | 2.36*** |
| Regions—baseline: Attica | ||||||||
| Eastern Macedonia and Thrace | 2.54*** | 2.17*** | 2.96*** | 2.28*** | 2.55*** | 2.17*** | 2.96*** | 2.28*** |
| Central Macedonia | 2.30*** | 2.11*** | 2.16*** | 2.74*** | 2.30*** | 2.11*** | 2.16*** | 2.74*** |
| Western Macedonia | 1.79*** | 1.30* | 1.87*** | 2.13*** | 1.79*** | 1.29* | 1.87*** | 2.14*** |
| Epirus | 2.11*** | 1.05 | 2.84*** | 2.39*** | 2.11*** | 1.05 | 2.84*** | 2.39*** |
| Thessaly | 3.00*** | 1.77*** | 3.87*** | 3.04*** | 3.00*** | 1.77*** | 3.87*** | 3.04*** |
| Ionian Islands | 26.76*** | 11.17*** | 22.41*** | 67.17*** | 26.74*** | 11.14*** | 22.38*** | 67.25*** |
| Western Greece | 2.31*** | 1.67*** | 2.88*** | 2.25*** | 2.31*** | 1.67*** | 2.88*** | 2.26*** |
| Sterea Ellas | 2.41*** | 2.32*** | 2.17*** | 2.87*** | 2.41*** | 2.32*** | 2.17*** | 2.87*** |
| Peloponnese | 2.51*** | 2.02*** | 2.51*** | 3.02*** | 2.51*** | 2.02*** | 2.52*** | 3.02*** |
| Northern Aegean | 3.37*** | 2.46*** | 3.55*** | 4.73*** | 3.37*** | 2.45*** | 3.55*** | 4.74*** |
| Southern Aegean | 21.05*** | 16.01*** | 19.25*** | 27.92*** | 21.06*** | 15.92*** | 19.25*** | 27.91*** |
| Crete | 10.45*** | 11.82*** | 7.79*** | 15.58*** | 10.44*** | 11.80*** | 7.79*** | 15.58*** |
| Quarter—baseline q2 | ||||||||
| q1 | 0.36*** | 0.38*** | 0.36*** | 0.30*** | 0.36*** | 0.38*** | 0.36*** | 0.30*** |
| q3 | 0.76*** | 0.58*** | 0.82*** | 0.72*** | 0.76*** | 0.58*** | 0.82*** | 0.72*** |
| q4 | 0.55*** | 0.57*** | 0.58*** | 0.49*** | 0.55*** | 0.58*** | 0.58*** | 0.49*** |
| GDP (% dif qoq) | 1.19*** | 1.11*** | 1.07*** | 0.99 | 1.19*** | 1.11*** | 1.07*** | 0.99 |
| _cons | 0.01*** | 0.04*** | 0.01*** | 0.01*** | 0.01*** | 0.04*** | 0.01*** | 0.01*** |
| sigma_u | 1.50*** | 1.15*** | 1.49*** | 1.67*** | 1.50*** | 1.15*** | 1.49*** | 1.6685 |
| Rho | 0.40*** | 0.29*** | 0.40*** | 0.46*** | 0.41*** | 0.29*** | 0.40*** | 0.4583 |
| AIC | 95,863 | 25,065 | 46,559 | 23,429 | 95,861 | 25,059 | 46,564 | 23,435 |
| BIC | 96,182 | 25,333 | 46,859 | 23,706 | 96,211 | 25,353 | 46,893 | 23,739 |