
Table 1
Average yearly equivalized income and net taxes in Lithuania, Euro
| Variable | Full sample (population) | Working sample (18–62, nonstudent) |
|---|---|---|
| Gross employment income | 7,663 | 8,952 |
| Net taxes (minus) | 1,045 | 1,944 |
| Net labor income | 6,618 | 7,008 |
| Number of households | 9,657 | 6,459 |
[i] Note: income variables are bolded while the number of households is in italics. Figures come from the EU-SILC dataset for Lithuania for income reference years of 2014–2015.
[ii] Data for 2014–2015 income reference years comes from the EU-SILC dataset. Gross employment income and net taxes include employer's and employee's social contributions.
Table 2
Detailed equivalized income and net tax in Lithuania, percentage of gross employment income
| Variable | Full sample (population) | Working sample (18–62, nonstudent) |
|---|---|---|
| Gross employee income | 88 | 88 |
| Gross self-employed income | 12 | 12 |
| Gross employment income | 100 | 100 |
| Old-age public transfer | 12 | 4 |
| Other public transfers | 9 | 8 |
| Gross labor income | 121 | 113 |
| Tax on income and social insurance contributions | −34 | −34 |
| Net labor income | 86 | 78 |
| Number of households | 9,657 | 6,459 |
[i] Note: income variables are bolded when they are aggregates of preceding variables, while the number of households is in italics. Figures come from the EU-SILC dataset for Lithuania for income reference years of 2014–2015.
[ii] All variables are in percent of gross employment income. Data for the income reference years of 2014–2015 comes from EU-SILC. Gross employment income and its components include employer's and employee's social contributions.
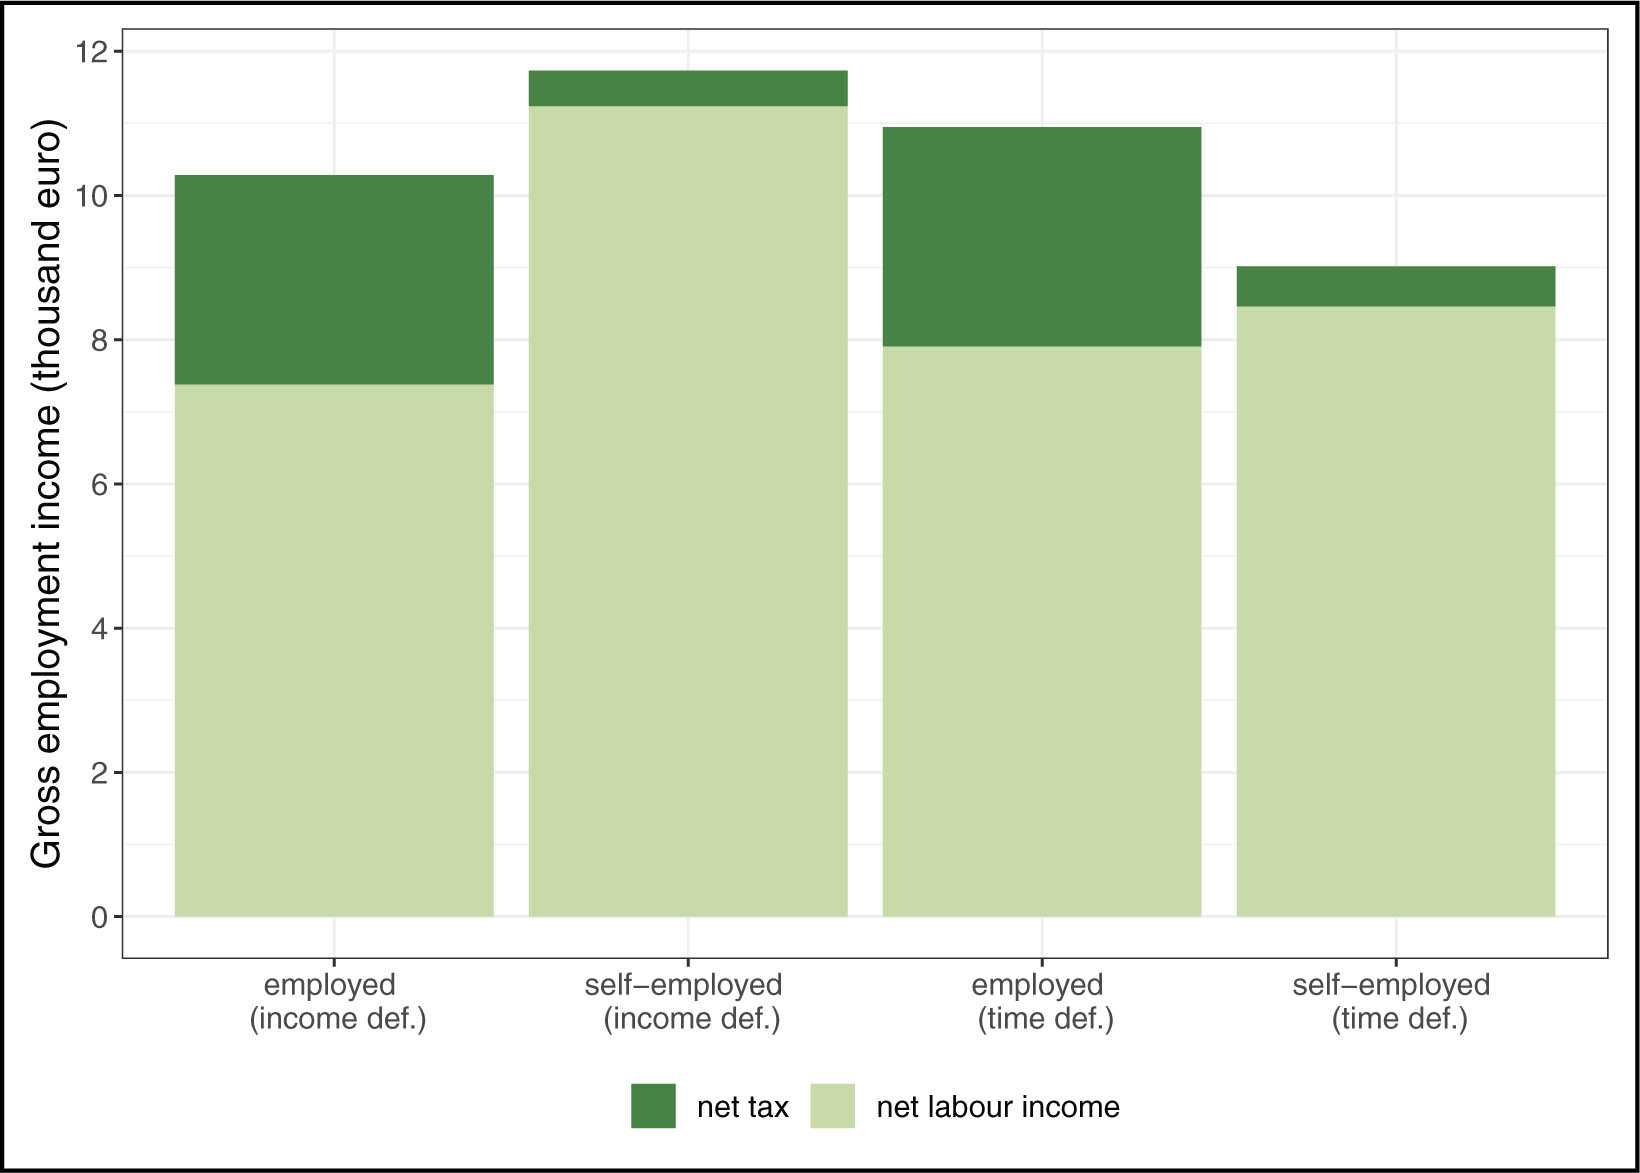
Figure 1
Average equivalized yearly income in Lithuania for 2014–2015 reference years.
Bars represent average equivalized income for employee and self-employed households under two grouping definitions: income definition and time definitions. The sum of equivalized net labor income and equivalized net tax is equivalized gross employment income. Calculations are based on the working sample. There are 264 households that fall under the time definition for the self-employed and 545 under the income definition (4,566 and 4,889 for the employees, respectively).
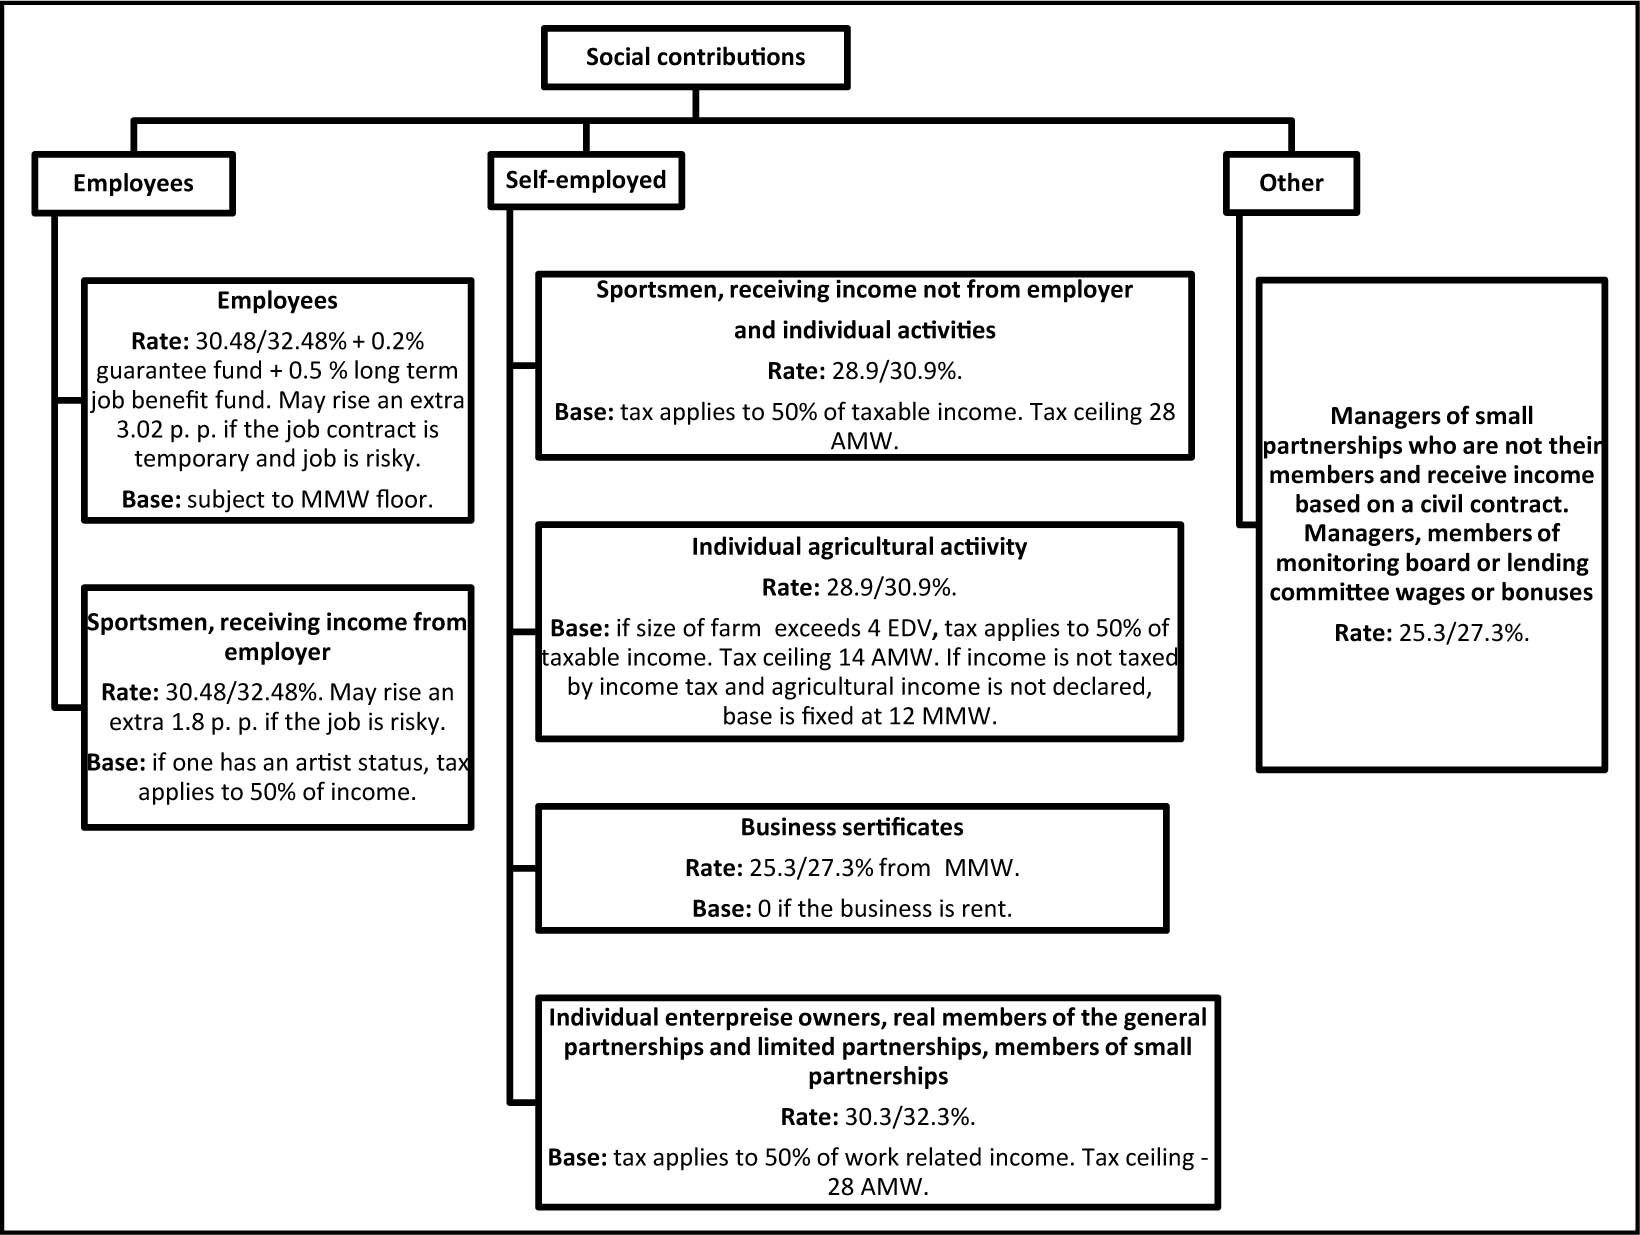
Figure 2
Statutory social insurance contributions excluding the statutory health insurance contributions prior to 2019 reform.
AMW, average monthly wage; MMW, monthly minimum wage. Sources: Based on state tax inspectorate of Lithuania.
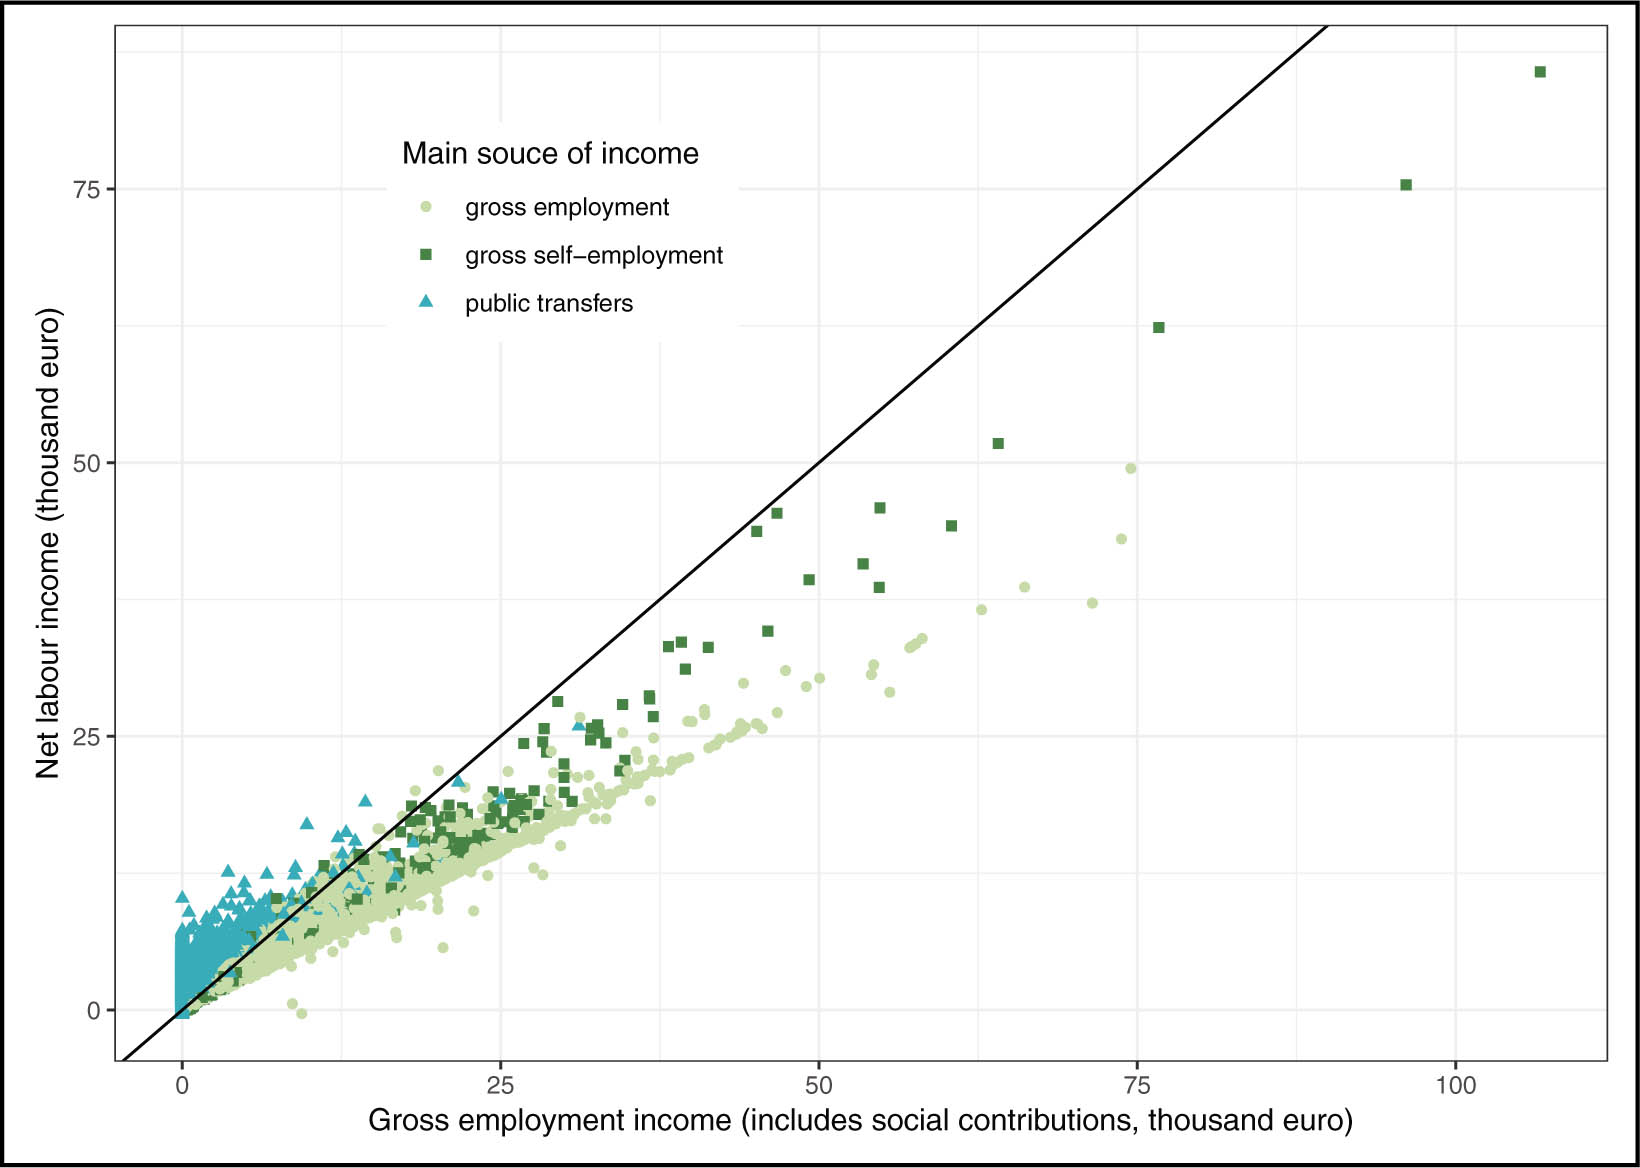
Figure 3
Statutory equivalized incomes of households grouped using the income definition in Lithuania.
Equivalized gross employment income and net labor income is in thousands of Euros per year. Households are allocated to groups according to the income definition for 2014–2015 income reference years and are represented by dots in the graph (see Section 2). The diagonal line illustrates that household employment income is equal to net labor income. Any dot above the diagonal line illustrates that the household receives additional benefits, whereas dots under the horizontal line mean that the household pays additional taxes or social contributions.
Table 3
Statutory equivalized gross employment income, net taxes, and net labor income in thousand Euro per year.
| Percentile | Gross employment | Net taxes | Net labor income | ||||
|---|---|---|---|---|---|---|---|
| Income | All | Employees | Self-employed | All | Employees | Self-employed | |
| 0–7 | 0.00 | −2.25 | 2.25 | ||||
| −20 | 1.41 | −1.12 | 0.25 | 0.42 | 2.53 | 1.72 | 1.19 |
| −30 | 3.59 | 0.07 | 0.76 | 0.70 | 3.52 | 2.86 | 2.95 |
| −40 | 5.10 | 0.78 | 1.29 | 1.01 | 4.32 | 3.81 | 4.14 |
| −50 | 6.61 | 1.54 | 1.80 | 1.32 | 5.07 | 4.79 | 5.27 |
| −60 | 8.22 | 2.29 | 2.48 | 1.86 | 5.93 | 5.73 | 6.34 |
| −70 | 10.08 | 3.03 | 3.16 | 2.83 | 7.05 | 6.96 | 7.03 |
| −80 | 12.36 | 4.08 | 4.28 | 2.91 | 8.28 | 8.08 | 9.39 |
| −90 | 15.69 | 5.67 | 5.86 | 4.09 | 10.02 | 9.84 | 11.50 |
| −100 | 27.65 | 10.29 | 10.91 | 7.02 | 17.36 | 16.65 | 21.21 |
[i] Data is sorted according to equivalized gross employment income (includes social contributions). Net taxes include tax minus public benefits (public transfers). Net labor income is gross employment income plus benefits minus taxes. We report averages of percentile ranges. Gross employment income is taken from EU-SILC, whereas net taxes are estimated by EUROMOD, which takes into account various individual and household characteristics (e.g., age, health status). All figures are taken from EUROMOD and are weighted to include only those households with at least one member who is aged 18–62 and is not a student. The number of observations per decile is available in Table A1 in Appendix.
Table 4
Household statutory average net tax rates in Lithuania, net taxes as a share of gross employment income
| 2*percentile | Net taxes | Taxes | Public transfers | ||||
|---|---|---|---|---|---|---|---|
| All | Employees | Self-employed | Employees | Self-employed | Employees | Self-employed | |
| 0–7 | |||||||
| −20 | −1.121 | −0.106 | 0.171 | 0.336 | 0.340 | 0.442 | 0.169 |
| −30 | −0.018 | 0.076 | 0.104 | 0.369 | 0.303 | 0.293 | 0.199 |
| −40 | 0.130 | 0.168 | 0.104 | 0.379 | 0.314 | 0.211 | 0.210 |
| −50 | 0.222 | 0.237 | 0.138 | 0.395 | 0.287 | 0.158 | 0.149 |
| −60 | 0.270 | 0.281 | 0.200 | 0.400 | 0.286 | 0.119 | 0.086 |
| −70 | 0.293 | 0.301 | 0.277 | 0.400 | 0.318 | 0.099 | 0.041 |
| −80 | 0.326 | 0.335 | 0.226 | 0.411 | 0.293 | 0.076 | 0.068 |
| −90 | 0.355 | 0.366 | 0.257 | 0.412 | 0.300 | 0.046 | 0.043 |
| −100 | 0.367 | 0.393 | 0.238 | 0.419 | 0.276 | 0.026 | 0.037 |
[i] Percentiles are sorted by gross employment income (includes social contributions). Taxes include income tax and social contributions. Public transfers include old-age, disability, unemployment, and other benefits. Net taxes are taxes minus public benefits. Gross employment income is taken from EU-SILC, while all other figures are estimated by EUROMOD, which takes into account various individual and household characteristics (e.g., age, health status). Number of observations per decile is available in Table A1 in Appendix.
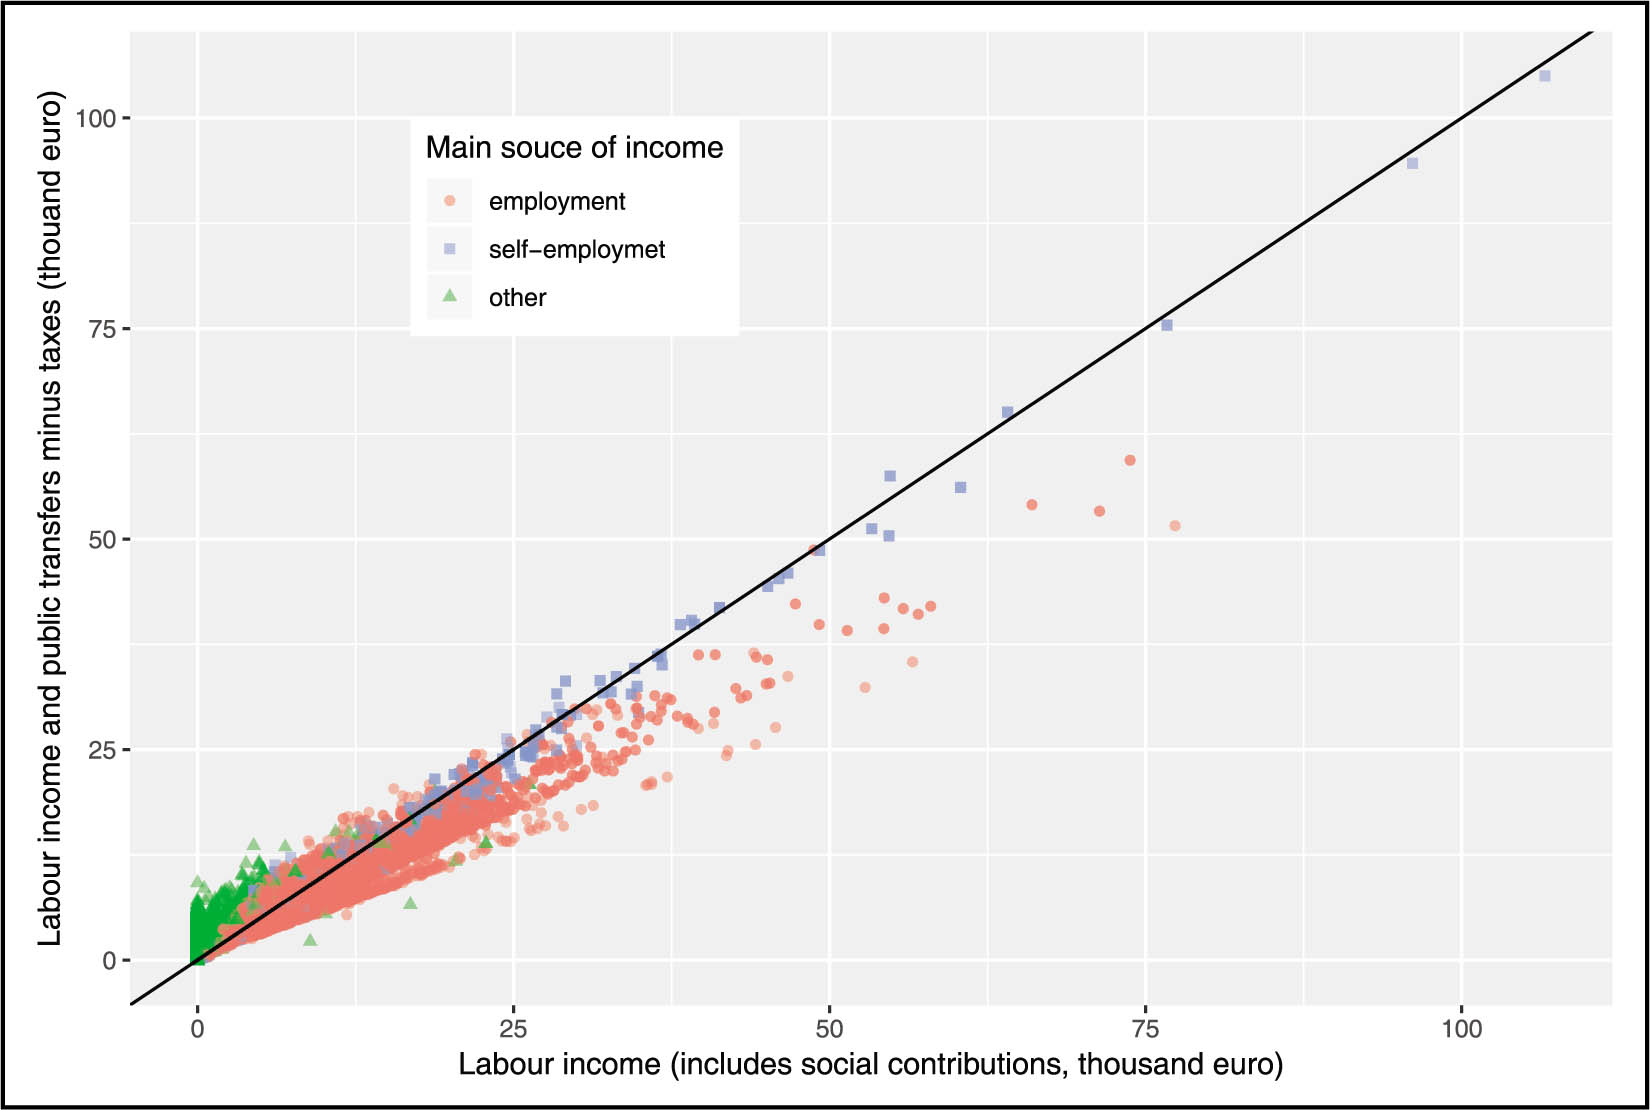
Figure 4
Effective equivalized incomes of households grouped using the income definition in Lithuania.
Equivalized gross employment income and net labor income is in thousands of Euro per year. Households are allocated to employment groups according to the income definition for the 2014–2015 income reference years and are represented by dots in the graph (see Section 2). The diagonal line illustrates that what a household earns from employment is what it receives as its net labor income. Any dot above the diagonal line illustrates that the household receives additional benefits, while dots under the horizontal line means that the households pay additional taxes or social contributions.
Table 5
Household average effective net tax rates in Lithuania, net taxes as a share of gross employment income
| 2*percentile | Net taxes | Taxes | Public transfers | ||||
|---|---|---|---|---|---|---|---|
| All | Employees | Self-employed | Employees | Self-employed | Employees | Self-employed | |
| 0–7 | |||||||
| −20 | −0.812 | −0.095 | −0.113 | 0.320 | 0.122 | 0.416 | 0.235 |
| −30 | −0.041 | 0.041 | −0.101 | 0.331 | 0.130 | 0.290 | 0.231 |
| −40 | 0.074 | 0.119 | −0.144 | 0.327 | 0.167 | 0.207 | 0.310 |
| −50 | 0.191 | 0.205 | 0.006 | 0.352 | 0.141 | 0.147 | 0.135 |
| −60 | 0.219 | 0.241 | −0.005 | 0.365 | 0.103 | 0.123 | 0.108 |
| −70 | 0.242 | 0.267 | 0.083 | 0.364 | 0.124 | 0.097 | 0.041 |
| −80 | 0.278 | 0.297 | 0.048 | 0.373 | 0.106 | 0.076 | 0.058 |
| −90 | 0.313 | 0.336 | 0.057 | 0.387 | 0.098 | 0.050 | 0.041 |
| −100 | 0.313 | 0.359 | 0.070 | 0.385 | 0.101 | 0.026 | 0.032 |
[i] Percentiles are sorted by gross employment income (which includes social contributions). Taxes include income tax and social contributions. Public transfers include old-age, disability, unemployment, and other public benefits. Net taxes are taxes minus public benefits. All figures are taken from EU-SILC and are weighted to include only those households with at least one member aged 18–62 and who is not a student. The number of observations per decile is available in Table A2 in Appendix.
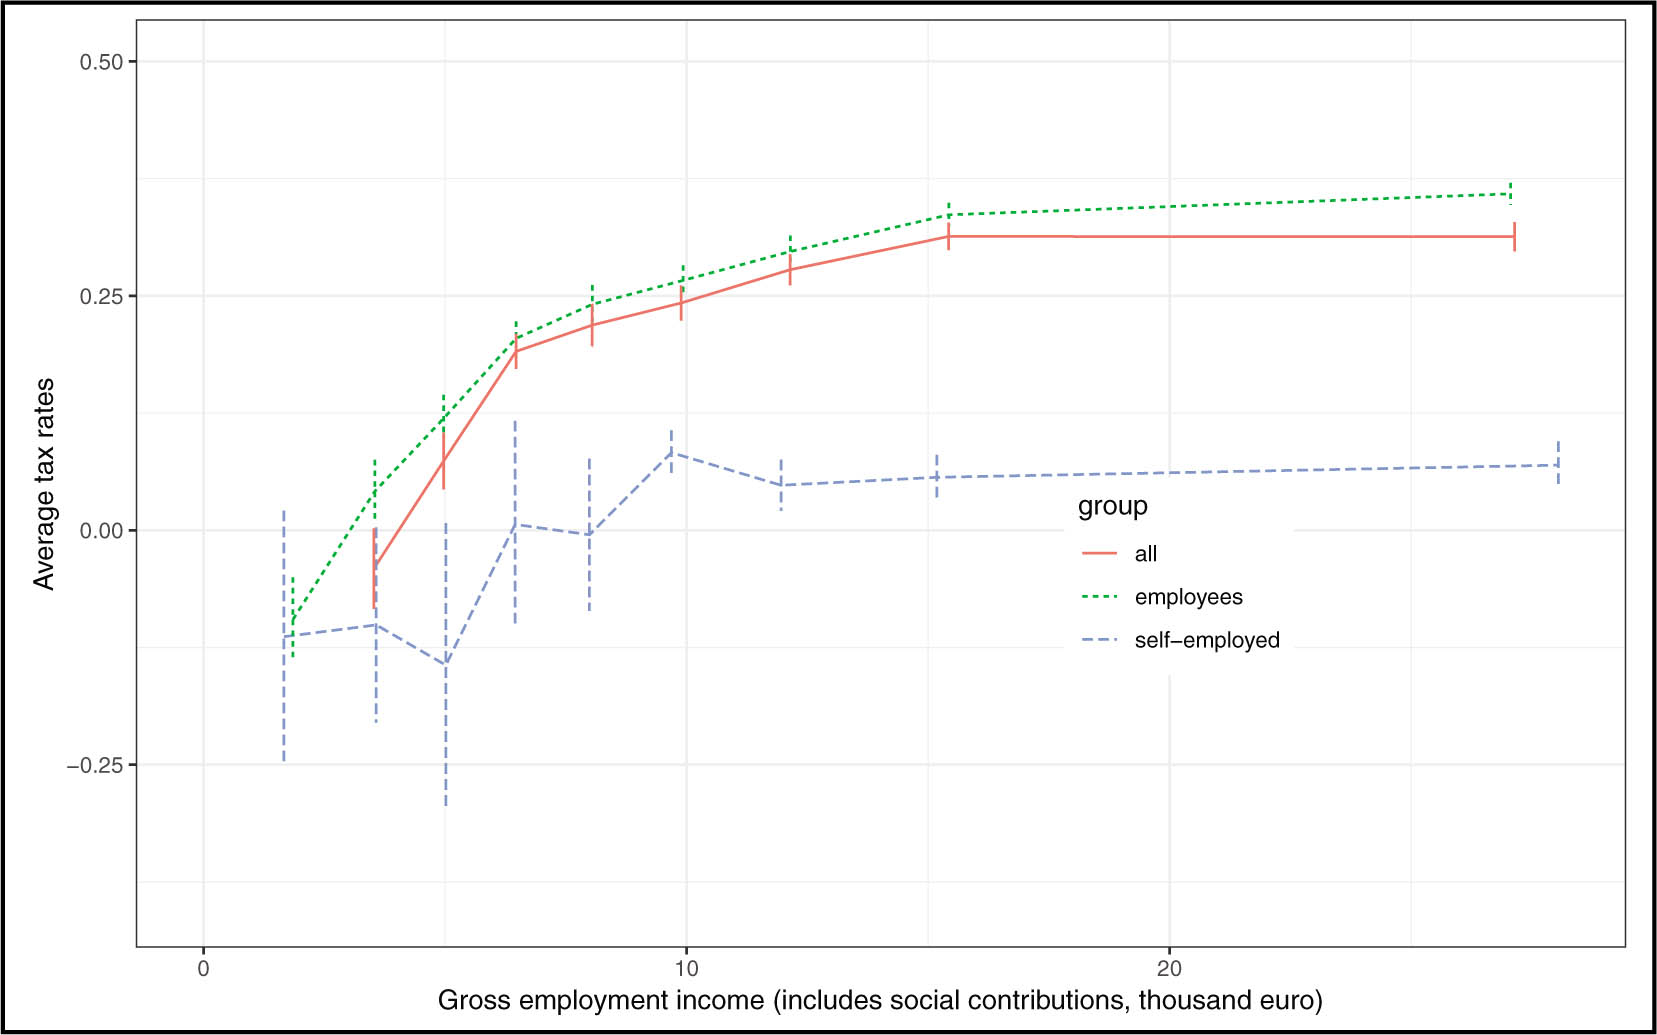
Figure 5
Net taxes are higher and more progressive for employees than for the self-employed.
Standard errors were compiled taking into account survey design with the help of codes from Goedemé (2013) and Zardo Trindade and Goedemé (2016) and computed using Lumley (2018) R package as described in Lumley (2004). We use 95% confidence intervals.
Table 6
Intensive and extensive elasticities as proposed by Saez (2002)
| High income (w ≥ 20,000 $) | Low income (w < 20,000 $) | |
|---|---|---|
| η | 0 | [0–1] |
| ɛ | [0.25–0.5] | [0.25–0.5] |
[i] The table indicates a range of possible elasticities for the United States.
Table 7
Ranges of elasticities of taxable income for Lithuania
| High income (w ≥ 12,000 Euro) | Low income (w < 12,000 Euro) | |
|---|---|---|
| η | [0.2, 0.3, 0.5] | [0.2, 0.4, 0.6] |
| ɛ | [0.1, 0.2, 0.3] | [0.02, 0.1, 0.2] |
[i] Note: non bolded values represent intervals while bolded variables represent the chosen point estimate.
[ii] The preferred taxable income elasticities for Lithuania are represented in bold characters whereas the range of possible elasticities is in brackets. w is equivalized employment income, which includes employer's and employee's social contributions.
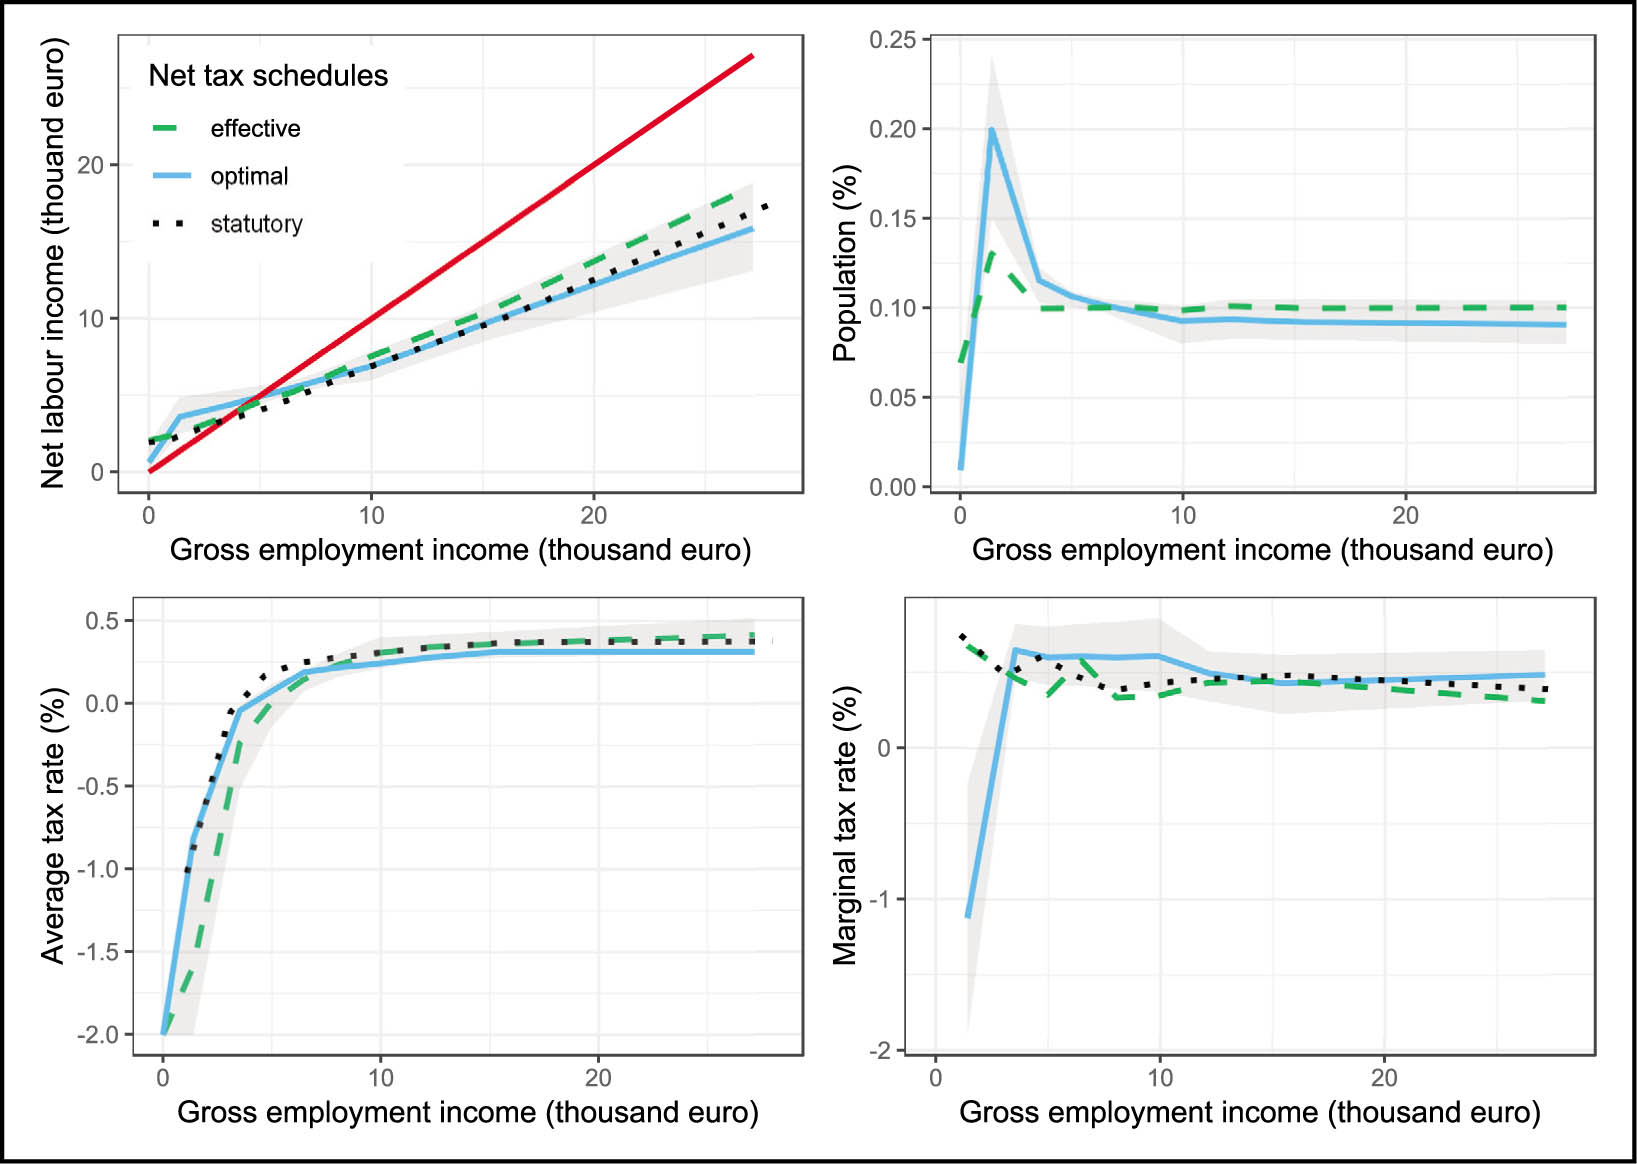
Figure 6
Optimal, effective, and statutory net tax schedules.
In each graph, the optimal net tax schedule with the preferred parameter specification (see Table 7) is depicted by a blue line while alternative parameter choices are presented as a shaded area around the blue line. The green dashed line and the black dotted line represents the variables distributions in line with the effective and statutory tax schedules respectively. The diagonal red line on the top-left figure is a 45-degree line depicting zero net taxes.
Table 8
Effective and optimal variables for Lithuania
| 2*percentile | Gross employment income | Net labor incomea | Net labor incomeb | Percent of householdsa | Percent of householdsb | Average tax ratea | Average >tax rateb | Marginal tax ratea | Marginal tax rateb |
|---|---|---|---|---|---|---|---|---|---|
| 0–7 | 0.0 | 2.1 | 0.6 | 6.9 | 0.9 | ||||
| −20 | 1.4 | 2.5 | 3.6 | 13.0 | 20.0 | −81.2 | −158.5 | 67.7 | −112.4 |
| −30 | 3.5 | 3.7 | 4.4 | 10.0 | 11.5 | −4.1 | −23.5 | 46.4 | 64.8 |
| −40 | 5.0 | 4.6 | 4.9 | 10.0 | 10.7 | 7.4 | 0.8 | 35.4 | 60.1 |
| −50 | 6.5 | 5.2 | 5.5 | 10.0 | 10.1 | 19.1 | 14.7 | 57.9 | 60.7 |
| −60 | 8.0 | 6.3 | 6.2 | 10.0 | 9.8 | 21.9 | 23.6 | 33.4 | 60.1 |
| −70 | 9.9 | 7.5 | 6.9 | 9.9 | 9.3 | 24.2 | 30.5 | 34.6 | 60.9 |
| −80 | 12.1 | 8.8 | 8.0 | 10.1 | 9.4 | 27.8 | 34.1 | 43.3 | 49.7 |
| −90 | 15.4 | 10.6 | 9.9 | 10.0 | 9.2 | 31.3 | 36.0 | 44.5 | 42.9 |
| −100 | 27.1 | 18.6 | 15.9 | 10.0 | 9.1 | 31.3 | 41.4 | 31.3 | 48.7 |
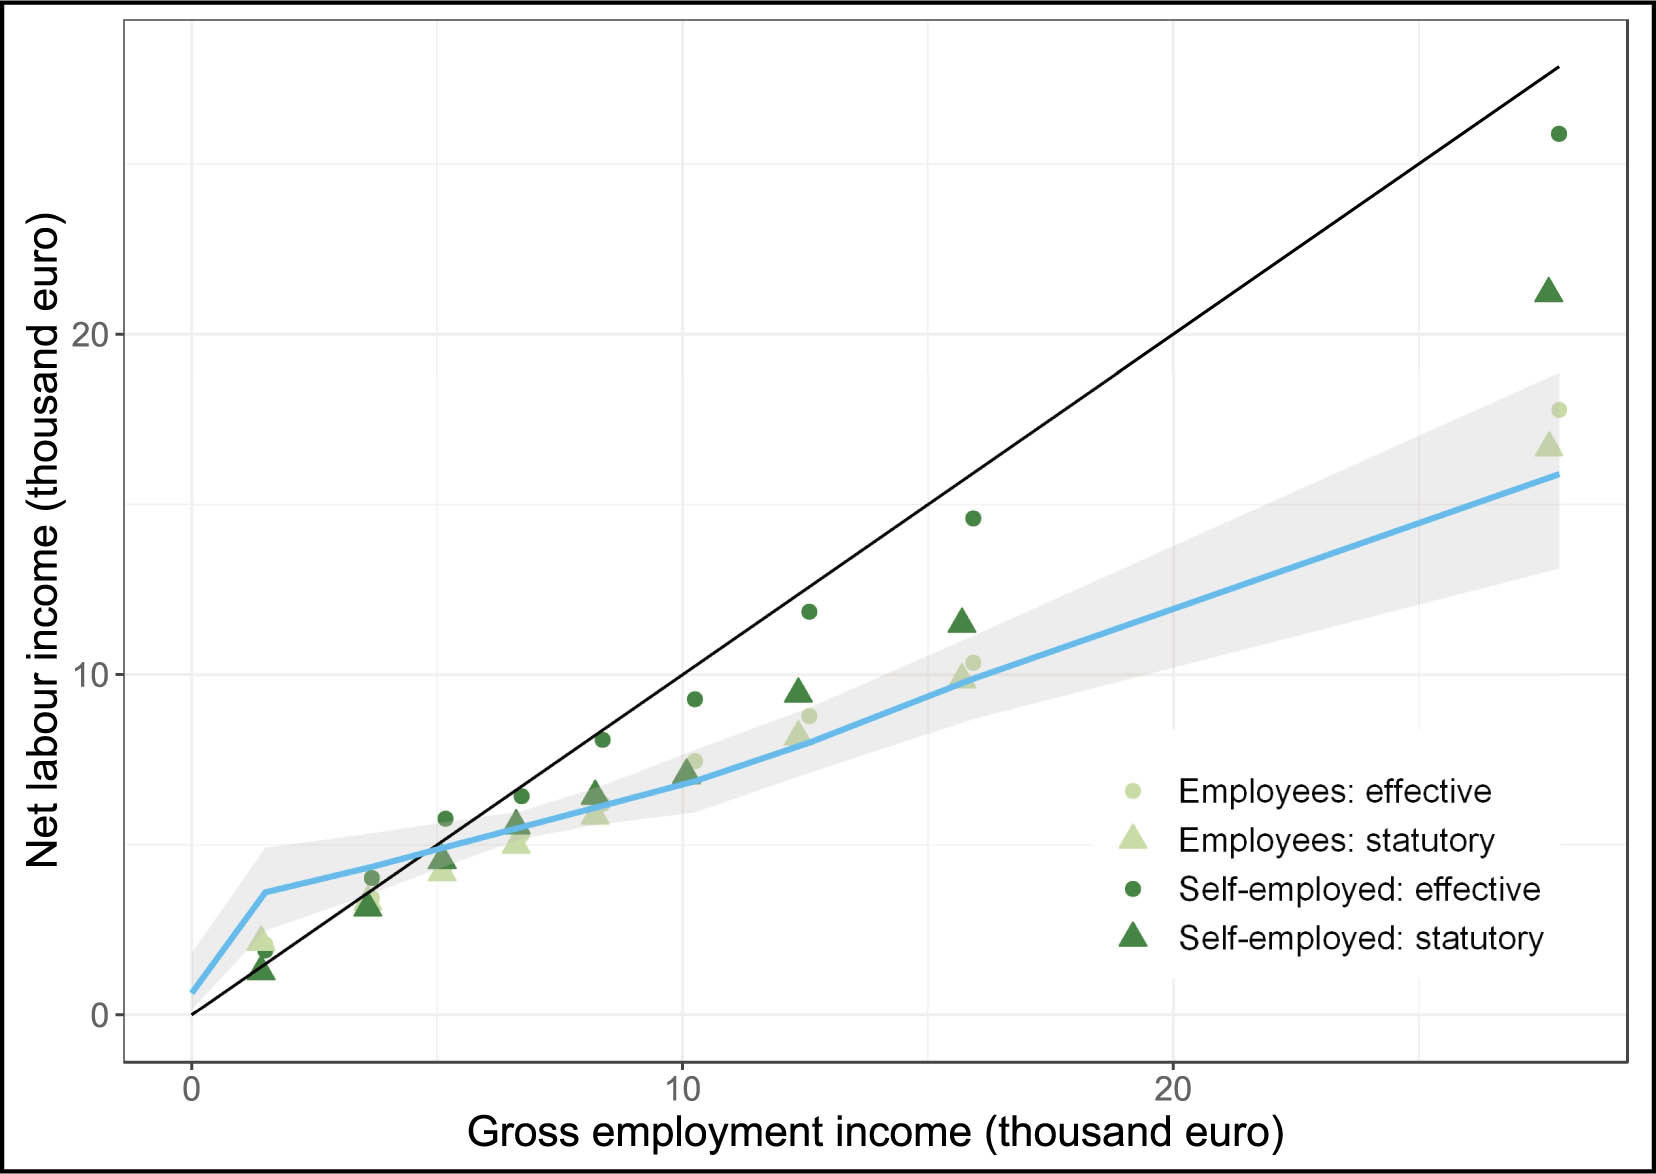
Figure 7
Statutory, effective, and optimal equivalized tax schedules for households grouped according to income.
The graph illustrates how household's equivalized gross employment income translates into equivalized net labor income for three tax schedules: effective, statutory, and optimal. The effective and statutory tax schedules are presented as points (for each decile) for employees and the self-employed. The optimal tax schedule is calculated for the total population aged 18–62, and excludes students. The shaded area around the dashed blue line illustrates a range of optimal tax schedules using a range of parameters as shown in Table 7. The data comes from EU-SILC, the simulation was carried out with the help of EUROMOD, and the optimal tax schedule was computed along the lines of Saez (2002).
Table 9
Estimated difference between statutory and effective tax schedules per equivalized household per year
| 2*percentile | % of statutory tax | Th. Euro | ||
|---|---|---|---|---|
| Employees | Self-employed | Employees | Self-employed | |
| −7 | ||||
| −20 | 4.76 | 64.12 | 0.02 | 0.28 |
| −30 | 10.30 | 57.10 | 0.14 | 0.62 |
| −40 | 13.72 | 46.82 | 0.27 | 0.75 |
| −50 | 10.89 | 50.87 | 0.28 | 0.96 |
| −60 | 8.75 | 63.99 | 0.29 | 1.50 |
| −70 | 9.00 | 61.01 | 0.36 | 1.96 |
| −80 | 9.25 | 63.95 | 0.47 | 2.33 |
| −90 | 6.07 | 67.33 | 0.39 | 3.17 |
| −100 | 8.11 | 63.41 | 0.94 | 4.83 |
Table A1
Number of observations per decile from EUROMOD output
| Percentile | Gross employment income | Total observations | Employed | Self-employed |
|---|---|---|---|---|
| 0–7 | 0 | 690 | 0 | 0 |
| −20 | 1,413 | 784 | 174 | 20–49 |
| −30 | 3,588 | 649 | 385 | 59 |
| −40 | 5,102 | 649 | 462 | 20–49 |
| −50 | 6,609 | 641 | 543 | 20–49 |
| −60 | 8,219 | 635 | 559 | 20–49 |
| −70 | 10,080 | 626 | 557 | 20–49 |
| −80 | 12,357 | 615 | 545 | 52 |
| −90 | 15,690 | 635 | 578 | 20–49 |
| −100 | 27,651 | 572 | 461 | 107 |
[i] Data is sorted according to equivalized gross employment income (includes social contributions that are evaluated by EUROMOD). All figures are taken from EUROMOD and are weighted to include only those households with at least one member who is 18–62 years old and is not a student. Deciles are based on weighted observations, which results in different number of observations per quantile; 20–49 indicates that there are between 20 and 49 (inclusive) number of observations, although the number is not publishable due to confidentially reasons. The first 7 percentiles do not have any gross employment income.
Table A2
Number of observations per decile from EU-SILC
| Percentile | Gross employment income | Total observations | Employed | Self-employed |
|---|---|---|---|---|
| 0–7 | 0 | 680 | 0 | 0 |
| −20 | 1,395 | 787 | 300 | 20–49 |
| −30 | 3,525 | 629 | 501 | 60 |
| −40 | 4,972 | 636 | 557 | 20–49 |
| −50 | 6,470 | 653 | 602 | 20–49 |
| −60 | 8,047 | 631 | 576 | 20–49 |
| −70 | 9,888 | 623 | 569 | 20–49 |
| −80 | 12,141 | 619 | 557 | 55 |
| −90 | 15,425 | 625 | 569 | 20–49 |
| −100 | 27,143 | 576 | 467 | 107 |
[i] Data is sorted according to equivalized gross employment income (includes social contributions). All figures are taken from EUROMOD and are weighted to include only those households with at least 1 member who is 18–62 years old and is not a student. Deciles are based on weighted observations, which results in different number of observations per quantile; 20–49 indicates that there are between 20 and 49 (inclusive) number of observations, although the number is not publishable due to confidentially reasons. The first 7 percentiles do not have any gross employment income.
Table A3
Household statutory average net tax rates in Lithuania, net taxes as a share of gross employment income.
| Percentile | Net taxes | Taxes | Public transfers | ||||
|---|---|---|---|---|---|---|---|
| All | Employees | Self-employed | Employees | Self-employed | Employees | Self-employed | |
| 0–24 | |||||||
| −50 | −0.946 [996] | −0.006 [281] | −0.012 [60] | 0.354 [281] | 0.327 [60] | 0.361 [281] | 0.339 [60] |
| −75 | 0.116 [720] | 0.170 [599] | 0.003 [53] | 0.398 [599] | 0.303 [53] | 0.229 [599] | 0.300 [53] |
| −100 | 0.293 [653] | 0.312 [577] | 0.207 [68] | 0.419 [577] | 0.295 [68] | 0.106 [577] | 0.088 [68] |
[i] Our sample is restricted to households with one household member aged 18–62, but can include older and younger household members as well. Percentiles are sorted by gross employment income (includes social contributions). Taxes include income tax and social contributions. Public transfers include old-age, disability, unemployment, and other benefits. Net taxes are taxes minus public benefits. Gross employment income is taken from EU-SILC, whereas all other figures are estimated by EUROMOD, which takes into account various individual and household characteristics (e.g., age, health status). All figures are taken from EU-SILC and are weighted to include only those households with one member aged 18–62 and who is not a student, but older and younger household members may be present. The number of observations per quantile is in []. EU-SILC, European Union Statistics on Income and Living Conditions.
Table A4
Household average effective net tax rates in Lithuania, net taxes as a share of gross employment income. Sample restricted to households with 1 household member aged 18–62, but can include older and younger household members as well
| Percentile | Net taxes | Taxes | Public transfers | ||||
|---|---|---|---|---|---|---|---|
| All | Employees | Self-employed | Employees | self-employed | Employees | Self-employed | |
| 0–24 | |||||||
| −50 | −0.522 [996] | −0.064 [287] | −0.190 [55] | 0.316 [287] | 0.117 [55] | 0.380 [287] | 0.307 [55] |
| −75 | 0.142 [721] | 0.173 [605] | −0.115 [51] | 0.362 [605] | 0.105 [51] | 0.188 [605] | 0.221 [51] |
| −100 | 0.285 [653] | 0.323 [576] | 0.018 [68] | 0.399 [576] | 0.082 [68] | 0.076 [576] | 0.064 [68] |
[i] Percentiles are sorted by gross employment income (which includes social contributions). Taxes include income tax and social contributions. Public transfers include old-age, disability, unemployment, and other public benefits. Net taxes are taxes minus public benefits. All figures are taken from EU-SILC and are weighted to include only those households with one member aged 18–62 and is not a student. The number of observations per quantile is in []. EU-SILC, European Union Statistics on Income and Living Conditions.