
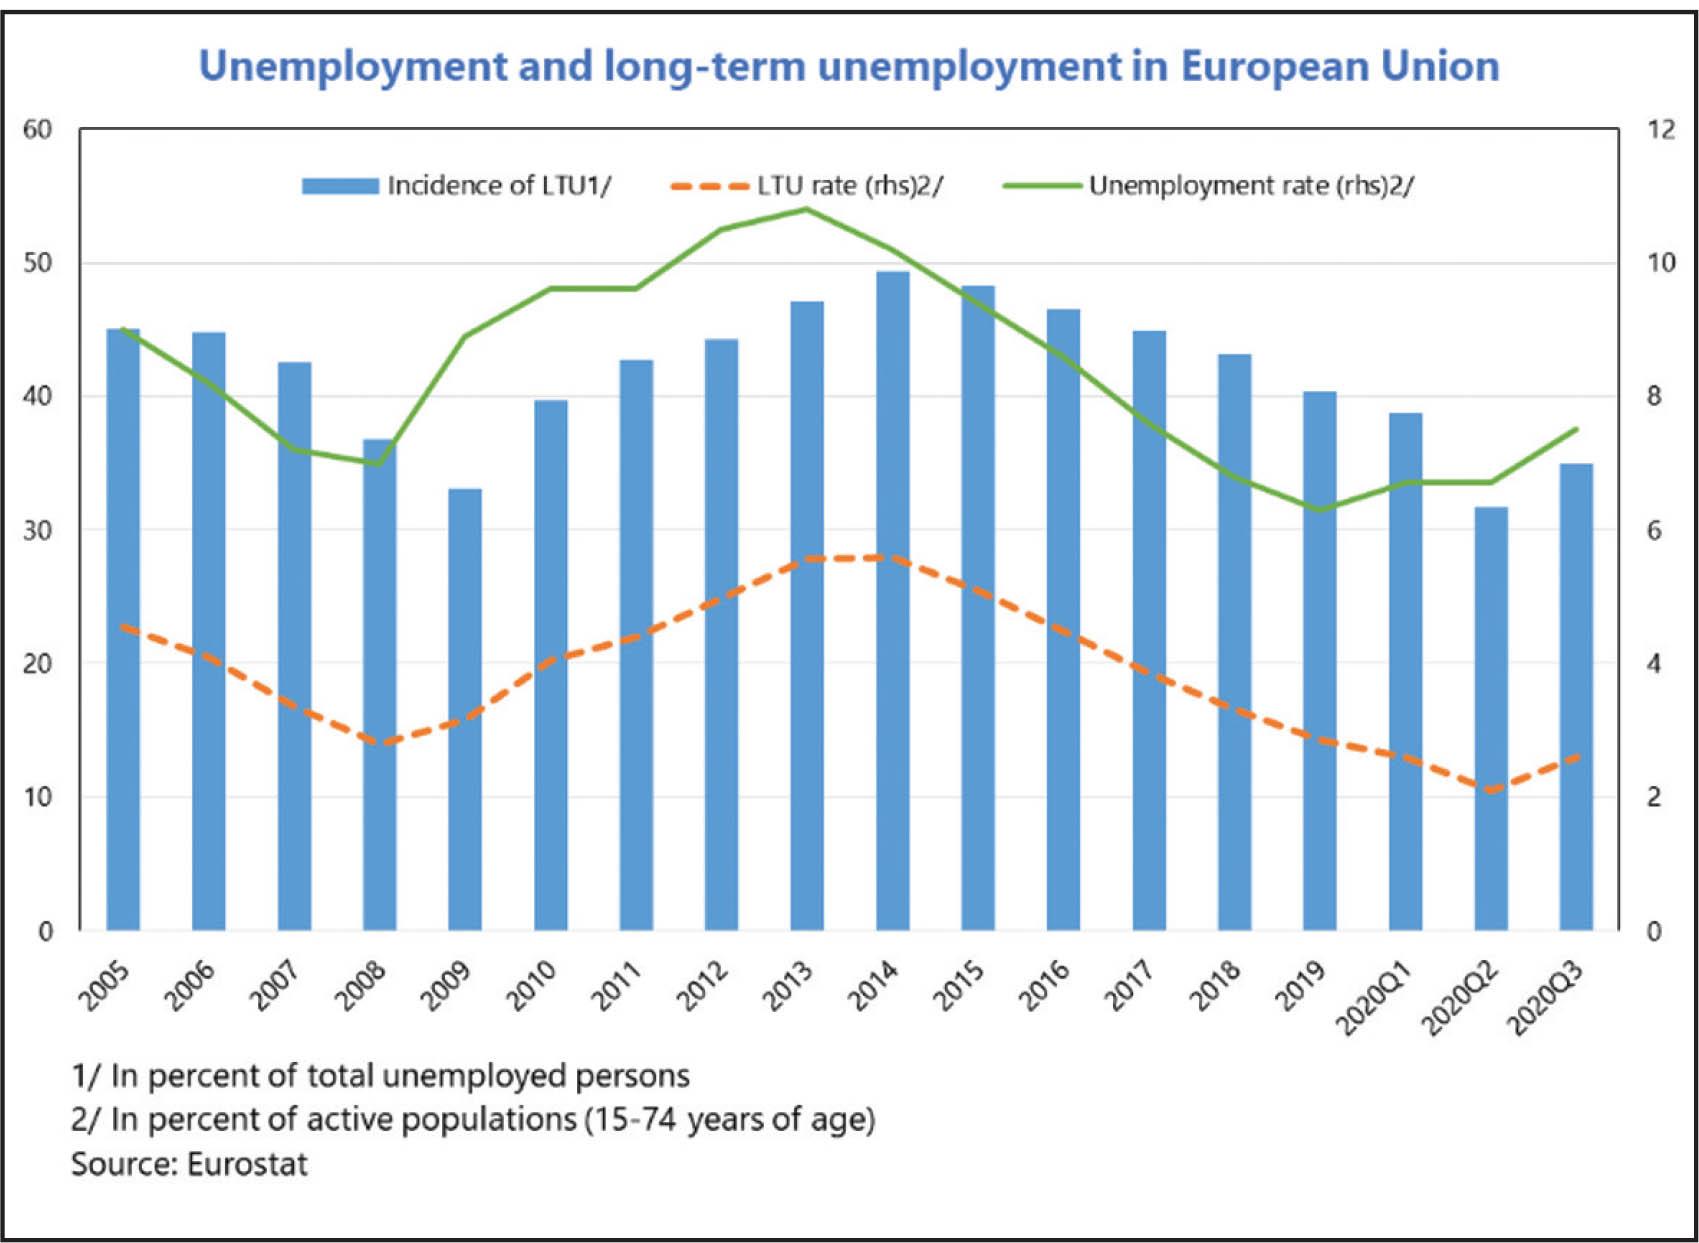
Figure 1
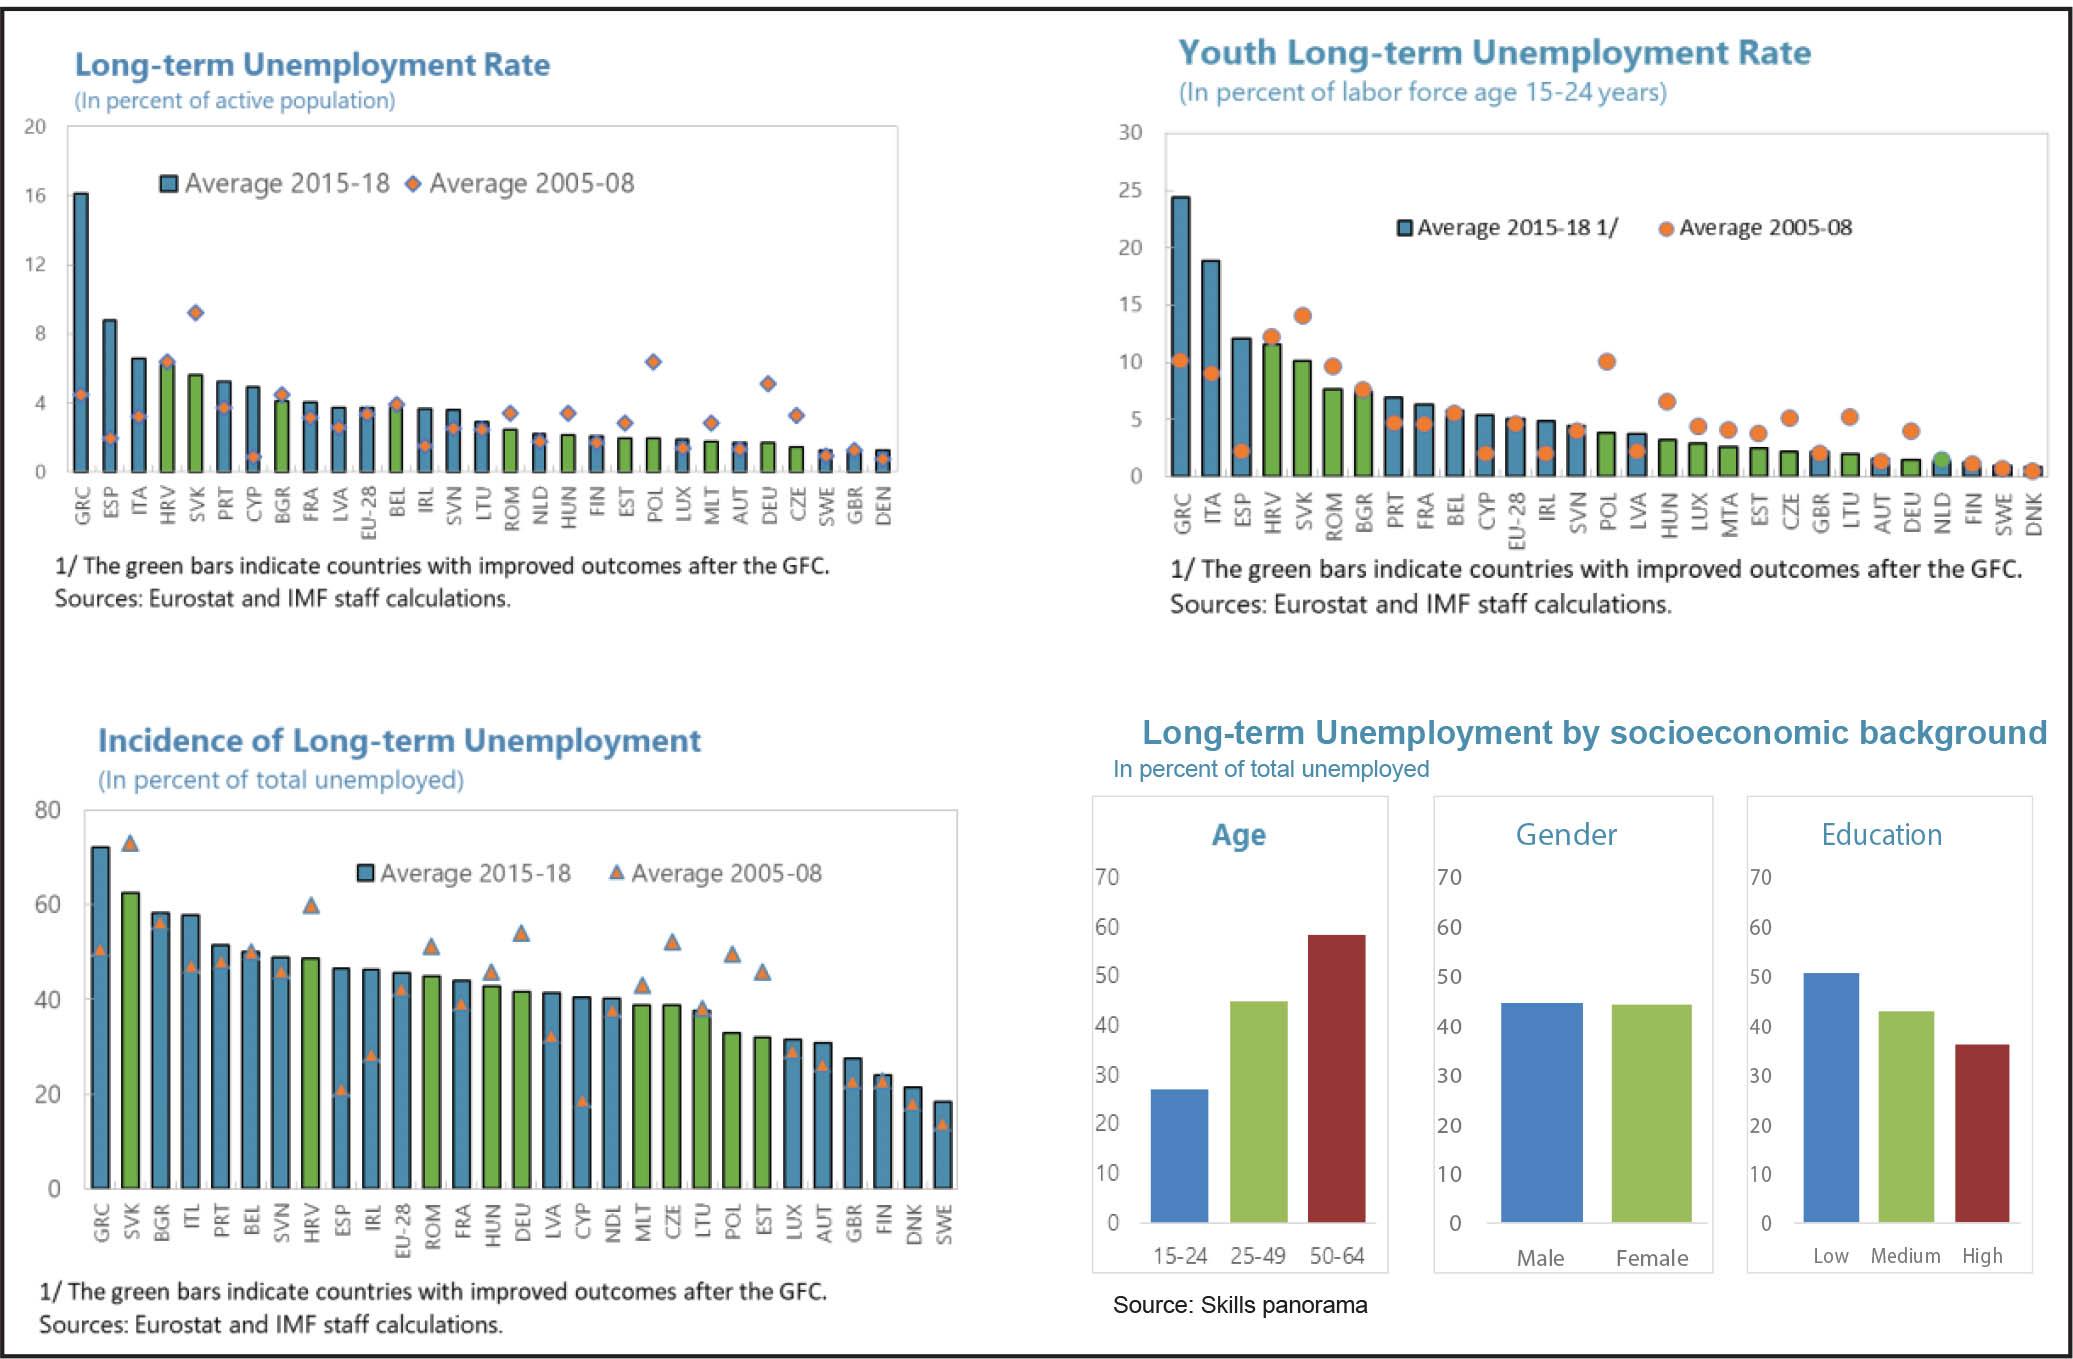
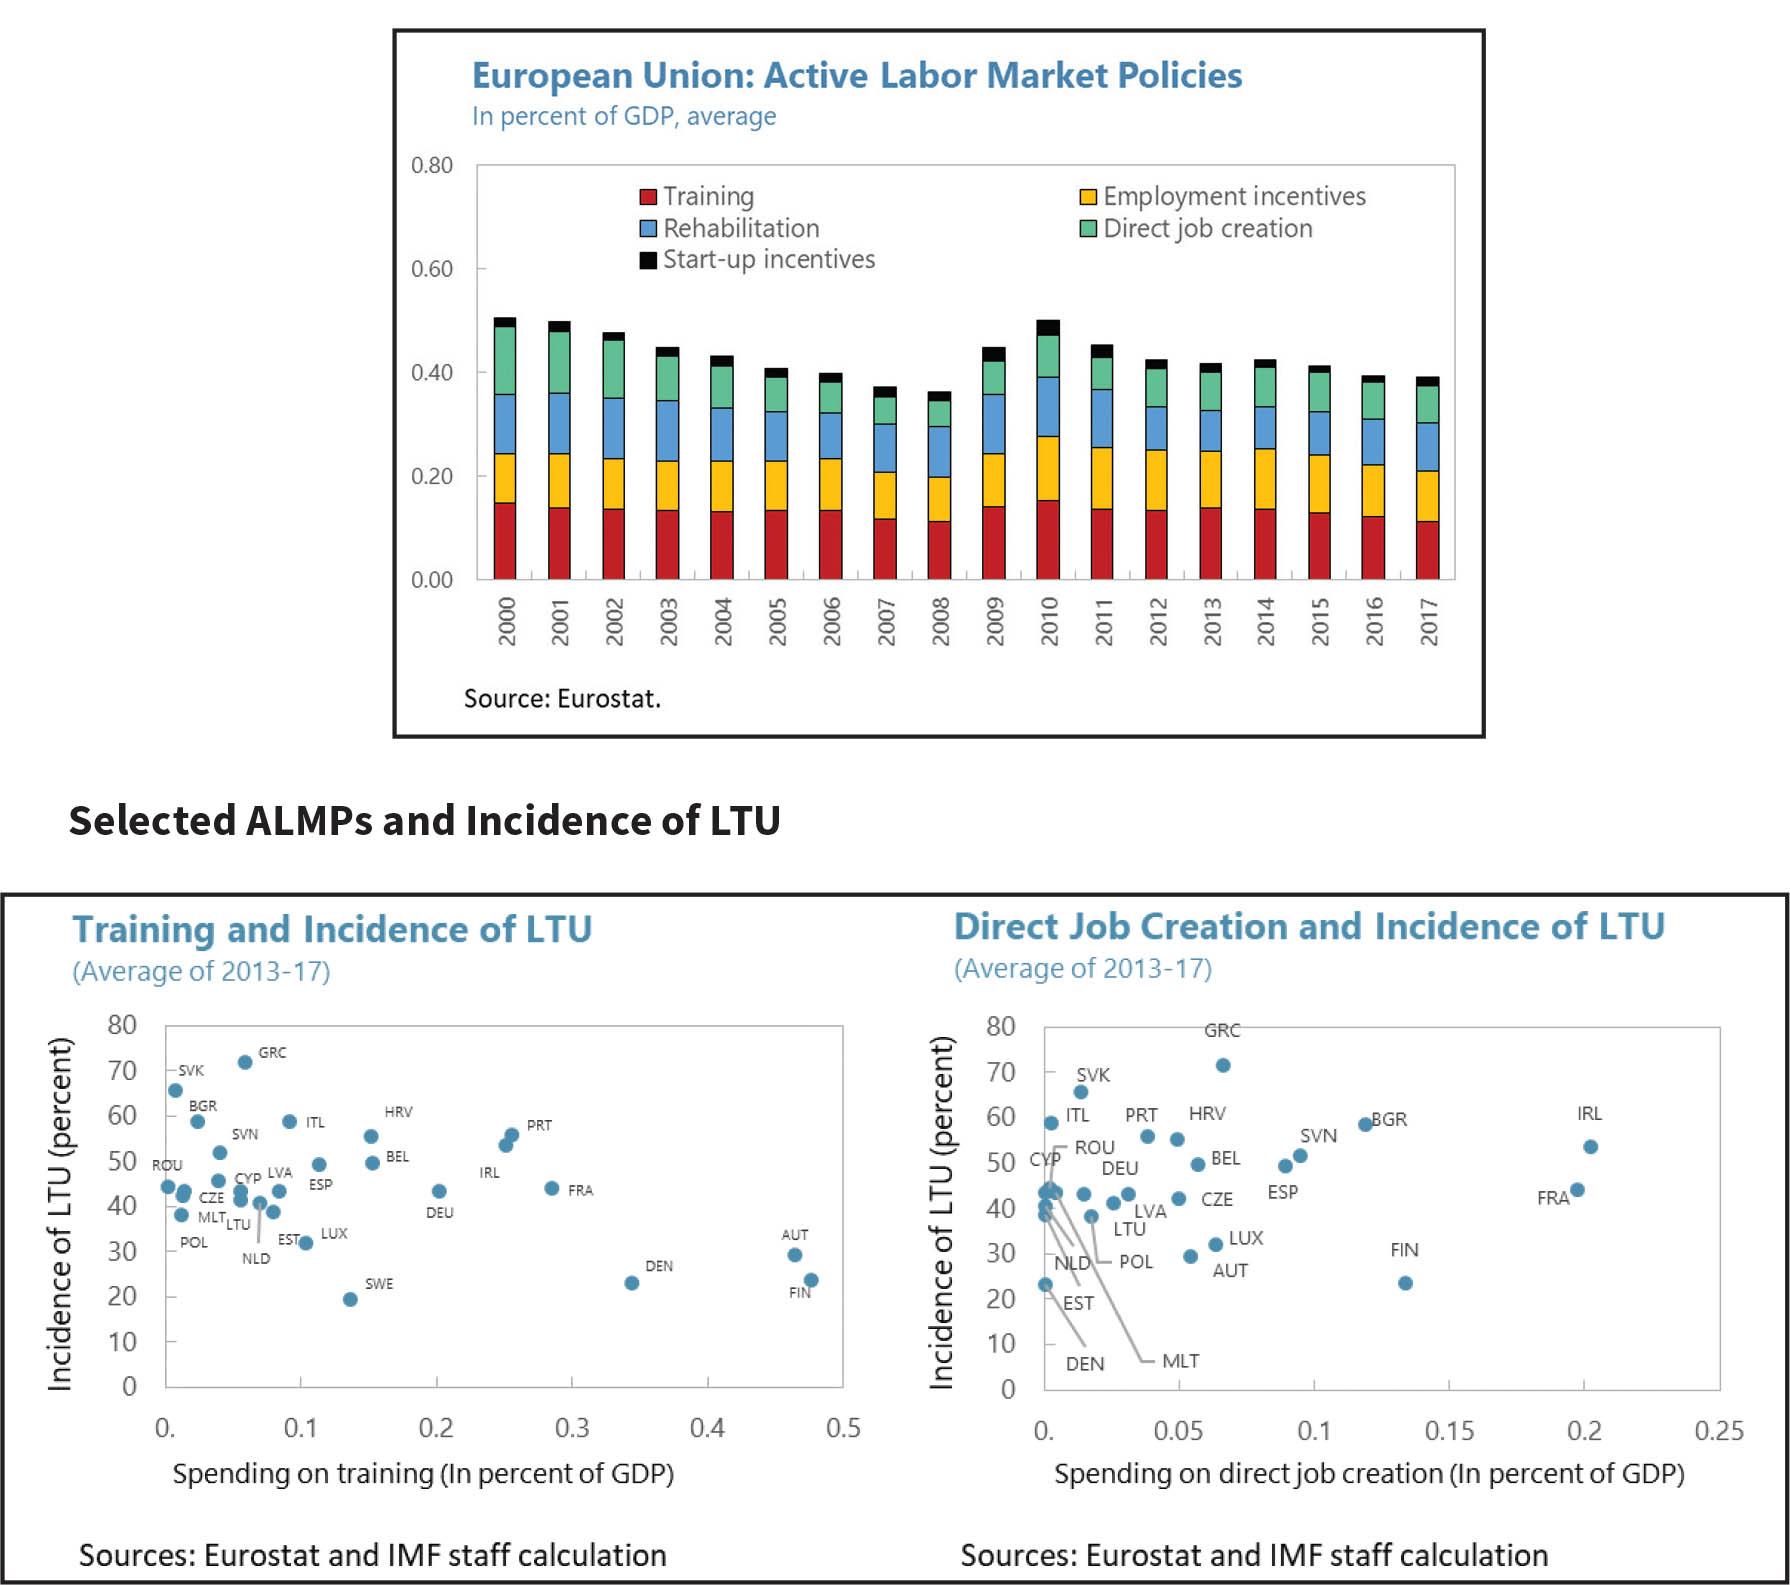
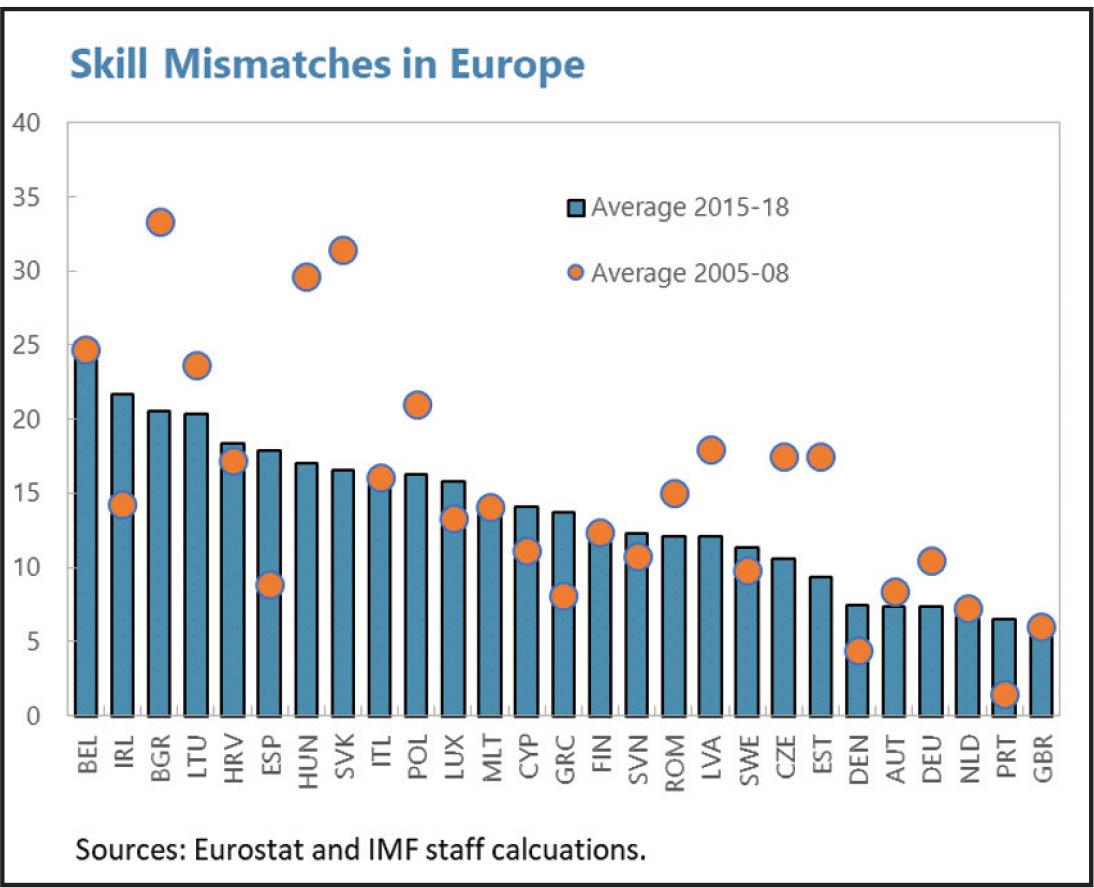
Figure 2

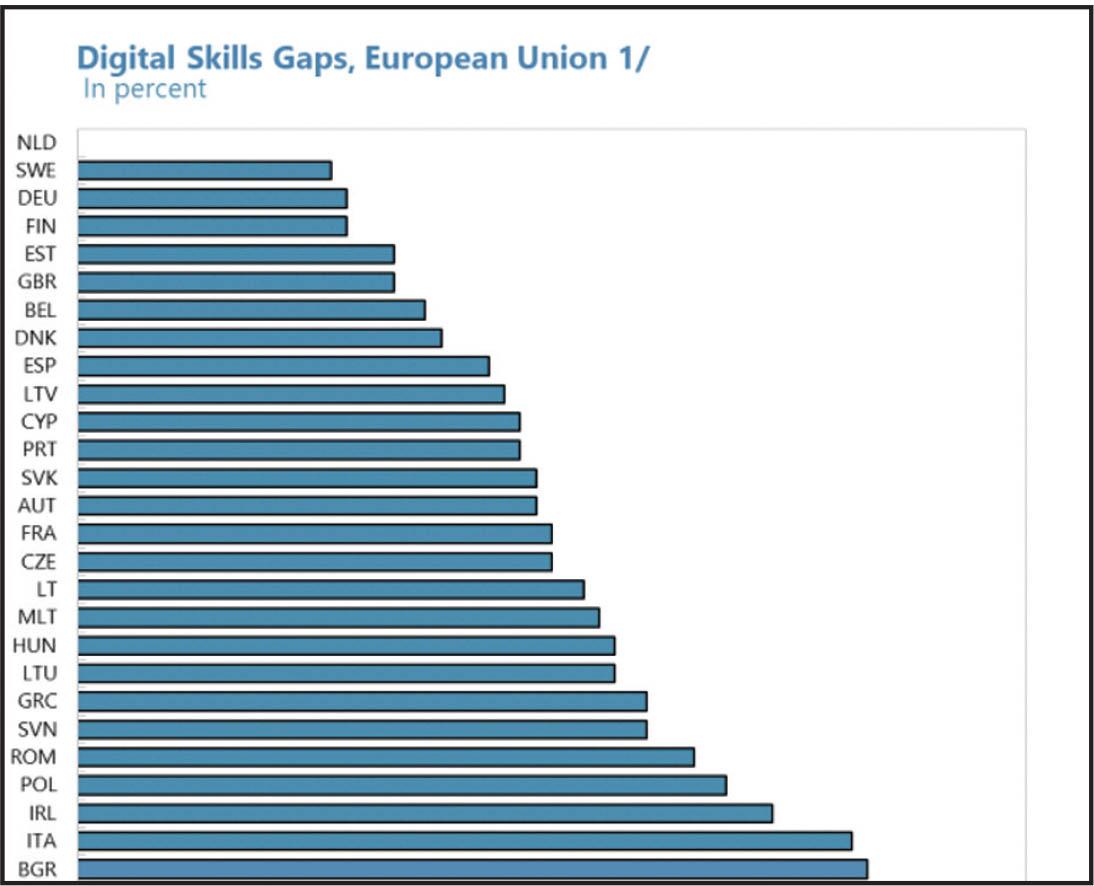
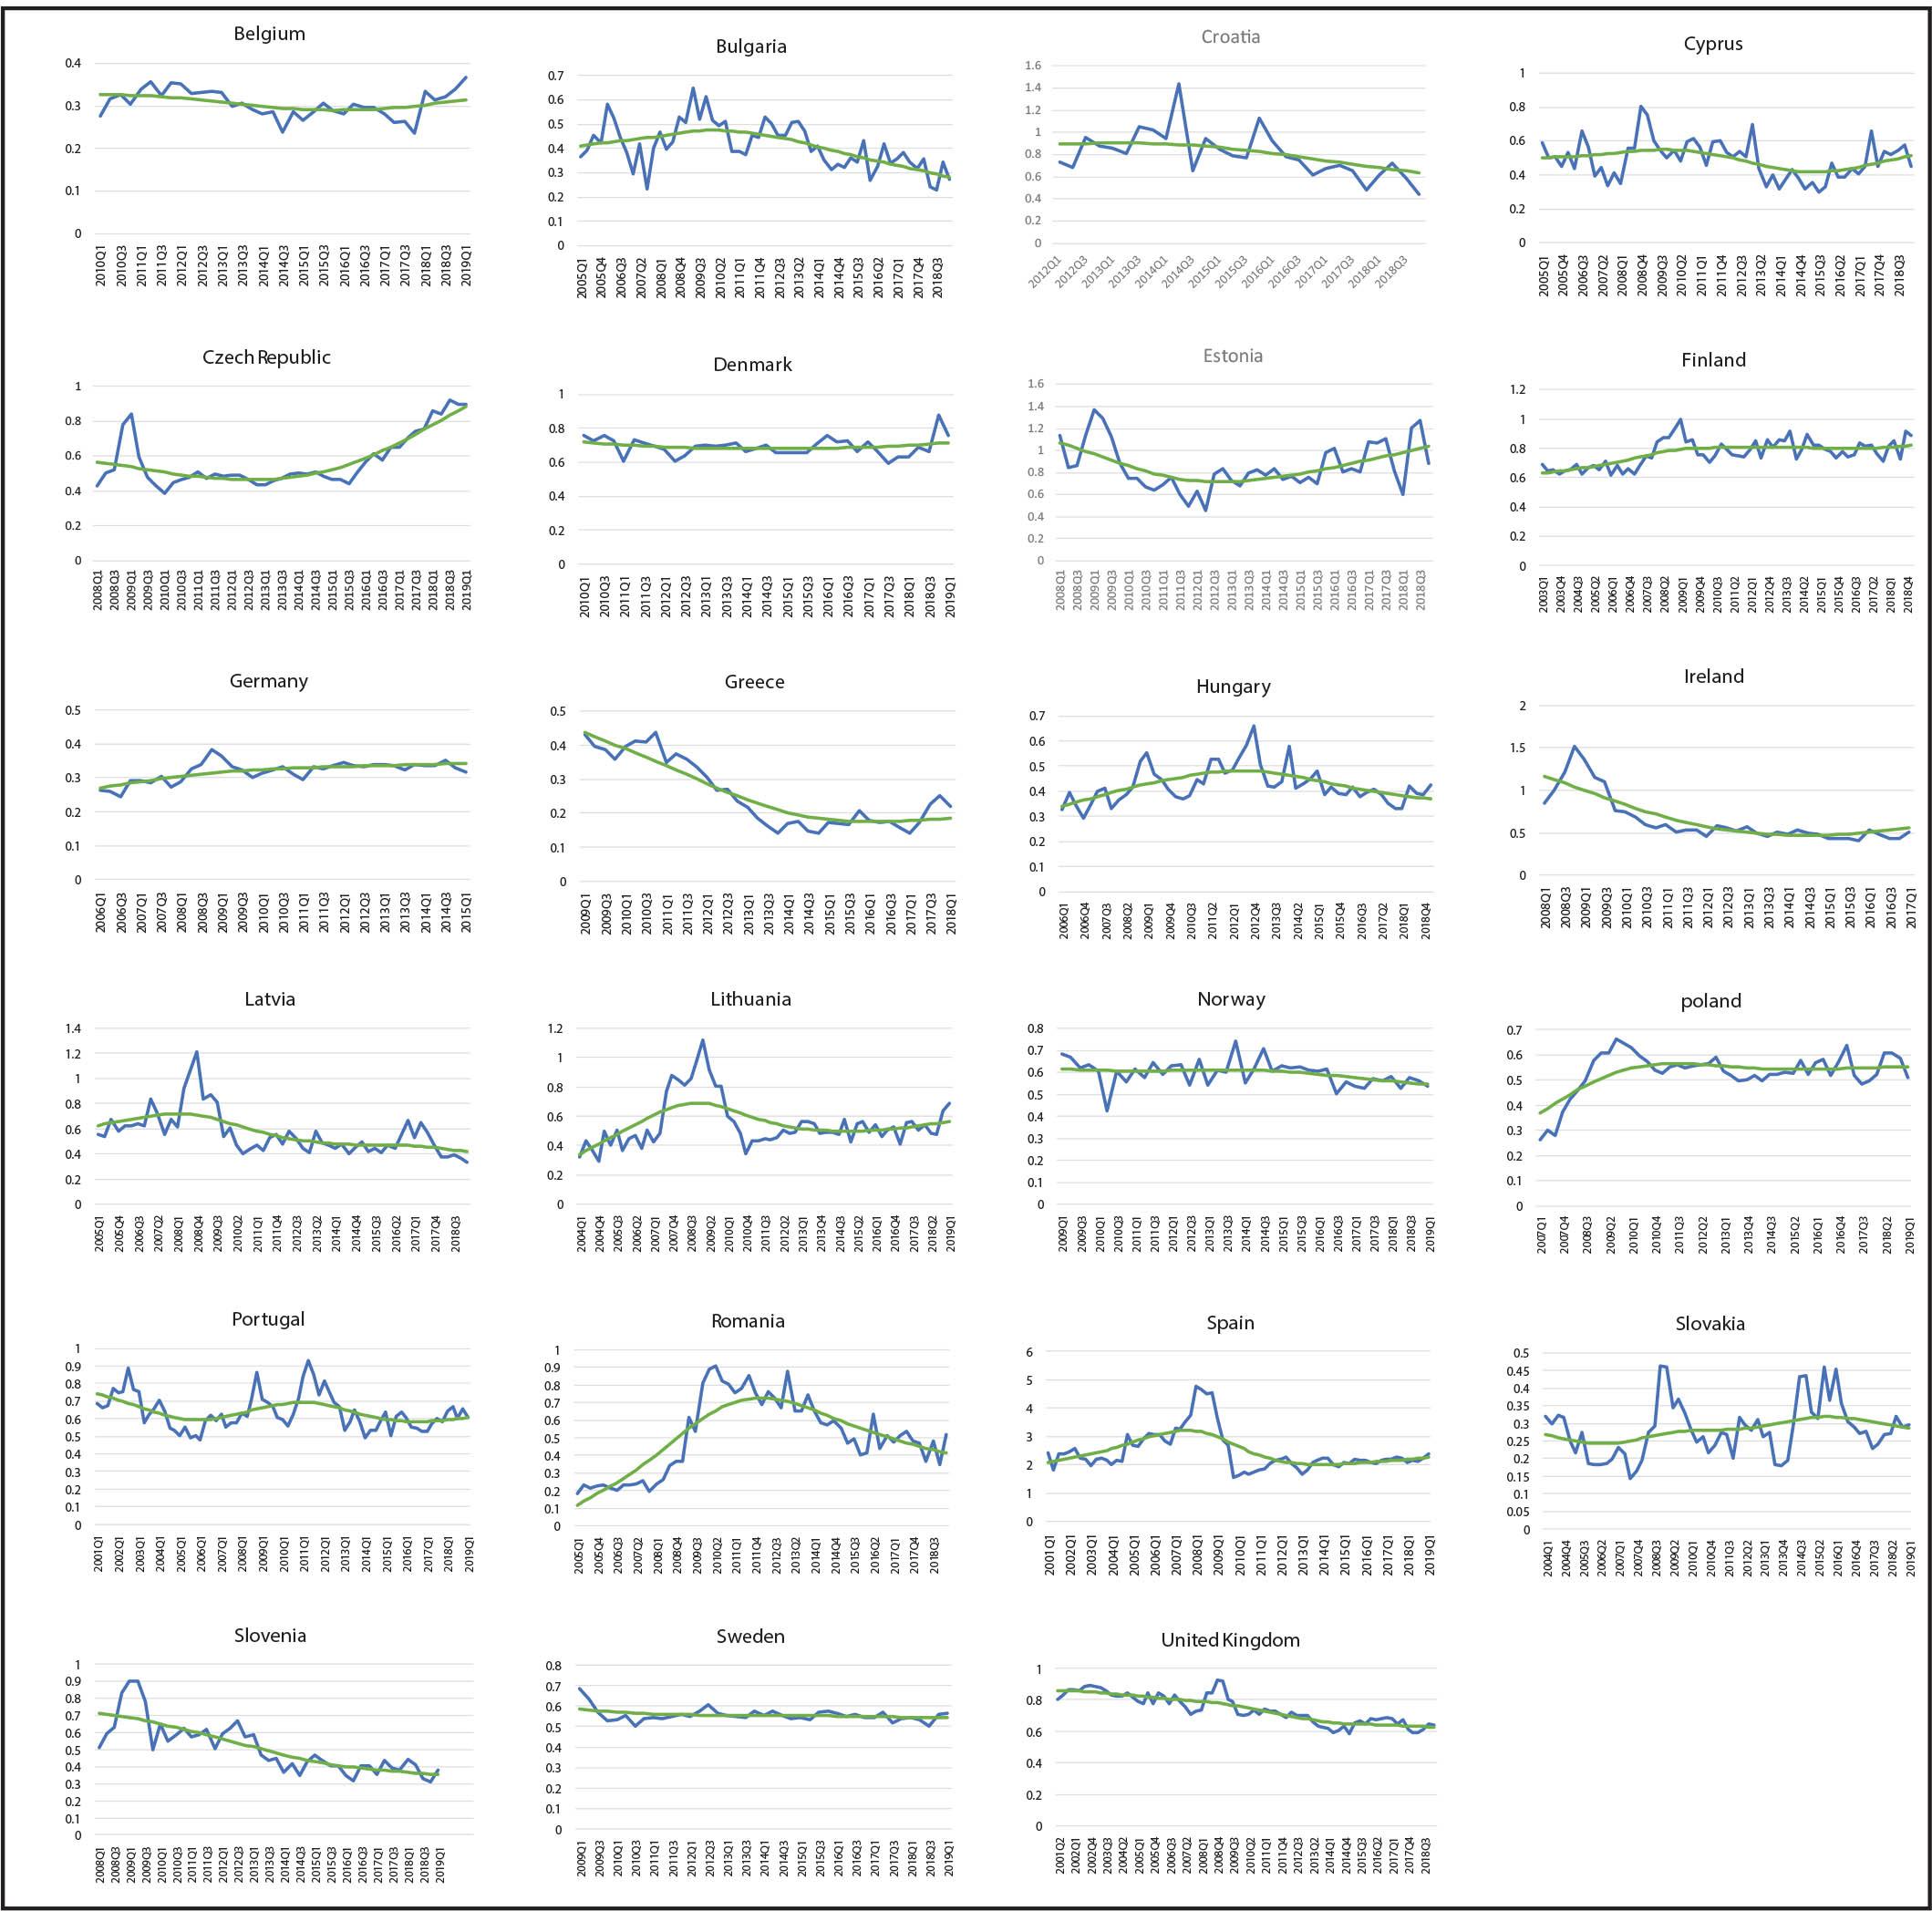
Figure A1
| Variable | Number of observations | Mean | Standard Deviation | Min | Max |
|---|---|---|---|---|---|
| Incidence of LTU | 494 | 0.425 | 0.132 | 0.095 | 0.763 |
| GDP growth rate | 589 | 0.051 | 0.066 | −0.304 | 0.349 |
| Inflation rate | 583 | 0.026 | 0.033 | −0.017 | 0.457 |
| NEET | 557 | 14.649 | 5.455 | 4.100 | 32.500 |
| Skill mismatch | 520 | 14.518 | 8.084 | 0.772 | 43.126 |
| Matching efficiency | 280 | 0.680 | 0.528 | 0.159 | 4.615 |
| Tax wedge | 504 | 37.532 | 7.358 | 11.900 | 51.400 |
| LMP | 446 | 0.371 | 0.289 | 0.033 | 2.129 |
| Training | 450 | 0.048 | 0.052 | 0.000 | 0.315 |
| Employment incentives | 448 | 0.036 | 0.040 | 0.000 | 0.219 |
| Supported employment and rehabilitation | 367 | 0.037 | 0.066 | 0.000 | 0.493 |
| Direct job creation | 382 | 0.024 | 0.039 | 0.000 | 0.328 |
| Start-up incentives | 405 | 0.004 | 0.006 | 0.000 | 0.035 |
| Unemployment benefits | 456 | 0.263 | 0.211 | 0.021 | 1.283 |
Robustness check
| Dependent Variable: Incidence of LTU | |||||
|---|---|---|---|---|---|
| (1) Benchmark | (2) DPD | (3) OLS | (4) NMS | (5) EPL | |
| Lag of LTU | 0.562*** (0.069) | 0.540*** (0.100) | 0.60*** (0.060) | 0.420** (0.160) | 0.441*** (0.105) |
| Lag of GDP growth | −0.164*** (0.069) | −0.030 (0.080) | −0.30*** (0.060) | 0.510* (0.270) | −0.164 (0.135) |
| ALMP | |||||
| Training | −0.666* (0.375) | −0.620* (0.370) | −0.46 (0.400) | −2.750** (1.030) | −0.431 (0.618) |
| Employment incentives | −0.180 (0.373) | −0.170 (0.410) | −0.25 (0.300) | 1.060 (1.040) | −0.223 (0.587) |
| Supported employment and rehabilitation | 0.578 (0.582) | 0.750 (0.580) | −0.21 (0.590) | 1.350 (1.130) | 1.355 (1.756) |
| Direct job creation | −0.280 (0.797) | −1.010 (0.820) | −0.24 (0.820) | 0.390 (2.120) | −1.962 (1.489) |
| Start-up incentives | −3.411** (1.648) | −3.530** (1.700) | −2.97* (1.590) | −9.190** (3.440) | −4.240* (2.465) |
| Unemployment benefits | 0.020 (0.130) | −0.020 (0.130) | 0.03 (0.140) | −0.990 (0.700) | |
| Skill mismatches | 0.003*** (0.001) | 0.003*** (0.001) | 0.003*** (0.001) | 0.004 (0.003) | 0.003** (0.001) |
| Matching efficiency | −0.042** (0.016) | −0.040*** (0.020) | −0.04*** (0.020) | −0.200* (0.110) | −0.432** (0.020) |
| Employment Protection | 0.005 (0.035) | ||||
| N | 136 | 116 | 136 | 60 | 134 |
Simple regressions
| Dependent Variable: Incidence of LTU | |||||||
|---|---|---|---|---|---|---|---|
| 1 | 2 | 3 | 4 | 5 | 6 | 7 | |
| Lag of LTU | 0.813*** (0.031) *** | 0.785*** (0.032) | 0.740*** (0.032) | 0.656*** (0.045) | 0.722*** (0.030) | 0.802*** (0.033) | 0.763*** (0.036) |
| Lag of GDP growth | −0.245 (0.039) | −0.247*** (0.039) | −0.269*** (0.048) | −0.111*** (0.040) | −0.248*** (0.043) | −0.282*** (0.044) | |
| Inflation rate | −0.041 (0.095) | ||||||
| Skill mismatches | 0.003*** (0.001) | ||||||
| Matching efficiency | −0.079*** (0.014) | ||||||
| NEET | 0.009*** (0.001) | ||||||
| TAX wedge | 0.002 (0.001) | ||||||
| Labor market policies | −0.119*** (0.029) | ||||||
| N | 456 | 453 | 429 | 256 | 439 | 362 | 368 |
Worker flow rates and matching elasticities
| Country | Sample period | Job finding rate | Separation rate | Elasticity of matching function α |
|---|---|---|---|---|
| Belgium | 2010Q1–2019Q1 | 29.9 | 2.2 | 0.87 |
| Bulgaria | 2005Q1–2019Q1 | 17.4 | 1.5 | 0.59 |
| Cyprus | 2005Q1–2019Q1 | 34 | 2.8 | 0.75 |
| Czech Republic | 2008Q1–2019Q1 | 28.3 | 1.4 | 0.82 |
| Denmark | 2010Q1–2019Q1 | 51.2 | 3.3 | 0.76 |
| Germany | 2006Q1–2019Q1 | 30.6 | 1.6 | 0.79 |
| Spain | 2001Q1–2019Q1 | 35.4 | 5.2 | 0.3 |
| Estonia | 2008Q3–2019Q1 | 38.8 | 3.4 | 0.52 |
| Finland | 2003Q1–2019Q1 | 57.5 | 5.1 | 0.8 |
| United Kingdom | 2001Q2–2019Q1 | 48 | 2.9 | 0.54 |
| Greece | 2009Q1–2019Q1 | 11.9 | 2.5 | 0.73 |
| Croatia | 2012Q1–2019Q1 | 19.4 | 2.4 | 0.32 |
| Hungary | 2006Q1–2019Q1 | 24 | 1.8 | 0.61 |
| Ireland | 2008Q1–2019Q2 | 24.9 | 2.4 | 0.59 |
| Latvia | 2005Q1–2019Q1 | 27.2 | 3.1 | 0.59 |
| Lithuania | 2004Q1–2019Q1 | 29.3 | 2.8 | 0.67 |
| Norway | 2009Q1–2019Q1 | 51.6 | 2 | 0.72 |
| Poland | 2007Q1–2019Q1 | 30.3 | 2.3 | 0.72 |
| Portugal | 2001Q1–2019Q1 | 23 | 2.5 | 0.64 |
| Romania | 2009Q4–2019Q1 | 27 | 1.8 | 0.64 |
| Slovakia | 2004Q1–2019Q1 | 12.4 | 1.4 | 0.6 |
| Slovenia | 2008Q1–2019Q1 | 22.9 | 1.8 | 0.57 |
| Sweden | 2009Q1–2019Q1 | 51.8 | 4.3 | 0.95 |
Multivariate regressions with individual ALMPs
| Dependent Variable: Incidence of LTU | ||||||
|---|---|---|---|---|---|---|
| 1 | 2 | 3 | 4 | 5 | 6 | |
| Lag of LTU | 0.794*** (0.034) | 0.777*** (0.034) | 0.837*** (0.035) | 0.812*** (0.037) | 0.824*** (0.035) | 0.562*** (0.069) |
| Lag of GDP growth | −0.277*** (0.043) | −0.267*** (0.044) | −0.263*** (0.051) | −0.263*** (0.049) | −0.267*** (0.045) | −0.164*** (0.069) |
| ALMP | ||||||
| Training | −0.496*** (0.145) | −0.666* (0.375) | ||||
| Employment incentives | −0.625*** (0.156) | −0.180 (0.373) | ||||
| Supported employment and rehabilitation | −0.213* (0.124) | 0.578 (0.582) | ||||
| Direct job creation | −0.103 (0.091) | −0.280 (0.797) | ||||
| Start-up incentives | −1.398** (0.579) | −3.411** (1.648) | ||||
| Unemployment benefits | 0.024 (0.133) | |||||
| Skill mismatches | 0.003*** (0.001) | |||||
| Matching efficiency | −0.042** (0.016) | |||||
| N | 372 | 370 | 290 | 327 | 339 | 136 |
Summary statistics
| LTU | Growth rate | Inflation rate | Skill mismatch | Matching efficiency | NEET rate | Tax wedge | LMP | |
|---|---|---|---|---|---|---|---|---|
| Mean | 0.42 | 0.05 | 0.03 | 14.52 | 0.68 | 14.65 | 37.53 | 0.37 |
| Std. Dev. | 0.13 | 0.07 | 0.03 | 8.08 | 0.53 | 5.46 | 7.36 | 0.29 |
| Min | 0.09 | −0.3 | −0.02 | 0.77 | 0.16 | 4.1 | 11.9 | 0.03 |
| Max | 0.76 | 0.35 | 0.46 | 43.13 | 4.61 | 32.5 | 51.4 | 2.13 |
| Correlation Matrix | ||||||||
| LTU | 1.00 | |||||||
| Growth rate (lagged) | −0.03 | 1.00 | ||||||
| Inflation rate | −0.14 | 0.44 | 1.00 | |||||
| Skill mismatch | 0.41 | 0.12 | 0.13 | 1.00 | ||||
| Matching efficiency | −0.37 | 0.02 | 0.08 | −0.24 | 1.00 | |||
| NEET rate | 0.66 | −0.17 | −0.08 | 0.47 | −0.01 | 1.00 | ||
| Tax wedge | 0.01 | 0.03 | 0.17 | 0.18 | −0.16 | −0.08 | 1.00 | |
| LMP | −0.51 | −0.10 | −0.13 | −0.26 | 0.24 | −0.49 | −0.05 | 1.00 |