
Table 1
Demographic and labor supply characteristics of US-educated and foreign-educated nurses, 1980–2015
| US-educated RNs | ||||||
|---|---|---|---|---|---|---|
| 1980 | 1990 | 2000 | 2007 | 2010 | 2015 | |
| Age, mean, in years | 39.25 | 40.01 | 42.90 | 44.71 | 44.99 | 44.60 |
| Gender | ||||||
| Female | 95.91 | 94.48 | 92.44 | 91.29 | 91.12 | 90.20 |
| Male | 4.09 | 5.52 | 7.56 | 8.71 | 8.88 | 9.80 |
| Race | ||||||
| White | 90.14 | 88.18 | 85.01 | 83.38 | 82.22 | 81.17 |
| Black | 7.97 | 8.66 | 8.71 | 9.34 | 9.95 | 10.10 |
| Asian | 1.46 | 1.94 | 3.64 | 4.33 | 5.11 | 5.41 |
| Native American | 0.30 | 0.39 | 0.40 | 0.45 | 0.40 | 0.40 |
| Other races | 0.12 | 0.83 | 2.25 | 2.50 | 2.32 | 2.93 |
| Hispanics | 1.84 | 2.67 | 3.26 | 4.17 | 5.10 | 5.96 |
| Marital status | ||||||
| Married | 67.13 | 67.53 | 68.14 | 65.88 | 65.40 | 63.96 |
| Widow/divorced/separated | 18.26 | 18.79 | 19.56 | 20.56 | 20.25 | 19.09 |
| Single | 14.61 | 13.68 | 12.30 | 13.56 | 14.35 | 16.95 |
| Educational attainment | ||||||
| Less than high school | 12.35 | 0.56 | 0.21 | 0.07 | 0.21 | 0.19 |
| High school | 6.06 | 15.43 | 11.27 | 6.45 | 6.69 | 6.00 |
| Associate’s degree | 48.51 | 38.38 | 35.96 | 37.32 | 37.40 | 34.65 |
| Bachelor’s degree | 21.91 | 32.45 | 38.75 | 42.01 | 42.66 | 44.83 |
| Graduate degree | 11.18 | 13.19 | 13.80 | 14.15 | 13.04 | 14.33 |
| Spanish speaking | 1.98 | 2.91 | 3.62 | 3.91 | 4.15 | 4.50 |
| Part time | 31.00 | 30.22 | 26.32 | 25.13 | 23.37 | 21.70 |
| Hourly wage (US $), mean | 16.24 | 20.65 | 22.89 | 24.42 | 24.47 | 23.97 |
| Hours worked/week, mean | 34.67 | 36.24 | 37.11 | 37.46 | 37.52 | 37.72 |
| Number of observations | 51,739 | 81,944 | 100,102 | 72,886 | 78,993 | 137,429 |
| Estimated number | 1,034,780 | 1,638,880 | 2,002,040 | 2,429,533 | 2,633,100 | 2,748,580 |
| Foreign-educated RNs | ||||||
| 1980 | 1990 | 2000 | 2007 | 2010 | 2015 | |
| Age, mean, in years | 41.15 | 44.00 | 45.74 | 46.61 | 47.12 | 48.16 |
| Gender | ||||||
| Female | 93.63 | 93.88 | 89.48 | 86.75 | 86.36 | 84.33 |
| Male | 6.37 | 6.12 | 10.52 | 13.25 | 13.64 | 15.67 |
| Race | ||||||
| White | 36.33 | 27.22 | 24.02 | 20.66 | 19.36 | 19.50 |
| Black | 16.56 | 18.52 | 20.65 | 21.57 | 20.14 | 22.84 |
| Asian | 45.96 | 52.30 | 49.14 | 54.39 | 57.19 | 54.03 |
| Native American | 0.16 | 0.22 | 0.18 | 0.06 | 0.18 | 0.20 |
| Other races | 0.99 | 1.74 | 6.01 | 3.32 | 3.14 | 3.43 |
| Hispanics | 8.49 | 7.25 | 5.12 | 5.11 | 5.34 | 5.62 |
| Marital status | ||||||
| Married | 64.27 | 68.74 | 71.68 | 71.53 | 73.32 | 72.86 |
| Widow/divorced/separated | 14.55 | 15.63 | 15.03 | 16.27 | 15.32 | 16.79 |
| Single | 21.18 | 15.63 | 13.29 | 12.20 | 11.36 | 10.34 |
| Foreign-educated RNs | ||||||
| 1980 | 1990 | 2000 | 2007 | 2010 | 2015 | |
| Educational attainment | ||||||
| Less than high school | 17.50 | 1.42 | 0.80 | 0.60 | 0.58 | 0.53 |
| High school | 5.09 | 15.30 | 11.19 | 6.06 | 5.15 | 5.05 |
| Associate’s degree | 26.12 | 24.98 | 22.77 | 20.45 | 19.85 | 18.92 |
| Bachelor’s degree | 27.46 | 43.57 | 51.06 | 57.98 | 61.15 | 61.01 |
| Graduate degree | 23.84 | 14.74 | 14.19 | 14.91 | 13.27 | 14.48 |
| Spanish speaking | 6.29 | 6.15 | 5.44 | 5.27 | 5.11 | 5.77 |
| Part time | 17.60 | 16.89 | 15.14 | 12.07 | 12.89 | 13.77 |
| Hourly wage (US $), mean | 18.36 | 24.41 | 27.49 | 28.16 | 27.52 | 27.87 |
| Hours worked/week, mean | 37.29 | 38.60 | 39.04 | 40.12 | 39.48 | 39.10 |
| Number of observations | 3,241 | 4,459 | 5,460 | 4,955 | 5,871 | 10,332 |
| Estimated number | 64,820 | 89,180 | 109,200 | 165,167 | 195,700 | 206,640 |
[i] RN, registered nurse; BLS, Bureau of Labor Statistics; CPI-U, Consumer Price Index for All Urban Consumers.
Source: The data are from the US Censuses and the American Community Survey (ACS) multiyear aggregates.
Notes: The Census samples and ACS sample for 2015 include 5% of the US population, while the ACS samples for 2007 and 2010 include 3% of the population. The samples are restricted to employed registered nurses aged 25–70 years old. Wages are deflated so that they are in terms of the 1999 wages using the BLS CPI-U.
Table 2
Top 10 source countries for employed FENs in the United States, 1980–2015
| 1980 (N = 3,241) | 1990 (N = 4,459) | 2000 (N = 5,460) | ||||||
|---|---|---|---|---|---|---|---|---|
| Birthplace | N | % | Birthplace | N | % | Birthplace | N | % |
| Philippines | 883 | 27.25 | Philippines | 1,566 | 35.11 | Philippines | 1,767 | 32.37 |
| Canada | 354 | 10.91 | Jamaica | 344 | 7.72 | India | 398 | 7.29 |
| India | 199 | 6.15 | Canada | 298 | 6.69 | Canada | 373 | 6.83 |
| Jamaica | 195 | 6.01 | India | 270 | 6.05 | Jamaica | 355 | 6.51 |
| Korea | 148 | 4.56 | Korea | 154 | 3.46 | Nigeria | 217 | 3.97 |
| England | 107 | 3.29 | Ireland | 115 | 2.57 | Korea | 150 | 2.75 |
| Ireland | 101 | 3.11 | England | 102 | 2.29 | Guyana/British Guiana | 116 | 2.13 |
| Thailand | 74 | 2.28 | Trinidad and Tobago | 89 | 2.00 | England | 116 | 2.12 |
| Trinidad and Tobago | 64 | 1.99 | Thailand | 77 | 1.73 | China | 112 | 2.05 |
| West Germany | 59 | 1.83 | Barbados | 60 | 1.34 | Trinidad and Tobago | 96 | 1.77 |
| Percentage of total FENs accounted for by top 10 source countries | 67.38 | 68.96 | 67.79 | |||||
| 2007 (N = 4,955) | 2010 (N = 5,871) | 2015 (N = 10,332) | ||||||
| Birthplace | N | % | Birthplace | N | % | Birthplace | N | % |
| Philippines | 1,792 | 36.17 | Philippines | 2,335 | 39.77 | Philippines | 3,910 | 37.84 |
| India | 421 | 8.49 | India | 476 | 8.11 | India | 797 | 7.72 |
| Canada | 251 | 5.07 | Jamaica | 2665 | 4.53 | Nigeria | 593 | 5.64 |
| Nigeria | 229 | 4.63 | Nigeria | 262 | 4.46 | Jamaica | 404 | 3.91 |
| Jamaica | 220 | 4.44 | Canada | 229 | 3.91 | Canada | 381 | 3.69 |
| Korea | 162 | 3.26 | Korea | 191 | 3.26 | Korea | 282 | 2.73 |
| Haiti | 142 | 2.86 | China | 145 | 2.47 | China | 232 | 2.25 |
| China | 122 | 2.47 | Haiti | 121 | 2.06 | Haiti | 203 | 1.97 |
| Trinidad and Tobago | 74 | 1.49 | Guyana/British | 70 | 1.20 | Ghana | 196 | 1.90 |
| Guiana | ||||||||
| England | 70 | 1.42 | Cuba | 70 | 1.19 | Cuba | 148 | 1.44 |
| Percentage of total FENs accounted for by top 10 source countries | 70.30 | 70.96 | 69.09 | |||||
[i] FENs, foreign-educated nurses.
Source: The data are from the US Censuses and the American Community Survey (ACS) multiyear aggregates.
Notes: The Census samples and ACS sample for 2015 include 5% of the US population, while the ACS samples for 2007 and 2010 include 3% of the population. The samples for this table are restricted to employed foreign-educated registered nurses aged 25–70 years old.
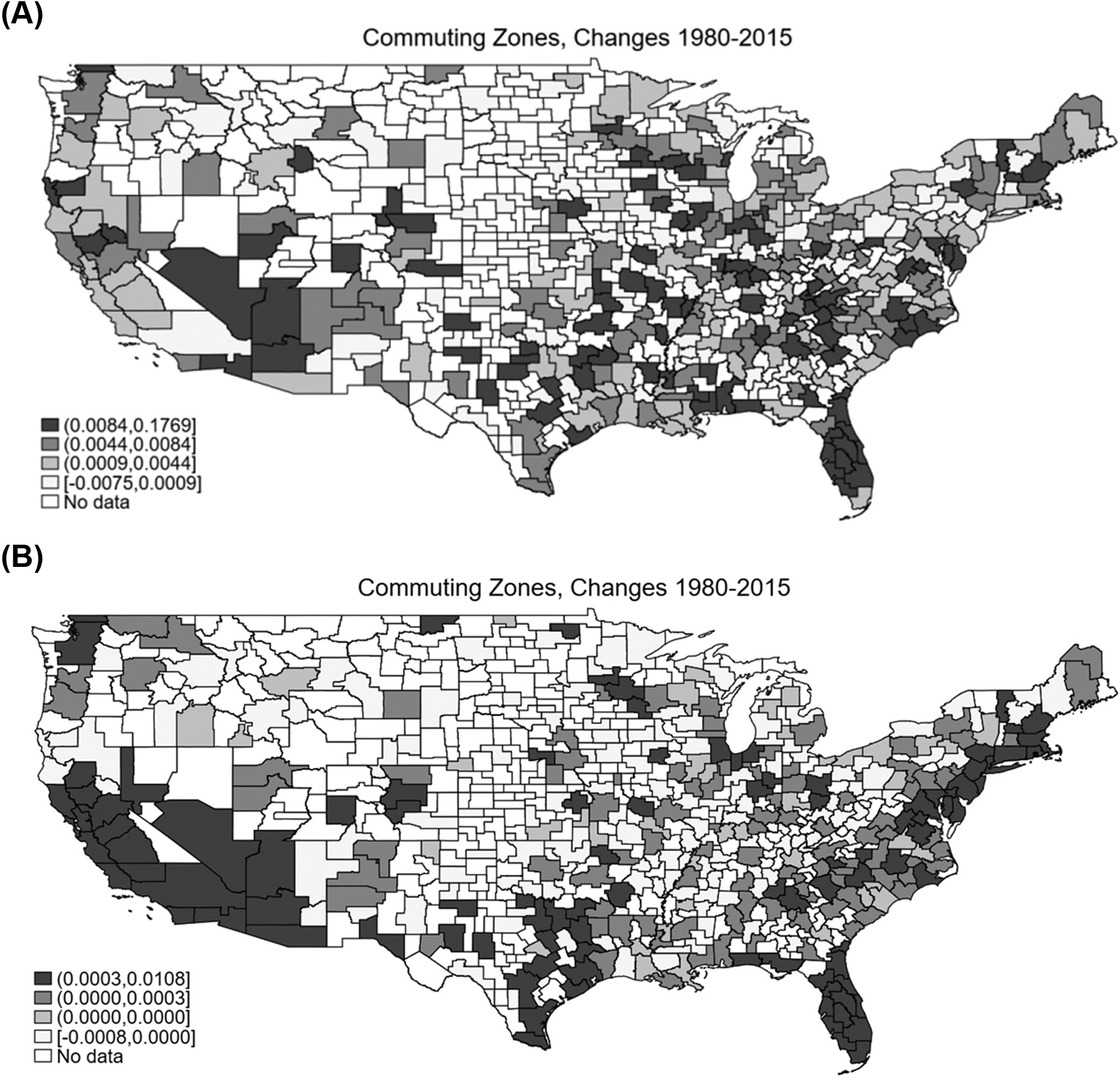
Figure 1
Changes in the number of registered nurses as a share of the initial population. (A) US-educated nurses and (B) Foreign-educated nurses.
Note: The data are from the US Censuses and the American Community Survey multiyear aggregates. The samples are restricted to employed registered nurses aged 25–70 years old, and we plot the maps for the US mainland only. These maps show that growth in number of foreign-educated nurses is not randomly distributed across the United States.
Table 3
The first-stage regressions
| Dependent variable: Foreign-educated nurses per 1,000 population | ||||||||||
|---|---|---|---|---|---|---|---|---|---|---|
| 1990–2015 | 2000–2015 | |||||||||
| (1) | (2) | (3) | (4) | (5) | (6) | (7) | (8) | (9) | (10) | |
| Predicted foreign-educated RNs per 1,000 population | 2.414*** | 0.521** | 0.296** | 0.574* | 0.241 | 2.493*** | 0.369** | 0.232* | 0.362 | 0.241 |
| (0.604) | (0.220) | (0.166) | (0.308) | (0.348) | (0.628) | (0.214) | (0.183) | (0.415) | (0.348) | |
| Controls | X | X | X | X | X | X | X | X | ||
| Year FE | X | X | X | X | X | X | X | X | X | X |
| Area FE | X | X | X | X | X | X | ||||
| Pre-Great Recession | X | X | ||||||||
| Great Recession and Post-Great Recession | X | X | ||||||||
| F-statistics | 496.73 | 32.05 | 10.21 | 23.76 | 2.35 | 341.64 | 20.63 | 10.23 | 5.43 | 2.35 |
| Observations | 700 | 700 | 700 | 420 | 280 | 560 | 560 | 560 | 280 | 280 |
| R2 | 0.453 | 0.817 | 0.943 | 0.967 | 0.973 | 0.410 | 0.813 | 0.947 | 0.977 | 0.973 |
[i] RN, registered nurse; FE, fixed effect.
Source: The data are from the US Censuses and the American Community Survey multiyear aggregates.
Notes: The dependent variable in the first-stage regressions is the number of foreign-educated nurses aged 25–70 years as a fraction of a whole population in a commuting zone. The instrument is constructed by using the historical distribution of skilled immigrants (no restrictions on age or labor force status), excluding those who are registered nurses, across commuting zones in 1980 to allocate the national inflow of foreign-educated nurses to each commuting zone. All specifications are weighted by the whole population in the commuting zone. Standard errors in parentheses are clustered at the commuting zone level. Significance is indicated by the symbol * at the 10% level, ** at the 5% level, and *** at the 1% level.
Table 4
Displacement effects of foreign-educated RNs on US-educated RNs
| Dependent variable: US-educated nurses per 1,000 population | ||||||||||
|---|---|---|---|---|---|---|---|---|---|---|
| 1990–2015 | 2000–2015 | |||||||||
| (1) | (2) | (3) | (4) | (5) | (6) | (7) | (8) | (9) | (10) | |
| OLS | ||||||||||
| Foreign-educated nurses per 1,000 population | –1.730*** | –0.636** | 0.215 | –0.020 | 0.605 | –1.816*** | –0.466* | 0.205 | –0.035 | 0.605 |
| (0.347) | (0.250) | (0.286) | (0.261) | (0.381) | (0.339) | (0.254) | (0.263) | (0.398) | (0.381) | |
| Observations | 700 | 700 | 700 | 420 | 280 | 560 | 560 | 560 | 280 | 280 |
| R2 | 0.390 | 0.778 | 0.932 | 0.954 | 0.968 | 0.390 | 0.790 | 0.946 | 0.975 | 0.968 |
| 2SLS (single instrument) | ||||||||||
| Foreign-educated nurses per 1,000 population | –1.988*** | –1.902*** | 2.182** | 0.107 | 0.970 | –2.223*** | –3.018* | 1.878* | 0.237 | 0.970 |
| (0.465) | (0.737) | (0.995) | (0.740) | (1.487) | (0.476) | (1.734) | (1.355) | (1.495) | (1.487) | |
| Observations | 700 | 700 | 700 | 420 | 280 | 560 | 560 | 560 | 280 | 280 |
| R2 | 0.383 | 0.746 | 0.909 | 0.954 | 0.967 | 0.374 | 0.664 | 0.931 | 0.975 | 0.967 |
| Controls | X | X | X | X | X | X | X | X | ||
| Year FE | X | X | X | X | X | X | X | X | X | X |
| Area FE | X | X | X | X | X | X | ||||
| Pre-Great Recession | X | X | ||||||||
| Great Recession and Post-Great Recession | X | X | ||||||||
[i] RN, registered nurse; OLS, ordinary least squares; 2SLS, two-stage least squares; FE, fixed effects.
Source: The data are from the US Censuses and the American Community Survey multiyear aggregates.
Notes: The dependent variable is the number of full-time employed US-trained nurses aged 25–70 years per 1,000 population in a commuting zone, and the main independent variable is the number of full-time employed, internationally trained nurses aged 25–70 years per 1,000 population in a commuting zone. For the specification, the 2SLS model including controls and fixed effects is applied. The instrument is constructed by using the historical distribution of skilled immigrants, excluding those who are registered nurses, across commuting zones in 1980 to allocate the national inflow of foreign-educated nurses to each commuting zone. All specifications are weighted by the whole population in the commuting zone. Standard errors in parentheses are clustered at the commuting zone level. Significance is indicated by the symbol * at the 10% level, ** at the 5% level, and *** at the 1% level.
Table 5
Displacement effects of foreign-educated RNs on US-trained RNs by age
| Dependent variable: US-educated nurses per 1,000 population | |||||||||
|---|---|---|---|---|---|---|---|---|---|
| 1990–2015 | |||||||||
| (1) | (2) | (3) | (4) | (5) | (6) | (7) | (8) | (9) | |
| Age, years | 25–29 | 30–34 | 35–39 | 40–44 | 45–49 | 50–54 | 55–59 | 60–64 | 65–70 |
| Foreign-educated nurses per 1,000 population | 0.818** | –0.155 | 0.387 | –0.057 | 0.394 | 0.218 | 0.164 | 0.331 | 0.081 |
| (0.380) | (0.314) | (0.383) | (0.269) | (0.292) | (0.294) | (0.302) | (0.303) | (0.105) | |
| Observations | 700 | 700 | 700 | 700 | 700 | 700 | 700 | 700 | 700 |
| R2 | 0.631 | 0.757 | 0.727 | 0.792 | 0.793 | 0.847 | 0.877 | 0.802 | 0.709 |
| 2000–2015 | |||||||||
| Age, years | 25–29 | 30–34 | 35–39 | 40–44 | 45–49 | 50–54 | 55–59 | 60–64 | 65–70 |
| Foreign-educated nurses per 1,000 population | 0.906** | –0.068 | 0.431 | –0.514 | –0.047 | 0.040 | 0.135 | 0.569 | 0.125 |
| (0.761) | (0.391) | (0.594) | (0.489) | (0.450) | (0.397) | (0.429) | (0.545) | (0.181) | |
| Observations | 560 | 560 | 560 | 560 | 560 | 560 | 560 | 560 | 560 |
| R2 | 0.497 | 0.736 | 0.703 | 0.783 | 0.808 | 0.824 | 0.863 | 0.743 | 0.691 |
[i] RN, registered nurse; 2SLS, two-stage least squares.
Source: The data are from the US Censuses and the American Community Survey multiyear aggregates.
Notes: The dependent variable is the number of full-time employed US-trained nurses aged 25–70 years per 1,000 population by age groups in a commuting zone, and the main independent variable is the number of full-time employed internationally trained nurses aged 25–70 years per 1,000 population in a commuting zone. For the specification, the 2SLS model including controls and fixed effects is applied. The instrument is constructed by using the historical distribution of skilled immigrants, excluding those who are registered nurses, across commuting zones in 1980 to allocate the national inflow of foreign-educated nurses to each commuting zone. All specifications are weighted by the whole population in the commuting zone. Standard errors in parentheses are clustered at the commuting zone level. Significance is indicated by the symbol * at the 10% level, ** at the 5% level, and *** at the 1% level.
Table 6
Displacement effects of foreign-educated RNs on US-trained RNs by education
| Dependent variable: US-educated nurses per 1,000 population | ||||||||||
|---|---|---|---|---|---|---|---|---|---|---|
| 1990-2015 | 2000-2015 | |||||||||
| (1) | (2) | (3) | (4) | (5) | (6) | (7) | (8) | (9) | (10) | |
| Less than high school | High school | Associate's degree | Bachelor's degree | Graduate degree | Less than high school | High school | Associate's degree | Bachelor's degree | Graduate degree | |
| Foreign-educated nurses per 1,000 population | 0.019 | 0.207 | 0.840 | 0.158 | 0.658* | 0.024 | 0.175 | 0.715 | 0.041 | 0.924** |
| (0.039) | (0.249) | (0.829) | (0.668) | (0.431) | (0.053) | (0.288) | (0.105) | (0.730) | (0.647) | |
| Observations | 700 | 700 | 700 | 700 | 700 | 560 | 560 | 560 | 560 | 560 |
| R2 | 0.421 | 0.890 | 0.853 | 0.900 | 0.755 | 0.383 | 0.878 | 0.902 | 0.901 | 0.724 |
[i] RN, registered nurse; 2SLS, two-stage least squares.
Source: The data are from the US Censuses and the American Community Survey multiyear aggregates.
Notes: The dependent variable is the number of full-time employed US-trained nurses aged 25-70 years per 1,000 population by education levels in a commuting zone, and the main independent variable is the number of full-time employed internationally trained nurses aged 25-70 years per 1,000 population in a commuting zone. For the specification, the 2SLS model including controls and fixed effects is applied. The instrument is constructed by using the historical distribution of skilled immigrants, excluding those who are registered nurses, across commuting zones in 1980 to allocate the national inflow of foreign-educated nurses to each commuting zone. All specifications are weighted by the whole population in the commuting zone. Standard errors in parentheses are clustered at the commuting zone level. Significance is indicated by the symbol * at the 10% level, ** at the 5% level, and *** at the 1% level.
Table 7
Wage effects of foreign-educated RNs on US-educated RNs
| Dependent variable: Log (average hourly wages of US-educated nurses) | ||||||||||
|---|---|---|---|---|---|---|---|---|---|---|
| 1990–2015 | 2000–2015 | |||||||||
| (1) | (2) | (3) | (4) | (5) | (6) | (7) | (8) | (9) | (10) | |
| Employed US-educated nurses (2SLS – single instrument) | ||||||||||
| Foreign-educated nurses per 1,000 population | 0.218*** | 0.232 | –0.141 | –0.007 | –0.091 | 0.230*** | 0.389 | –0.119 | 0.048 | –0.091 |
| (0.046) | (0.169) | (0.135) | (0.084) | (0.242) | (0.049) | (0.290) | (0.173) | (0.119) | (0.242) | |
| Observations | 700 | 700 | 700 | 420 | 280 | 560 | 560 | 560 | 280 | 280 |
| R2 | 0.532 | 0.632 | 0.931 | 0.963 | 0.977 | 0.361 | 0.212 | 0.935 | 0.971 | 0.977 |
| Full-time employed US-educated nurses (2SLS – single instrument) | ||||||||||
| Foreign-educated nurses per 1,000 population | 0.210*** | 0.202 | –0.096 | –0.035 | 0.025 | 0.220*** | 0.342 | –0.071 | –0.010 | 0.025 |
| (0.039) | (0.142) | (0.109) | (0.081) | (0.161) | (0.041) | (0.249) | (0.134) | (0.129) | (0.161) | |
| Observations | 700 | 700 | 700 | 420 | 280 | 560 | 560 | 560 | 280 | 280 |
| R2 | 0.587 | 0.691 | 0.941 | 0.960 | 0.978 | 0.420 | 0.332 | 0.942 | 0.966 | 0.978 |
| Controls | X | X | X | X | X | X | X | X | ||
| Year FE | X | X | X | X | X | X | X | X | X | X |
| Area FE | X | X | X | X | X | X | ||||
| Pre-Great Recession | X | X | ||||||||
| Great Recession and Post-Great Recession | X | X | ||||||||
[i] BLS, Bureau of Labor Statistics; CPI-U, Consumer Price Index for All Urban Consumers; USEN, US-educated nurses; 2SLS, two-stage least squares; FE, fixed effects.
Source: The data are from the US Censuses and the American Community Survey multiyear aggregates.
Notes: The dependent variable is the average log hourly wages of native nurses in a commuting zone, and the main independent variable is the number of full-time employed internationally trained nurses aged 25–70 years per 1,000 population in a commuting zone. Wages are deflated so that they are in terms of the 1999 wages using the BLS CPI-U. Panel A examines the hourly wages of employed USTNs (both part time and full time), while Panel B focuses on the hourly wages of only full-time employed USTNs. For the 2SLS regressions, the instrument is constructed by using the historical distribution of skilled immigrants, excluding those who are registered nurses, across commuting zones in 1980 to allocate the national inflow of foreign-educated nurses to each commuting zone. All specifications are weighted by the whole population in the commuting zone. Standard errors in parentheses are clustered at the commuting zone level. Significance is indicated by the symbol * at the 10% level, ** at the 5% level, and *** at the 1% level.
Table 8
Reduced form and first stage results, 2000–2015 (multiple instrumentation)
| (1) | (2) | (3) | (4) | (5) | |
|---|---|---|---|---|---|
| Reduced Form | |||||
| Past settlement | –1.945** | –0.523* | 0.482 | 0.753 | –0.461 |
| (0.791) | (0.285) | (0.353) | (1.843) | (1.163) | |
| Lagged past settlement | –4.004*** | –1.218** | 0.233 | 0.854 | 1.915 |
| (0.838) | (0.605) | (0.631) | (2.227) | (2.861) | |
| First stages | |||||
| Dependent variable: foreign-educated nurse inflows | |||||
| Past settlement | 0.961*** | 0.282** | 0.291** | 0.474 | 0. 631 |
| (0.178) | (0.171) | (0.194) | (0.674) | (0.570) | |
| Lagged past settlement | 1.705*** | 0.180 | 0.293 | 0.144 | 0.215 |
| (0.466) | (0.205) | (0.256) | (0.761) | (1.160) | |
| Sanderson–Windmeijer multivariate F-statistics | 36.50 | 10.96 | 10.15 | 6.30 | 1.05 |
| [0.000] | [0.000] | [0.000] | [0.059] | [0.307] | |
| Dependent variable: lagged foreign-educated nurse inflows | |||||
| Past settlement | 0.420* | –0.088 | –0.222 | 0.512 | 0.170 |
| (0.216) | (0.169) | (0.216) | (0.558) | (0.570) | |
| Lagged past settlement | 2.046*** | 0.660*** | 0.492** | 0.110* | –0.609 |
| (0.527) | (0.252) | (0.329) | (0.601) | (1.239) | |
| Sanderson–Windmeijer multivariate F-statistics | 36.80 | 25.45 | 26.69 | 7.37 | 5.60 |
| [0.000] | [0.000] | [0.000] | [0.008] | [0.458] | |
| Controls | X | X | X | X | |
| Year FE | X | X | X | X | X |
| Area FE | X | X | X | ||
| Pre-Great Recession | X | ||||
| Great Recession and Post-Great Recession | X | ||||
[i] FE, fixed effects; OLS, ordinary least squares.
Source: The data are from the US Censuses and the American Community Survey multiyear aggregates.
Notes: The reduced form reports the slope coefficients from an OLS regression of the number of full-time employed native nurses aged 25–70 years per 1,000 population in a commuting zone on both instruments. The dependent variable in the first-stage regressions is the number of full-time employed foreign-educated nurses aged 25–70 years per 1,000 population in a commuting zone. The two instruments are constructed by using the 1980 distribution of skilled immigrants, excluding those who are registered nurses, across commuting zones to allocate the national inflow of foreign-educated nurses to each commuting zone. All specifications are weighted by the whole population in the commuting zone. Standard errors in parentheses are clustered at the commuting zone level. The p-values of the F-statistics are in brackets. Significance is indicated by the symbol * at the 10% level, ** at the 5% level, and *** at the 1% level.
Table 9
Displacement effects of foreign-educated RNs on US-educated RNs, 2000–2015
| Dependent variable: US-educated nurses per 1,000 population | |||||
|---|---|---|---|---|---|
| (1) | (2) | (3) | (4) | (5) | |
| 2SLS (single instrument) | |||||
| Foreign-educated nurses per 1,000 population | –2.223*** | –3.018* | 1.878* | 0.237 | 0.970 |
| (0.476) | (1.734) | (1.355) | (1.495) | (1.487) | |
| R2 | 0.374 | 0.664 | 0.931 | 0.975 | 0.967 |
| 2SLS (multiple instruments) | |||||
| Foreign-educated nurses per 1,000 population | –1.837* | –2.245 | 1.389 | 0.878 | 0.333 |
| (1.010) | (1.701) | (0.797) | (1.890) | (1.899) | |
| Lagged foreign-educated nurses per 1,000 population | –1.426* | –1.236* | –0.035 | 0.068 | 3.025 |
| (0.552) | (0.749) | (0.825) | (1.439) | (1.602) | |
| R2 | 0.379 | 0.658 | 0.938 | 0.972 | 0.938 |
| Controls | X | X | X | X | |
| Year FE | X | X | X | X | X |
| Area FE | X | X | X | ||
| Pre-Great Recession | X | ||||
| Great Recession and Post-Great Recession | X | ||||
[i] RN, registered nurse; FE, fixed effect; 2SLS, two-stage least squares.
Source: The data are from the US Censuses and the American Community Survey multiyear aggregates.
Notes: The dependent variable is the number of full-time employed US-trained nurses aged 25–70 years in the respective age group per 1,000 population in a commuting zone, and the main two independent variables are the number of full-time employed, internationally trained nurses aged 25–70 years per 1,000 population in a commuting zone and its lag. For the 2SLS regressions, two instruments are constructed by using the historical distribution of skilled immigrants, excluding those who are registered nurses, across commuting zones in 1980 to allocate the national inflow of foreign-educated nurses to each commuting zone. All specifications are weighted by the whole population in the commuting zone. Standard errors in parentheses are clustered at the commuting zone level. Significance is indicated by the symbol * at the 10% level, ** at the 5% level, and *** at the 1% level.
Table 10
Displacement effects of foreign-educated RNs on US-trained RNs by age, 2000–2015
| Dependent variable: US-educated nurses per 1,000 population | |||||||||
|---|---|---|---|---|---|---|---|---|---|
| 25–29 | 30–34 | 35–39 | 40–44 | 45–49 | 50–54 | 55–59 | 60–64 | 65–70 | |
| (1) | (2) | (3) | (4) | (5) | (6) | (7) | (8) | (9) | |
| 2SLS (single instrument) | |||||||||
| Foreign-educated nurses per 1,000 population | 0.906** | –0.068 | 0.431 | –0.514 | –0.047 | 0.040 | 0.135 | 0.569 | 0.125 |
| (0.761) | (0.391) | (0.594) | (0.489) | (0.450) | (0.397) | (0.429) | (0.545) | (0.181) | |
| R2 | 0.497 | 0.736 | 0.703 | 0.783 | 0.808 | 0.824 | 0.863 | 0.743 | 0.691 |
| 2SLS (multiple instruments) | |||||||||
| Foreign-educated nurses per 1,000 population | 0.533 | –0.134 | 0.673 | –0.346 | 0.003 | –0.081 | 0.323 | 0.379 | 0.039 |
| (0.508) | (0.375) | (0.549) | (0.439) | (0.284) | (0.319) | (0.280) | (0.480) | (0.116) | |
| Lagged foreign-educated nurses per 1,000 population | –0.488* | –0.048 | 0.175 | 0.122 | 0.036 | –0.088 | 0.136 | –0.138 | –0.062 |
| (0.308) | (0.219) | (0.295) | (0.145) | (0.211) | (0.206) | (0.221) | (0.181) | (0.088) | |
| R2 | 0.721 | 0.734 | 0.648 | 0.811 | 0.810 | 0.824 | 0.843 | 0.795 | 0.721 |
[i] RN, registered nurse; 2SLS, two-stage least squares.
Source: The data are from the US Censuses and the American Community Survey multiyear aggregates.
Notes: The dependent variable is the number of full-time employed US-trained nurses aged 25–70 years in the respective age group per 1,000 population in a commuting zone, and the two main independent variables are the number of full-time employed, internationally trained nurses aged 25–70 years per 1,000 population in a commuting zone and its lag. For the 2SLS regressions, two instruments are constructed by using the historical distribution of skilled immigrants, excluding those who are registered nurses, across commuting zones in 1980 to allocate the national inflow of foreign-educated nurses to each commuting zone. All specifications are weighted by the whole population in the commuting zone. Standard errors in parentheses are clustered at the commuting zone level. Significance is indicated by the symbol * at the 10% level, ** at the 5% level, and *** at the 1% level.
Table 11
Displacement effects of the foreign-educated RNs on US-educated RNs by education, 2000–2015
| Dependent variable: US-educated nurses per 1,000 population | |||
|---|---|---|---|
| Associate’s degree | Bachelor’s degree | Graduate degree | |
| (1) | (2) | (3) | |
| 2SLS (single instrument) | |||
| Foreign-educated nurses per 1,000 population | 0.715 | 0.041 | 0.924** |
| (0.105) | (0.730) | (0.647) | |
| R2 | 0.902 | 0.901 | 0.724 |
| 2SLS (multiple instruments) | |||
| Foreign-educated nurses per 1,000 population | 0.771 | –0.279 | 0.882* |
| (0.775) | (0.939) | (0.497) | |
| Lagged foreign-educated nurses per 1,000 population | 0.041 | –0.232 | –0.030 |
| (0.530) | (0.380) | (0.310) | |
| R2 | 0.900 | 0.895 | 0.734 |
[i] RN, registered nurse; 2SLS, two-stage least squares.
Source: The data are from the US Censuses and the American Community Survey multiyear aggregates.
Notes: The dependent variable is the number of full-time employed, US-trained nurses aged 25–70 years in the respective education group per 1,000 population in a commuting zone, and the two main independent variables are the number of full-time employed, internationally trained nurses aged 25–70 years per 1,000 population in a commuting zone and its lag. For the 2SLS regressions, two instruments are constructed by using the historical distribution of skilled immigrants, excluding those who are registered nurses, across commuting zones in 1980 to allocate the national inflow of foreign-educated nurses to each commuting zone. All specifications are weighted by the whole population in the commuting zone. Standard errors in parentheses are clustered at the commuting zone level. Significance is indicated by the symbol * at the 10% level, ** at the 5% level, and *** at the 1% level.
Table 12
Wage effects of foreign-educated RNs on US-educated RNs, 2000–2015
| Dependent variable: log (average hourly wages of US-educated nurses) | ||||||||||
|---|---|---|---|---|---|---|---|---|---|---|
| Employed USENs | Full-time employed USENs | |||||||||
| (1) | (2) | (3) | (4) | (5) | (6) | (7) | (8) | (9) | (10) | |
| 2SLS (single instrument) | ||||||||||
| Foreign-educated nurses per 1,000 population | 0.230*** | 0.389 | –0.119 | 0.048 | –0.091 | 0.220*** | 0.342 | –0.071 | –0.010 | 0.025 |
| (0.049) | (0.290) | (0.173) | (0.119) | (0.242) | (0.041) | (0.249) | (0.134) | (0.129) | (0.161) | |
| R2 | 0.361 | 0.512 | 0.935 | 0.971 | 0.977 | 0.420 | 0.532 | 0.942 | 0.966 | 0.978 |
| 2SLS (multiple instruments) | ||||||||||
| Foreign-educated nurses per 1,000 population | 0.117** | 0.198 | 0.043 | 0.008 | –0.149 | 0.107*** | 0.169 | 0.105 | 0.060 | –0.034 |
| (0.046) | (0.303) | (0.100) | (0.154) | (0.372) | (0.038) | (0.261) | (0.082) | (0.157) | (0.304) | |
| Lagged foreign-educated nurses per 1,000 population | 0.125** | 0.306* | 0.118** | –0.041 | –0.277 | 0.125*** | 0.277* | 0.127** | 0.071 | –0.278 |
| (0.051) | (0.184) | (0.060) | (0.108) | (0.694) | (0.046) | (0.161) | (0.061) | (0.120) | (0.160) | |
| R2 | 0.371 | 0.470 | 0.950 | 0.971 | 0.935 | 0.433 | 0.411 | 0.939 | 0.966 | 0.932 |
| Controls | X | X | X | X | X | X | X | X | ||
| Year FE | X | X | X | X | X | X | X | X | X | X |
| Area FE | X | X | X | X | X | X | ||||
| Pre-Great Recession | X | X | ||||||||
| Great Recession and Post-Great Recession | X | X | ||||||||
[i] RN, registered nurse; 2SLS, two-stage least squares; BLS, Bureau of Labor Statistics; CPI-U, Consumer Price Index for All Urban Consumers; FE, fixed effects; USEN, US-educated nurses.
Source: The data are from the US Censuses and the American Community Survey multiyear aggregates.
Notes: The dependent variable is the average log hourly wages of native nurses in a commuting zone, and two main independent variables are the number of full-time employed, internationally trained nurses aged 25–70 years per 1,000 population in a commuting zone and its lag. Wages are deflated so that they are in terms of the 1999 wages using the BLS CPI-U. For the 2SLS regressions, the double instruments are constructed by using the historical distribution of skilled immigrants, excluding those who are registered nurses, across commuting zones in 1980 to allocate the national inflow of foreign-educated nurses to each commuting zone. All specifications are weighted by the whole population in the commuting zone. Standard errors in parentheses are clustered at the commuting zone level. Significance is indicated by the symbol * at the 10% level, ** at the 5% level, and *** at the 1% level.
Table A1
List of the 140 commuting zones (CZs)
| CZ | State | Metro status | CZ | State | Metro status |
|---|---|---|---|---|---|
| 302 | Tennessee | Mixed | 19600 | New Jersey | Metro |
| 401 | North Carolina | Mixed | 19700 | Pennsylvania | Metro |
| 500 | North Carolina | Mixed | 19800 | Delaware | Metro |
| 900 | North Carolina | Mixed | 19902 | Maryland | Mixed |
| 1100 | North Carolina | Mixed | 20001 | Maine | Mixed |
| 1203 | North Carolina | Mixed | 20003 | Maine | Nonmetro |
| 1701 | North Carolina | Mixed | 20100 | Maine | Mixed |
| 1900 | North Carolina | Mixed | 20200 | Vermont | Mixed |
| 2000 | Virginia | Mixed | 20302 | Vermont | Nonmetro |
| 2400 | Virginia | Metro | 20401 | Rhode Island | Metro |
| 2500 | Virginia | Mixed | 20500 | Massachusetts | Metro |
| 2700 | Mississippi | Mixed | 20600 | New Hampshire | Mixed |
| 3003 | Mississippi | Mixed | 20800 | Massachusetts | Metro |
| 3300 | Louisiana | Mixed | 20901 | Connecticut | Mixed |
| 3901 | Louisiana | Mixed | 21501 | Minnesota | Metro |
| 4200 | Arkansas | Mixed | 23100 | Wisconsin | Mixed |
| 5202 | Tennessee | Metro | 23500 | Illinois | Mixed |
| 5600 | Tennessee | Metro | 23801 | Illinois | Metro |
| 6000 | Alabama | Mixed | 23900 | Illinois | Mixed |
| 6700 | Florida | Metro | 24100 | Wisconsin | Mixed |
| 6800 | Florida | Mixed | 24300 | Illinois | Metro |
| 6900 | Florida | Mixed | 24400 | Illinois | Mixed |
| 7000 | Florida | Mixed | 24701 | Missouri | Mixed |
| 7100 | Florida | Mixed | 24802 | Illinois | Mixed |
| 7200 | Florida | Metro | 28401 | Colorado | Mixed |
| 7300 | Florida | Metro | 28900 | Colorado | Metro |
| 7400 | Florida | Mixed | 29301 | Kansas | Mixed |
| 7500 | Florida | Mixed | 29502 | Missouri | Mixed |
| 7600 | Florida | Mixed | 30601 | Texas | Mixed |
| 7800 | Florida | Mixed | 30802 | Texas | Mixed |
| 7900 | Florida | Mixed | 31201 | Texas | Mixed |
| 8202 | South Carolina | Mixed | 31301 | Texas | Mixed |
| 8401 | Georgia | Mixed | 31401 | Texas | Mixed |
| 8800 | Georgia | Mixed | 31600 | Texas | Mixed |
| 8900 | Georgia | Mixed | 31700 | Texas | Mixed |
| 9100 | Georgia | Mixed | 31800 | Texas | Mixed |
| 9400 | Georgia | Mixed | 31900 | Texas | Mixed |
| 9701 | Georgia | Mixed | 32000 | Texas | Mixed |
| 9900 | Florida | Mixed | 32100 | Texas | Mixed |
| 10900 | Florida | Mixed | 32201 | Texas | Nonmetro |
| 11101 | Alabama | Mixed | 32801 | Texas | Mixed |
| 11302 | Maryland | Metro | 32900 | Texas | Metro |
| 11304 | Maryland | Mixed | 33000 | Texas | Mixed |
| 11600 | Michigan | Mixed | 33100 | Texas | Mixed |
| 11700 | Michigan | Metro | 33300 | Texas | Mixed |
| 11900 | Michigan | Mixed | 33803 | Oklahoma | Mixed |
| 12200 | Michigan | Mixed | 34102 | Alaska | Mixed |
| 12501 | Ohio | Mixed | 34701 | Hawaii | Metro |
| 12701 | Ohio | Mixed | 34901 | New Mexico | Mixed |
| 13501 | Ohio | Mixed | 35001 | Arizona | Mixed |
| 13600 | Indiana | Mixed | 35100 | Arizona | Mixed |
| 14200 | Indiana | Mixed | 35600 | Hawaii | Nonmetro |
| 14900 | Indiana | Metro | 36100 | Utah | Mixed |
| 15200 | Ohio | Mixed | 37000 | California | Mixed |
| 15900 | Ohio | Mixed | 37100 | California | Metro |
| 16300 | Pennsylvania | Mixed | 37200 | California | Metro |
| 16400 | Ohio | Mixed | 37300 | California | Mixed |
| 16600 | Virginia | Mixed | 37400 | California | Mixed |
| 17400 | Pennsylvania | Mixed | 37500 | California | Metro |
| 17600 | Virginia | Mixed | 37604 | Nevada | Mixed |
| 17700 | New York | Mixed | 37700 | California | Mixed |
| 17800 | New York | Nonmetro | 37800 | California | Metro |
| 17900 | New York | Mixed | 37901 | Nevada | Mixed |
| 18000 | New York | Mixed | 38000 | California | Metro |
| 18600 | New York | Mixed | 38200 | California | Metro |
| 18800 | Pennsylvania | Mixed | 38300 | California | Mixed |
| 19100 | Pennsylvania | Mixed | 38601 | Washington | Mixed |
| 19300 | New York | Mixed | 38801 | Oregon | Metro |
| 19400 | New York | Metro | 38901 | Oregon | Mixed |
| 19500 | New Jersey | Metro | 39400 | Washington | Mixed |
[i] Notes: Metro status indicates whether the individual resided within a metropolitan area and, for individuals in metropolitan areas, whether the individual resided within or outside of a central/principal city. If a commuting zone lies only partially within a metropolitan area or central/principal city, then its metro status is mixed.
Table A2
Numbers of commuting zones with few nurses
| 1990 | 2000 | 2007 | 2010 | 2015 | ||
|---|---|---|---|---|---|---|
| USEN | Zero | 0 | 0 | 0 | 0 | 0 |
| >0 & <5 | 5 | 5 | 0 | 3 | 22 | |
| >0 & <10 | 5 | 9 | 3 | 3 | 39 | |
| FEN | Zero | 215 | 180 | 197 | 193 | 217 |
| >0 & <5 | 40 | 41 | 32 | 36 | 85 | |
| >0 & <10 | 66 | 63 | 50 | 48 | 109 |
[i] USEN, US-educated nurses; FENs, foreign-educated nurses.
Notes: The data are from the US Censuses and the American Community Survey multiyear aggregates. The samples are restricted to employed registered nurses aged 25–70 years old. The table shows the numbers of commuting zones with few nurses across the United States.