
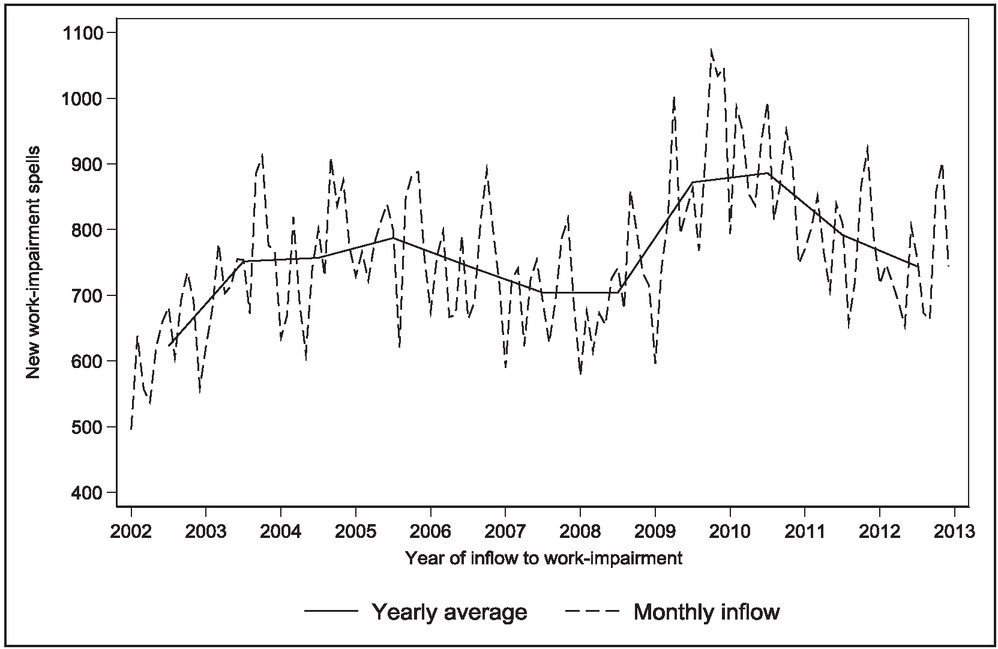
Figure 1
Inflow into work impairment by the month of entry. Young people 18-26 years of age in the period 2002–2012.
Note: The figure includes only youths aged 26 or under, as older youths are not equally represented over the evaluation period in our data.
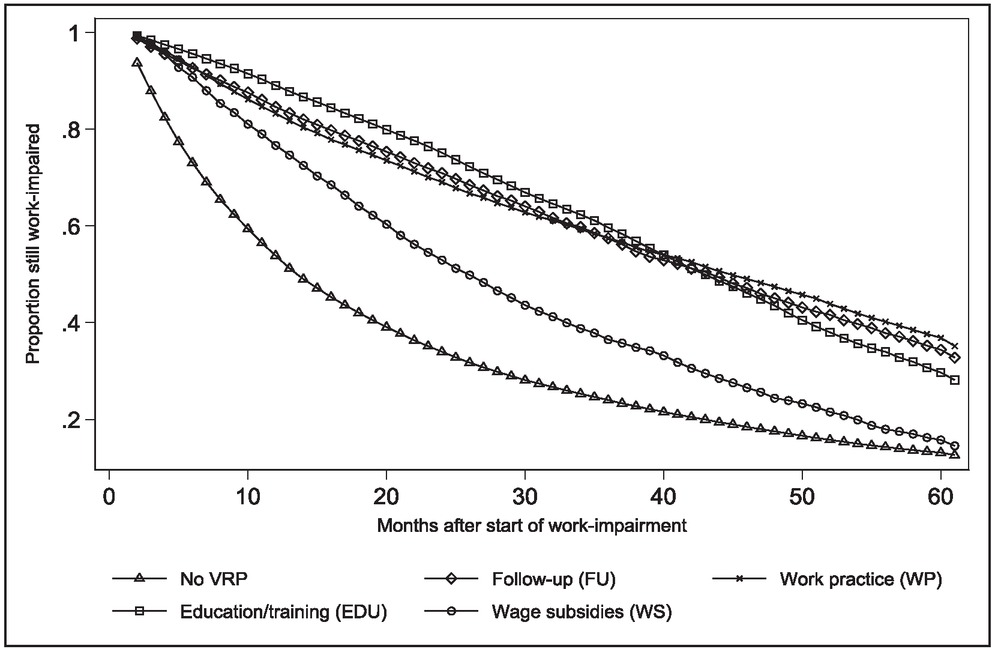
Figure 2
Survival curves by vocational rehabilitation program (VRP) status. Young people 18-29 years of age in the period 2002–2012.
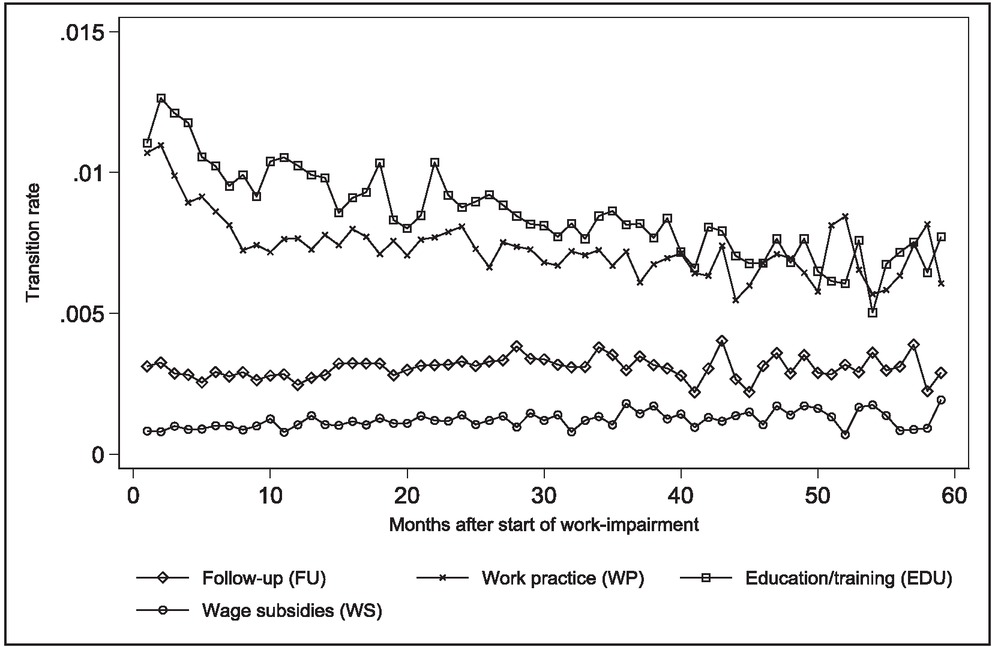
Figure 3
Monthly transition rates into vocational rehabilitation programs (VRPs). Young people 18-29 years of age in the period 2002–2012.
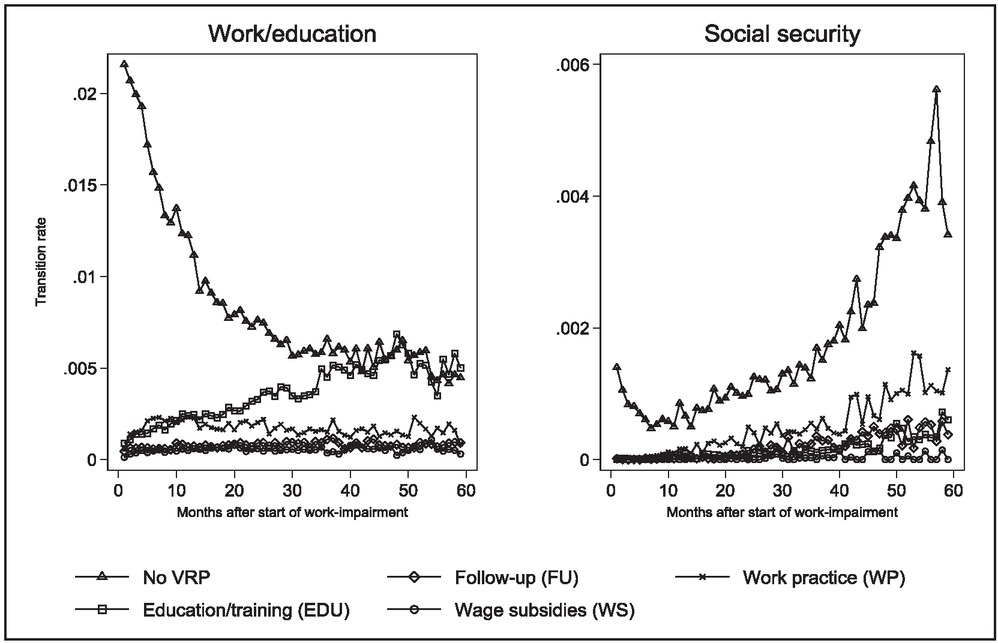
Figure 4
Monthly transition into work/education and social security, by vocational rehabilitation program (VRP) status. Young people 18-29 years of age during the period 2002–2012.
Table 1
Sample means by VRP status
| No program | Follow-up (FU) | Work practice (WP) | Education/ training (EDU) | Wage subsidies (WS) | |
|---|---|---|---|---|---|
| (1) | (2) | (3) | (4) | (5) | |
| Individual characteristics | |||||
| Age group (years) | |||||
| 18–20 | 0.209 | 0.259 | 0.330 | 0.180 | 0.173 |
| 21–24 | 0.365 | 0.375 | 0.348 | 0.341 | 0.388 |
| 25–29 | 0.426 | 0.366 | 0.322 | 0.479 | 0.439 |
| Female | 0.481 | 0.429 | 0.460 | 0.501 | 0.229 |
| Immigrant | 0.067 | 0.064 | 0.065 | 0.072 | 0.054 |
| Completed upper secondary education | 0.336 | 0.249 | 0.216 | 0.421 | 0.324 |
| Activity before entering work impairment | |||||
| In education | 0.405 | 0.466 | 0.496 | 0.447 | 0.393 |
| In employment | 0.536 | 0.431 | 0.379 | 0.599 | 0.596 |
| Mean income 3 years before entering work impairment | |||||
| Labor income, BA | 1.485 | 1.061 | 0.935 | 1.767 | 1.620 |
| Nontaxable transfers, BA | 0.395 | 0.388 | 0.403 | 0.356 | 0.309 |
| Taxable transfers, BA | 0.248 | 0.268 | 0.232 | 0.241 | 0.282 |
| Parental background | |||||
| Higher-educated parents | 0.221 | 0.206 | 0.199 | 0.257 | 0.175 |
| Parents’ labor income, BA | 7.723 | 7.569 | 7.415 | 7.992 | 7.695 |
| Parents’ transfers, BA | 2.303 | 2.486 | 2.445 | 2.169 | 2.195 |
| Region of residence | |||||
| Eastern Norway | 0.496 | 0.473 | 0.446 | 0.499 | 0.388 |
| Southern Norway | 0.072 | 0.094 | 0.081 | 0.074 | 0.110 |
| Western Norway | 0.242 | 0.249 | 0.234 | 0.235 | 0.276 |
| Middle Norway | 0.087 | 0.100 | 0.125 | 0.078 | 0.115 |
| Northern Norway | 0.103 | 0.084 | 0.113 | 0.113 | 0.113 |
| Receiving health-related benefits | 0.521 | 0.373 | 0.387 | 0.440 | 0.255 |
| Spell characteristics | |||||
| Duration of work impairment, months | 20.524 | 29.767 | 27.221 | 31.275 | 26.585 |
| Duration of VRP, months | 0.000 | 8.827 | 7.909 | 13.016 | 8.090 |
| Transition to work | 0.381 | 0.238 | 0.185 | 0.251 | 0.494 |
| Transition to education | 0.114 | 0.050 | 0.059 | 0.106 | 0.041 |
| Transition to permanent disability | 0.064 | 0.053 | 0.048 | 0.020 | 0.018 |
| Transition to social assistance | 0.086 | 0.038 | 0.041 | 0.018 | 0.026 |
| Transition to unemployment | 0.141 | 0.070 | 0.065 | 0.086 | 0.124 |
| Transition to unknown state | 0.063 | 0.036 | 0.037 | 0.112 | 0.047 |
| Censored due to time | 0.151 | 0.209 | 0.176 | 0.026 | 0.128 |
| Censored due to transition new VRP | 0.000 | 0.306 | 0.389 | 0.327 | 0.122 |
| Observations | 70,590 | 8,305 | 23,189 | 25,512 | 3,038 |
[i] VRP, vocational rehabilitation program; BA, basic amounts.
Notes: Column 1 shows means for spells without VR participation, and columns 2–5 show means for spells with VR participation. All variables are measured at the start of the work-impairment spell. The income variables are all measured in BA. In 2018, one BA was equivalent to NOK 96883 (approx. 10,000 euros). Health-related benefits include rehabilitation benefits, vocational benefits, time-limited disability benefits (before 2010), and work-assessment allowance (after 2010). Taxable transfers include pensions from the National Insurance scheme, occupational pensions, sickness benefits (before 2006), and unemployment benefits, whereas nontaxable transfers include among others child benefit, housing benefit, social assistance, and student scholarship.
Table 2
Effect of vocational rehabilitation programs (VRPs) during and after program participation on the transition to social security and job/education
| Transition to social security | Transition to job/education | |||
|---|---|---|---|---|
| Under VRP | After VRP | Under VRP | After VRP | |
| Follow-up (FU) | 0.034 (0.067) | 0.237*** (0.074) | 0.470*** (0.034) | 0.367*** (0.043) |
| Work practice (WP) | −0.061 (0.040) | 0.136*** (0.045) | 0.251*** (0.024) | 0.273*** (0.028) |
| Training/education (EDU) | −0.736*** (0.054) | −0.083 (0.057) | 0.088*** (0.021) | 0.491*** (0.027) |
| Wage subsidies (WS) | −0.598*** (0.117) | −0.242 (0.169) | 0.691*** (0.043) | 0.918*** (0.069) |
[i] Notes: * indicates significance at the 10% level, ** at the 5% level, and *** at the 1% level. In addition to the treatment effects, the estimations include controls for age, gender, immigrant background, education level, activity before work impairment, previous income, parental background, region of residence, indicator for health-related benefit receipt, local unemployment rate, duration dependence, and calendar variables. Complete estimation results are included in the appendix. The preferred model has eight mass points in the unobserved heterogeneity distribution.
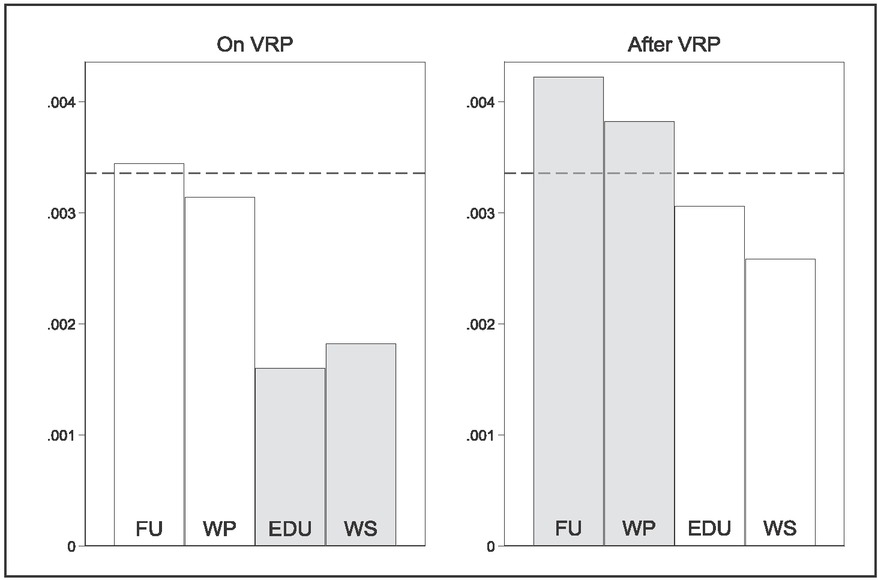
Figure 5
The effect of vocational rehabilitation program (VRP) on the transition to social security.
Notes: FU, follow-up; WP, work practice; EDU, education/training; WS, wages subsidies. The dashed line shows the transition probability for a reference person who did not participate in any VRP, and who has been registered as work impaired for 6–10 months. The reference person is a male, aged 22–25 years, living in Eastern Norway, native-born, with no completed upper secondary education, with average parental background, by average youth unemployment.
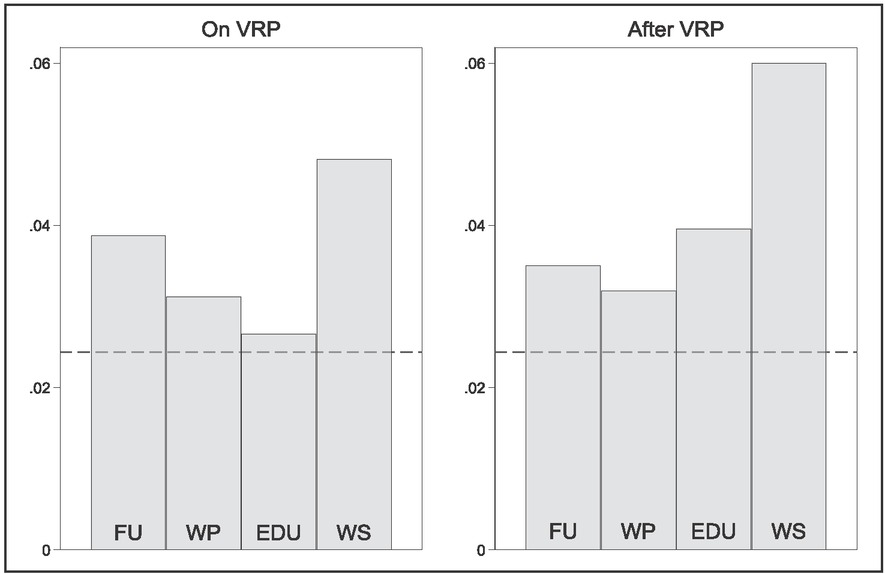
Figure 6
The effect of the vocational rehabilitation program (VRP) on the transition to job/ education. FU, follow-up; WP, work practice; EDU, education/training; WS, Wages Subsidies.
Notes: The dashed line shows the transition probability for a reference person who does not participate in any VRP, and who has been registered as work impaired for 6–10 months. The reference person is a male, aged 22–25, living in Eastern Norway, native-born, with no completed upper secondary education, with average parental background, by average youth unemployment.
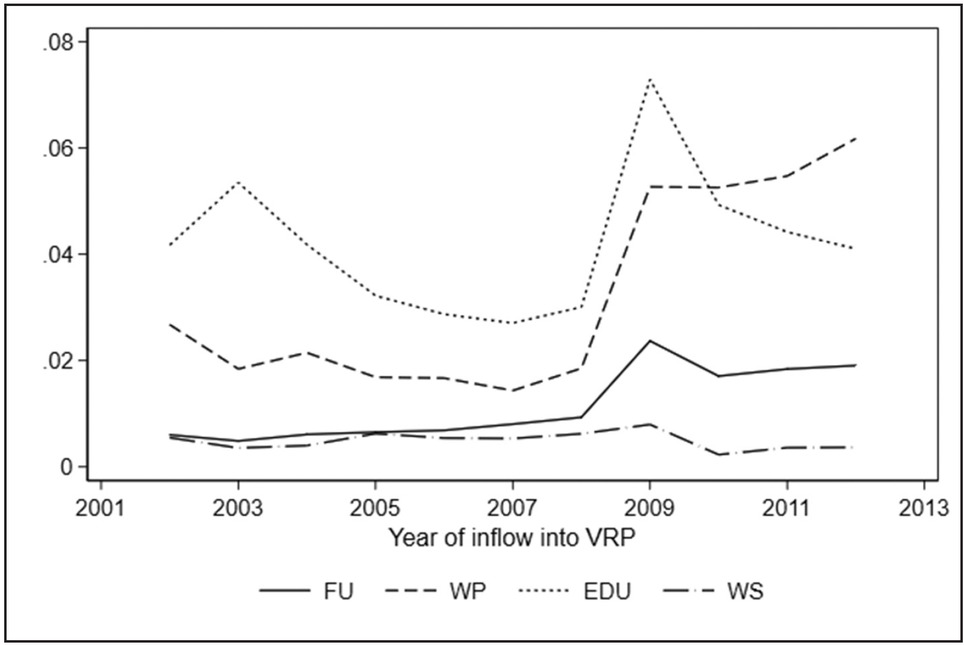
Figure 7
Yearly inflow into vocational rehabilitation program (VRP), as share of all ongoing work-impairment spells. Young people 18-29 years of age old.
Note: FU, Follow-up; WP, work practice; EDU, education/training; WS wage subsidies.
Table 3
Effect of vocational rehabilitation programs (VRPs) during and after program participation on the transition to social security and job/education: Robustness tests
| To social security | To job/education | |||||||||
|---|---|---|---|---|---|---|---|---|---|---|
| Original model | Time-varying health | BIC | HQIC | Before 2009 | Original model | Time-varying health | BIC | HQIC | Before 2009 | |
| Under treatment | ||||||||||
| FU | 0.034 | –0.030 | 0.070 | 0.082 | 0.354*** | 0.470*** | 0.330*** | 0.480*** | 0.469*** | 0.559*** |
| (0.067) | (0.064) | (0.063) | (0.064) | (0.074) | (0.034) | (0.036) | (0.033) | (0.034) | (0.042) | |
| WP | –0.061 | –0.098** | –0.071* | –0.063 | 0.333*** | 0.251*** | 0.119*** | 0.264*** | 0.258*** | 0.546*** |
| (0.040) | (0.040) | (0.040) | (0.040) | (0.046) | (0.024) | (0.025) | (0.024) | (0.024) | (0.029) | |
| EDU | –0.736*** | –0.895*** | –0.660*** | –0.722*** | –0.534*** | 0.088*** | –0.107*** | 0.072*** | 0.089*** | 0.220*** |
| (0.054) | (0.053) | (0.052) | (0.054) | (0.061) | (0.021) | (0.021) | (0.020) | (0.021) | (0.024) | |
| WS | –0.598*** | –0.684*** | –0.523*** | –0.575*** | –0.528*** | 0.691*** | 0.808*** | 0.683*** | 0.693*** | 0.797*** |
| (0.117) | (0.115) | (0.113) | (0.115) | (0.123) | (0.043) | (0.046) | (0.042) | (0.043) | (0.046) | |
| After treatment | ||||||||||
| FU | 0.237*** | 0.212*** | 0.246*** | 0.263*** | 0.301*** | 0.367*** | 0.443*** | 0.377*** | 0.366*** | 0.018 |
| (0.074) | (0.071) | (0.064) | (0.071) | (0.095) | (0.043) | (0.045) | (0.043) | (0.043) | (0.070) | |
| WP | 0.136*** | 0.119*** | 0.115*** | 0.127*** | 0.162*** | 0.273*** | 0.307*** | 0.281*** | 0.277*** | 0.031 |
| (0.045) | (0.045) | (0.040) | (0.045) | (0.060) | (0.028) | (0.029) | (0.028) | (0.028) | (0.044) | |
| EDU | –0.083 | –0.182*** | 0.005 | –0.072 | –0.066 | 0.491*** | 0.574*** | 0.474*** | 0.493*** | 0.455*** |
| (0.057) | (0.056) | (0.054) | (0.057) | (0.074) | (0.027) | (0.028) | (0.027) | (0.027) | (0.035) | |
| WS | –0.242 | –0.297* | –0.146 | –0.217 | –0.284 | 0.918*** | 1.129*** | 0.900*** | 0.913*** | 0.554*** |
| (0.169) | (0.169) | (0.115) | (0.170) | (0.195) | (0.069) | (0.073) | (0.069) | (0.069) | (0.096) | |
[i] BIC, Bayesian information criterion; HQIC, Hannan–Quinn information criterion; FU, follow-up; WP, work practice; EDU, education/training; WS, wage subsidies.
Notes: * indicates significance at the 10% level, ** at the 5% level, and *** at the 1% level. In addition to the treatment effects, the estimations include controls for age, gender, immigrant background, education level, activity before work impairment, previous income, parental background, region of residence, indicator for health-related benefit receipt, local unemployment rate, duration dependence, and calendar variables. The original model has eight mass points in the heterogeneity distribution, whereas the model with time-varying health has nine mass points. The BIC and HQIQ models have five and six mass points, respectively, while the model with spells starting before 2009 has nine mass points.
Table A1
Complete estimation results: Transitions to vocational rehabilitation programs (VRP)
| FU | WP | EDU | WS | |
|---|---|---|---|---|
| Coefficient (SE) | Coefficient (SE) | Coefficient (SE) | Coefficient (SE) | |
| Completed upper section education | −0.048 (0.034) | −0.159 (0.022) | 0.443 (0.018) | 0.142 (0.052) |
| Receiving health-related benefits | −0.576 (0.037) | −0.461 (0.023) | −0.096 (0.023) | −2.273 (0.061) |
| Non-European immigrant | −0.184 (0.062) | −0.210 (0.038) | 0.293 (0.035) | −0.501 (0.110) |
| Female | −0.350 (0.028) | −0.168 (0.017) | −0.065 (0.016) | −1.102 (0.053) |
| Income last 3 years prior to work impairment | ||||
| Nontaxable transfers | −0.180 (0.033) | −0.059 (0.019) | 0.075 (0.018) | −0.212 (0.059) |
| Taxable transfers | 0.095 (0.029) | 0.014 (0.019) | 0.002 (0.018) | 0.232 (0.047) |
| Labor income | −0.075 (0.015) | −0.049 (0.009) | 0.143 (0.007) | 0.058 (0.020) |
| Parents’ income average (7–17 years) | ||||
| Transfers | 0.004 (0.007) | −0.027 (0.005) | −0.016 (0.004) | −0.032 (0.012) |
| Labor income | −0.004 (0.004) | −0.015 (0.002) | 0.003 (0.002) | 0.010 (0.006) |
| Higher-educated parents | −0.219 (0.036) | −0.200 (0.022) | 0.098 (0.019) | −0.330 (0.060) |
| Local youth unemployment rate | 0.009 (0.011) | 0.022 (0.006) | 0.015 (0.006) | −0.021 (0.017) |
| Activity year prior to work impairment | ||||
| In education | 0.189 (0.032) | 0.115 (0.020) | 0.273 (0.018) | 0.100 (0.053) |
| Employed | 0.007 (0.037) | −0.103 (0.024) | 0.133 (0.021) | 0.402 (0.059) |
| Year dummies (2002 reference) | ||||
| Year 2003 | −0.372 (0.190) | −0.431 (0.092) | 0.179 (0.067) | −0.693 (0.211) |
| Year 2004 | −0.129 (0.174) | −0.194 (0.084) | 0.051 (0.066) | −0.629 (0.192) |
| Year 2005 | −0.005 (0.167) | −0.359 (0.084) | −0.061 (0.066) | −0.109 (0.177) |
| Year 2006 | 0.028 (0.166) | −0.252 (0.083) | −0.105 (0.066) | −0.282 (0.178) |
| Year 2007 | 0.259 (0.165) | −0.355 (0.085) | −0.056 (0.068) | −0.197 (0.179) |
| Year 2008 | 0.517 (0.164) | −0.126 (0.084) | 0.077 (0.067) | 0.026 (0.178) |
| Year 2009 | 1.571 (0.158) | 1.073 (0.077) | 1.063 (0.062) | 0.557 (0.174) |
| Year 2010 | 1.625 (0.158) | 1.326 (0.076) | 0.892 (0.063) | −0.208 (0.186) |
| Year 2011 | 1.794 (0.158) | 1.464 (0.077) | 0.817 (0.063) | 0.290 (0.180) |
| Year 2012 | 1.824 (0.159) | 1.586 (0.077) | 0.738 (0.064) | 0.428 (0.180) |
| Year 2013 | 1.916 (0.162) | 1.609 (0.080) | 0.553 (0.069) | 0.656 (0.186) |
| Year 2014 | 2.175 (0.168) | 1.690 (0.087) | 0.562 (0.078) | 0.655 (0.207) |
| Age category (21–24 reference) | ||||
| Age 18–20 | −0.177 (0.039) | 0.108 (0.024) | −0.001 (0.025) | −0.273 (0.070) |
| Age 25–29 | −0.184 (0.034) | −0.204 (0.022) | −0.033 (0.019) | −0.119 (0.053) |
| Duration of work-impairment spell (1–2 months reference) | ||||
| 3–4 months | −0.062 (0.057) | −0.100 (0.031) | 0.036 (0.028) | 0.277 (0.104) |
| 5–6 months | −0.081 (0.060) | −0.145 (0.033) | −0.087 (0.030) | 0.397 (0.108) |
| 7–10 months | −0.036 (0.053) | −0.301 (0.031) | −0.148 (0.027) | 0.598 (0.096) |
| 11–14 months | −0.038 (0.058) | −0.286 (0.033) | −0.080 (0.029) | 0.773 (0.102) |
| 15–18 months | 0.160 (0.059) | −0.273 (0.036) | −0.116 (0.032) | 0.966 (0.107) |
| 19–24 months | 0.140 (0.059) | −0.256 (0.036) | −0.149 (0.032) | 1.159 (0.106) |
| 25–30 months | 0.262 (0.064) | −0.303 (0.040) | −0.126 (0.036) | 1.261 (0.115) |
| 31–36 months | 0.278 (0.070) | −0.290 (0.045) | −0.167 (0.040) | 1.413 (0.123) |
| 37–48 months | 0.221 (0.070) | −0.340 (0.045) | −0.226 (0.041) | 1.640 (0.123) |
| 49+ months | 0.219 2 (0.083) | −0.339 (0.054) | −0.350 (0.051) | 1.776 (0.140) |
| Quarter (first-quarter reference) | ||||
| Quarter 2 | 0.004 (0.036) | 0.045 (0.022) | 0.443 (0.024) | 0.070 (0.062) |
| Quarter 3 | 0.114 (0.036) | 0.210 (0.022) | 0.954 (0.021) | 0.265 (0.060) |
| Quarter 4 | 0.327 (0.036) | 0.289 (0.022) | 0.339 (0.024) | 0.295 (0.061) |
| Region of residence (Eastern Norway reference) | ||||
| Southern Norway | 0.244 (0.048) | 0.191 (0.032) | −0.013 (0.030) | 0.570 (0.076) |
| Western Norway | 0.081 (0.035) | 0.085 (0.022) | 0.035 (0.019) | 0.273 (0.055) |
| Middle Norway | −0.012 (0.048) | 0.382 (0.028) | −0.158 (0.029) | 0.363 (0.074) |
| Northern Norway | −0.202 (0.050) | 0.181 (0.028) | 0.161 (0.026) | 0.241 (0.075) |
Table A2
Complete estimation results: Transitions to outcome states
| Social security | Job/education | |
|---|---|---|
| Coefficient SE | Coefficient SE | |
| Completed upper secondary education | −0.398 (0.027) | 0.350 (0.012) |
| Receiving health-related benefits | −1.088 (0.024) | −1.438 (0.013) |
| Non-European immigrant | −0.114 (0.040) | 0.121 (0.023) |
| Female | −0.391 (0.020) | 0.050 (0.011) |
| Income last 3 years prior to work impairment | 0.392 (0.019) | −0.120 (0.013) |
| Nontaxable transfers | ||
| Taxable transfers | 0.040 (0.019) | 0.027 (0.012) |
| Labor income | −0.109 (0.011) | 0.118 (0.005) |
| Parents’ income average, 7–17 years | ||
| Transfers | 0.025 (0.005) | −0.010 (0.003) |
| Labor income | 0.001 (0.003) | 0.006 (0.001) |
| Higher educated parents | −0.037 (0.026) | −0.001 (0.013) |
| Local youth unemployment rate | 0.000 (0.007) | −0.020 (0.004) |
| Activity year prior to work impairment | ||
| In education | −0.231 (0.022) | 0.133 (0.012) |
| Employed | −0.232 (0.027) | 0.428 (0.014) |
| Year dummies (2002 reference) | ||
| Year 2003 | 0.081 (0.076) | −0.114 (0.040) |
| Year 2004 | 0.130 (0.074) | 0.001 (0.038) |
| Year 2005 | 0.159 (0.072) | 0.166 (0.037) |
| Year 2006 | 0.050 (0.071) | 0.244 (0.037) |
| Year 2007 | −0.150 (0.074) | 0.270 (0.038) |
| Year 2008 | −0.611 (0.077) | 0.038 (0.038) |
| Year 2009 | −0.861 (0.077) | −0.109 (0.037) |
| Year 2010 | −0.585 (0.073) | −0.596 (0.038) |
| Year 2011 | −0.325 (0.073) | −0.384 (0.038) |
| Year 2012 | −0.480 (0.074) | −0.379 (0.039) |
| Year 2013 | −0.559 (0.077) | −0.347 (0.041) |
| Year 2014 | −0.046 (0.079) | −0.331 (0.045) |
| Age (21–24 reference) | ||
| Age 18–20 years | 0.152 (0.027) | 0.035 (0.016) |
| Age 25–29 years | 0.006 (0.024) | −0.178 (0.013) |
| Duration of work-impairment spell (1–2 months reference) | ||
| 3–4 months | −0.008 (0.038) | 0.077 (0.019) |
| 5–6 months | −0.034 (0.041) | 0.045 (0.020) |
| 7–10 months | −0.065 (0.037) | 0.006 (0.019) |
| 11–14 months | −0.065 (0.039) | −0.006 (0.021) |
| 15–18 months | −0.043 (0.042) | −0.093 (0.023) |
| 19–24 months | 0.032 (0.041) | −0.070 (0.023) |
| 25–30 months | 0.118 (0.044) | −0.033 (0.025) |
| 31–36 months | 0.206 (0.048) | −0.020 (0.028) |
| 37–48 months | 0.567 (0.044) | 0.171 (0.027) |
| 49+ months | 1.138 (0.048) | 0.300 (0.032) |
| Quarter (first quarter reference) | ||
| Quarter 2 | −0.024 (0.025) | 0.124 (0.013) |
| Quarter 3 | 0.107 (0.024) | 0.415 (0.012) |
| Quarter 4 | 0.040 (0.025) | −0.031 (0.014) |
| Region of residence (Eastern Norway reference) | ||
| Southern Norway | 0.042 (0.035) | −0.048 (0.020) |
| Western Norway | 0.062 (0.024) | −0.025 (0.013) |
| Middle Norway | −0.017 (0.033) | −0.051 (0.018) |
| Northern Norway | −0.114 (0.033) | 0.023 (0.017) |