
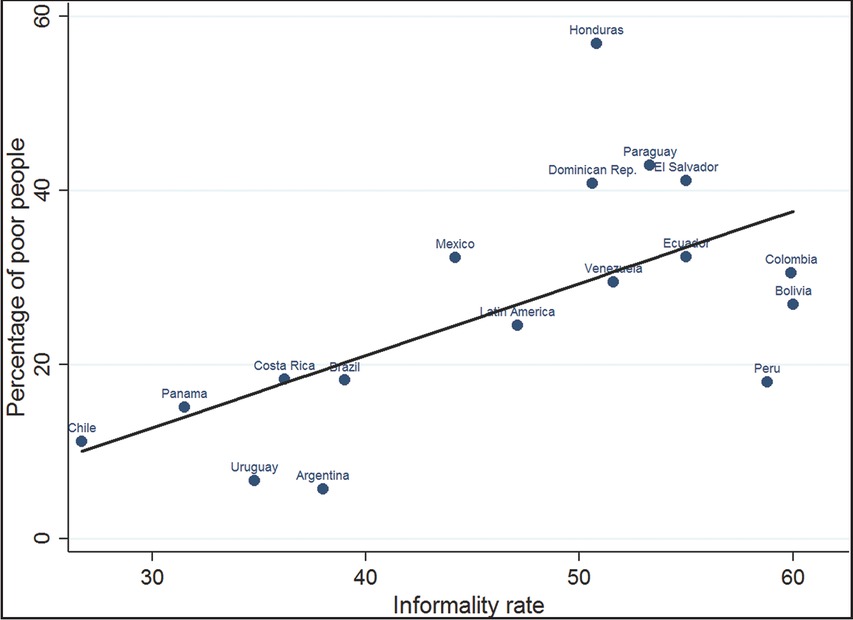
Figure 1
Poverty and informality in Latin American countries.
Source: Data from the Economic Commission for Latin America and the Caribbean (2014b).
Notes: 1. The y-axis is analyzed based on monetary poverty in urban areas. 2. The informality rate is the percentage of workers who are working in the informal sector.
Table 1
Informal employment and employment in the informal sector in Colombia, 2013
| Employment in the informal Sector: 57.5 | Occupational position | |||||||
|---|---|---|---|---|---|---|---|---|
| Informal employment: 59.6 | Own account workers | Employers | Unpaid workers | Wage-earning workers | ||||
| Formal | Informal | Formal | Informal | |||||
| 1 | 2 | 3 | 4 | 5 | 6 | |||
| Economic Establishment | Formal sector (establishment with more than 5 employees) | A | 4.4 (719640) | 1.5 (243867) | 0.2 (28405) | 30.8 (5015828) | 5.4 (891832) | |
| Informal sector (establishment with 5 or fewer employees) | B | 36.3 (5913077) | 3.2 (524612) | 0.5 (78009) | 2.7 (448819) | 2.1 (348184) | 8.1 (1327603) | |
| Households hiring domestic workers | C | 0.9 (155388) | 3.7 (602247) | |||||
[i] Source: Integrated Household Survey. National Administrative Department of Statistics (NADS, 2014).
Notes: 1. The figures are the percentages of the total urban workers. In brackets are the absolute numbers. 2. Weights are considered in the estimations. 3. Employment in the informal sector: B1+B2+ B3+B4+B5+B6+C5+C6; informal employment: A4+A6+B1+B2+B4+B6+C6.
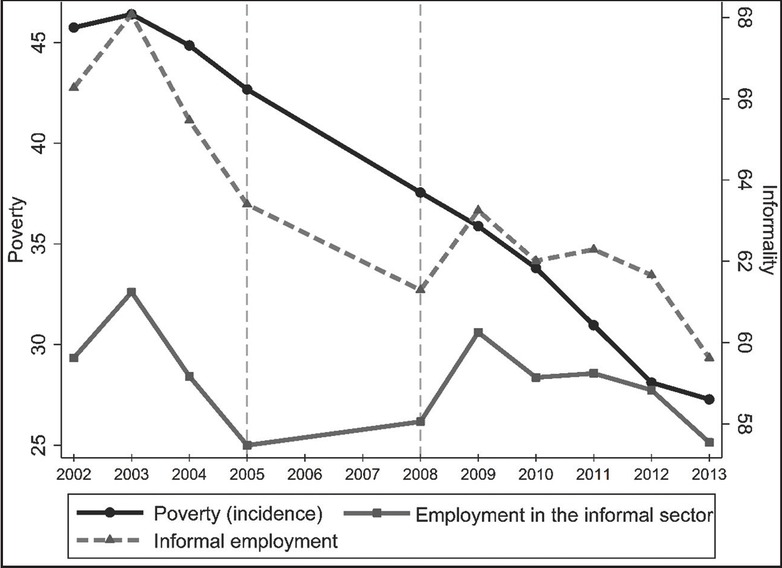
Figure 2
Poverty and informality in Colombia during the period 2002–2013.
Source: Integrated Household Survey (NADS, 2014).
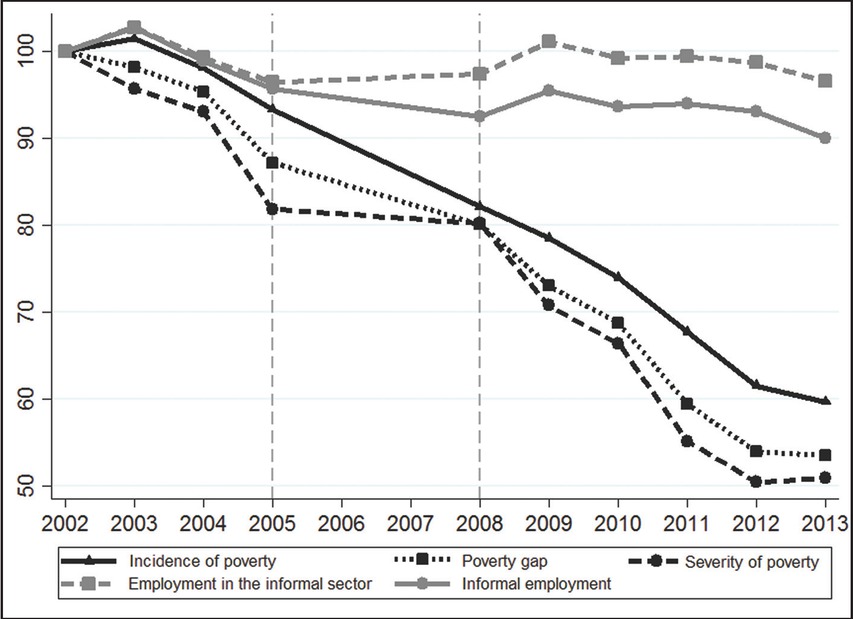
Figure 3
Changes in poverty indicators and informality rate in Colombia during 2002–2013.
Source: Integrated Household Survey (NADS, 2014).
Notes: Index for every indicator. 2002=100.
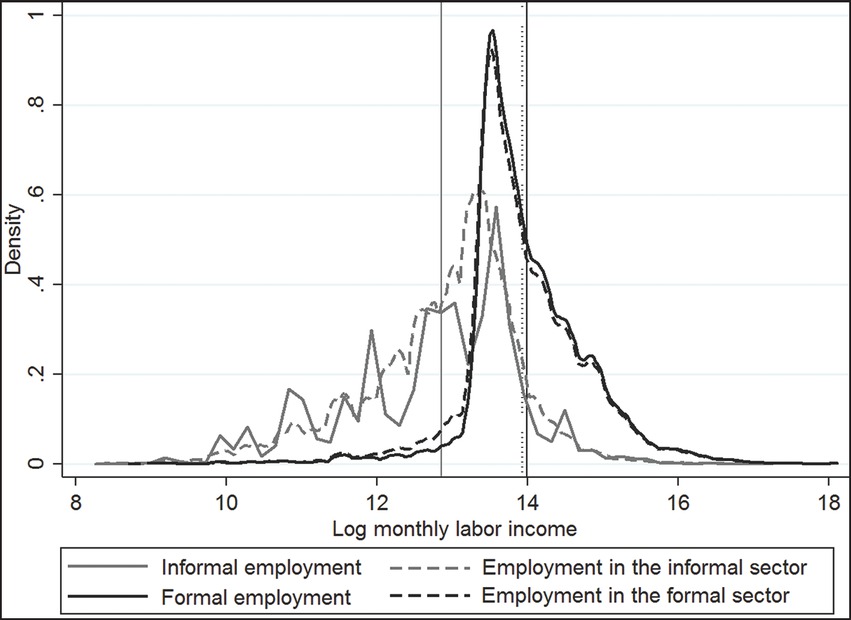
Figure 4
Distribution of log monthly labor income by informality.
Source: Integrated Household Survey (NADS, 2014).
Notes: 1. The graphs illustrate density functions estimated by kernel methodology.
2. The estimated kernel is the Epanechnikov kernel with optimal bandwidth.
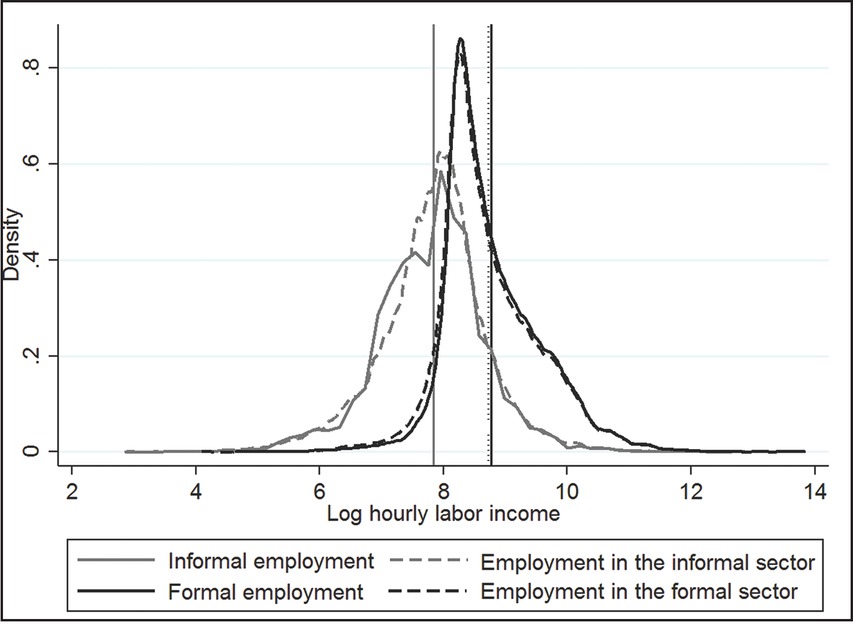
Figure 5
Distribution of log hourly labor income by informality.
Source: Integrated Household Survey. (NADS, 2014).
Notes: 1. The graphs illustrate density functions estimated by kernel methodology.
2. The estimated kernel is the Epanechnikov kernel with optimal bandwidth.
Table 2
Average earnings by occupational position and informality
| Category | Average monthly labor income1 | % total average | Average hourly labor income | % total average |
|---|---|---|---|---|
| Own-account workers in the informal sector | 508,250 | 54 | 3,450 | 61 |
| Own-account workers in the formal sector | 1,834,812 | 194 | 12,427 | 221 |
| Employers in the informal sector | 1,355,576 | 143 | 7,109 | 126 |
| Employers in the formal sector | 3,492,591 | 369 | 20,162 | 358 |
| Formal employees in the formal sector | 1,638,424 | 173 | 9,020 | 160 |
| Informal employees in the formal sector | 691,276 | 73 | 4,098 | 73 |
| Formal employees in the informal sector | 909,387 | 96 | 4,677 | 83 |
| Informal employees in the informal sector | 507,253 | 54 | 3,269 | 58 |
| Total average | 947,549 | 100 | 5,633 | 100 |
Table 3
Average individual earnings gaps by informality type in Colombia, 2002–2013
| Informality | Labor income | 2002 | 2005 | 2008 | 2013 |
|---|---|---|---|---|---|
| Informal sector | Monthly income | 35.7 | 32.8 | 40.5 | 42.3 |
| Hourly income | 30.4 | 28.6 | 36.6 | 37.6 | |
| Informal employment | Monthly income | 40.9 | 38.9 | 44.0 | 43.6 |
| Hourly income | 36.2 | 34.2 | 39.8 | 39.1 | |
[i] Source: Integrated Household Survey (NADS, 2014).
Notes: 1. The figures show the average increase in informal workers’ earnings if they were paid as formal workers, taking the average income of the latter as the reference. 2. The number is the result of the logarithmic transformations in the income equations.
Table 4
Workers by informality type and poverty
| Type of informality | Formal/informal | Poor | Not poor | Total |
|---|---|---|---|---|
| Informal sector | Employment in the informal sector | 15.8 | 41.7 | 57.5 |
| Employment in the formal sector | 2.5 | 40.0 | 42.5 | |
| Total | 18.3 | 81.7 | 100.0 | |
| Informal employment | Informal employment | 16.5 | 43.1 | 59.6 |
| Formal employment | 1.8 | 38.6 | 40.4 | |
| Total | 18.3 | 81.7 | 100.0 | |
Table 5
Formalization effect on poverty indicators in Colombia, 2013
| Informality | Income | Change in indicators | Head count ratio | Gap | Severity |
|---|---|---|---|---|---|
| Informal sector | Monthly | Change in indicator | −11.2 | −4.8 | −2.6 |
| income | Change in percentage | −40.0% | −47.1% | −49.0% | |
| Hourly | Change in indicator | −10.1 | −4.4 | −2.4 | |
| income | Change in percentage | −33.7% | −37.0% | −35.2% | |
| Informal employment | Monthly | Change in indicator | −12.7 | −5.3 | −2.8 |
| income | Change in percentage | −44.5% | −51.0% | −52.3% | |
| Hourly | Change in indicator | −11.6 | −4.6 | −2.4 | |
| income | Change in percentage | −41.3% | −45.9% | −46.4% | |
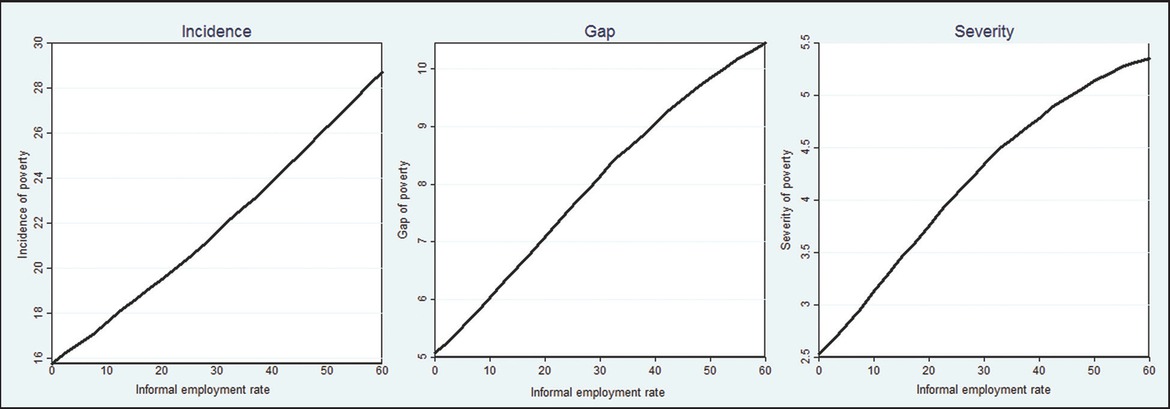
Figure 6
Continuous formalization and poverty indicators in Colombia.
Source: Integrated Household Survey. (NADS, 2014).
Note: Data were estimated considering monthly income and informal employment.
Table 6
Effects of changes in informality on poverty indicators in Colombia, 2002-2013. Monthly labor income
| Period | Informality | Kind of effect | Headcount ratio | Gap | Severity | ||||
|---|---|---|---|---|---|---|---|---|---|
| Change in indicator | % total change | Change in indicator | % total change | Change in indicator | % total change | ||||
| 2002-2005 | Informal | Change explained by | Earnings gap | -0.5 | 10.8 | -0.3 | 9.9 | -0.2 | 8.7 |
| sector | informality | Informality rate | -0.5 | 12.0 | -0.3 | 9.9 | -0.2 | 9.2 | |
| Change not explained by informality | -3.3 | 77.2 | -2.3 | 80.1 | -1.7 | 82.1 | |||
| Total change | -4.3 | 100.0 | -2.8 | 100.0 | -2.1 | 100.0 | |||
| Informal | Change explained by | Earnings gap | -0.5 | 11.5 | -0.2 | 8.5 | -0.2 | 7.8 | |
| employment | informality | Informality rate | -0.8 | 17.9 | -0.4 | 14.9 | -0.2 | 11.7 | |
| Change not explained by informality | -3.3 | 70.6 | -2.2 | 76.6 | -1.7 | 80.6 | |||
| Total change | -4.7 | 100.0 | -2.8 | 100.0 | -2.1 | 100.0 | |||
| 2008-2013 | Informal | Change explained by | Earnings gap | 0.4 | -4.0 | 0.2 | -3.9 | 0.1 | -3.7 |
| Sector | informality | iInformality rate | -0.1 | 1.0 | -0.1 | 1.1 | 0.0 | 1.2 | |
| Change not explained by informality | -10.6 | 103.0 | -5.5 | 102.8 | -3.3 | 102.5 | |||
| Total change | -10.3 | 100.0 | -5.3 | 100.0 | -3.2 | 100.0 | |||
| Informal | Change explained by | Earnings gap | 0.3 | -2.6 | 0.1 | -2.1 | 0.1 | -1.8 | |
| employment | informality | Informality rate | -0.3 | 2.5 | -0.1 | 2.2 | -0.1 | 2.1 | |
| Change not explained by informality | -10.1 | 100.1 | -5.3 | 99.8 | -3.3 | 99.7 | |||
| Total change | -10.1 | 100.0 | -5.3 | 100.0 | -3.3 | 100.0 | |||
[i] Source: Integrated Household Survey (NADS, 2014).
Note: Bold entries specify the effect of changes in informality on poverty indicators.