
Table 1
US census employment since 1950
| Month | 1950 | 1960 | 1970 | 1990 | 2000 | 2010 |
|---|---|---|---|---|---|---|
| January | 2,161 | 0 | 524 | 4,000 | 32,000 | 24,000 |
| February | 2,949 | 39 | 7,549 | 15,000 | 59,000 | 39,000 |
| March | 11,382 | 10,792 | 20,042 | 68,000 | 154,000 | 87,000 |
| April | 143,789 | 177,706 | 160,585 | 153,000 | 181,000 | 154,000 |
| May | 65,716 | 66,490 | 130,669 | 335,000 | 530,000 | 564,000 |
| June | 12,967 | 18,529 | 65,353 | 251,000 | 305,000 | 339,000 |
| July | 8,015 | 11,511 | 24,316 | 179,000 | 232,000 | 196,000 |
| August | 8,336 | 10,887 | 11,662 | 81,000 | 146,000 | 82,000 |
| September | 8,662 | 10,297 | 8,347 | 44,000 | 24,000 | 6,000 |
| October | 8,931 | 9,905 | 6,517 | 27,000 | 11,000 | 1,000 |
| November | 9,240 | 9,578 | 5,088 | 19,000 | 6,000 | 0 |
| December | 9,446 | 9,089 | 3,973 | 13,000 | 1,000 | 0 |
Table 2
Discrepancies in 1960 data
| Month | Constructed change in Census employment | Change in CES Federal employment |
|---|---|---|
| February 1960 | 39 | 1,000 |
| March 1960 | 10,753 | 189,000 |
| April 1960 | 166,914 | -12,000 |
| May 1960 | -111,216 | -124,000 |
| June 1960 | -47,960 | -34,000 |
| July 1960 | -7,018 | -7,000 |
Table 3
Historic census employment, Canada
| Month | Census commissioners | Crew leaders | Enumerators | Other positions | All |
|---|---|---|---|---|---|
| 1871 | 206 | 2,789 | |||
| 205 | 3,183 | ||||
| 241 | 4,324 | ||||
| 351 | 8,800 | ||||
| 264 | 9,703 | ||||
| 241 | 11,425 | ||||
| 254 | 13,886 | ||||
| 15,308 | |||||
| 16,850 | |||||
| 263 | 526 | 15,011 | |||
| 1,300 | 30,000 | ||||
| 35,000 | |||||
| 41,208 | |||||
| No data | |||||
| No data | |||||
| 44,042 | No data | ||||
| 38,000 | |||||
| 38,000 | |||||
| 1,800 | 20,000 | ||||
| 5,000 | 30,000 | ||||
| 4,000 | 25,000 | 6,000 |
Table 4
Canada census employment, monthly
| Month | 2006 | 2011 | 2016 |
|---|---|---|---|
| January | 10 | 245 | |
| February | 158 | 517 | |
| March | 262 | 1,566 | |
| April | 14,391 | 1,637 | 15,017 |
| May | 21,230 | 15,142 | 32,715 |
| June | 20,058 | 30,707 | 30,850 |
| July | 13,853 | 28,513 | 20,507 |
| August | 5,469 | 21,529 | 2,353 |
| September | 555 | 772 | 74 |
| October | 12 | 11 | |
| November | 17 | ||
| December | 4 |
Table 5
Korea census hiring and reassignment
| Year | Temporary employment | Reassignment of public servants |
|---|---|---|
| 1990 | 116,000 | 55,000 |
| 1995 | 126,000 | 57,000 |
| 2000 | 190,000 | 16,000 |
| 2005 | 110,000 | 5,000 |
| 2010 | 113,000 | 6,000 |
| 2015 | 44,000 | 6,228 |
Table 6
England and Wales Census employment
| Year | Senior managers | Middle managers | Assistants | Enumerators |
|---|---|---|---|---|
| 1841 | 35,000 | |||
| 1851 | 624 | 2,190 | 30,610 | |
| 1861 | 634 | 2,194 | 30,329 | |
| 1871 | 626 | 2,195 | 32,543 | |
| 1881 | 630 | 2,175 | 34,711 | |
| 1891 | 631 | 2,122 | 35,507 | |
| 1901 | 635 | 2,064 | 38,200 | |
| 1911 | 634 | 2,035 | 35,000 | |
| 1921 | 637 | 1,913 | 38,563 | |
| 1931 | 1,770 | 40,016 | ||
| 1951 | 1,225 | 49,318 | ||
| 1961 | 115 | 1,315 | 69,000 | |
| 1971 | 100 | 1,997 | 6,127 | 96,741 |
| 1981 | 110 | 2,103 | 6,296 | 103,166 |
| 1991 | 135 | 2,539 | 7,724 | 117,696 |
| 2001 | 103 | 2,000 | 6,000 | 62,500 |
| 2011 | 157 | 2,194 | 31,436 | |
| 2021 (anticipated) | 17,000 |
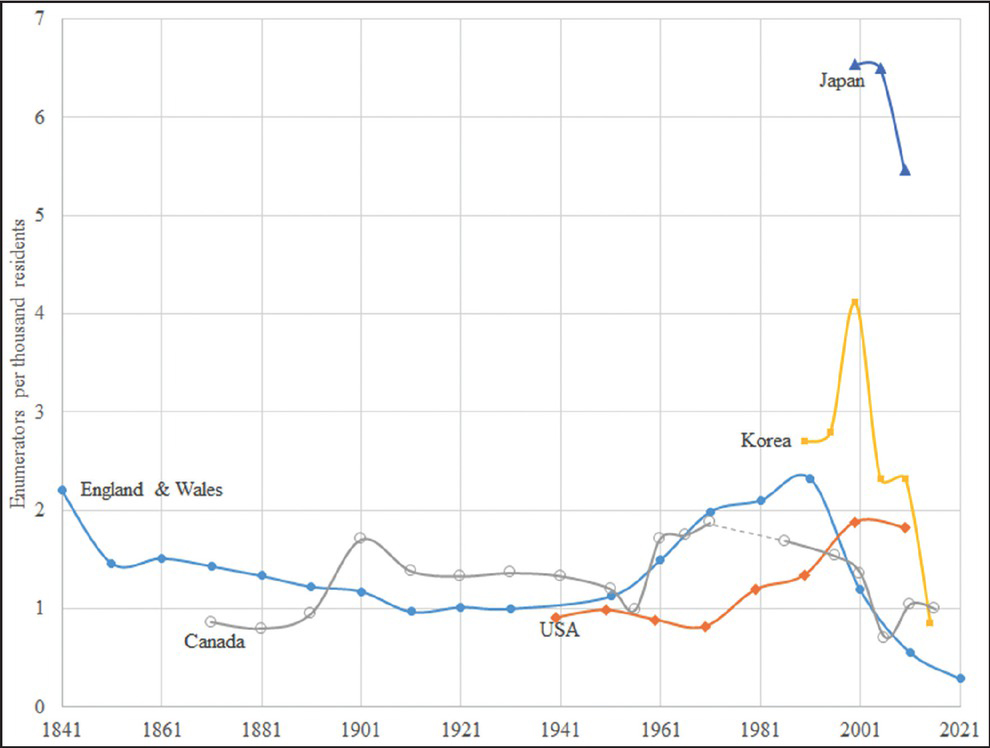
Figure 1
Employment intensity. See Appendix A for sources.
Table 7
Total employment and census employment
| Dependent variable | dEMPLOY | ||
|---|---|---|---|
| Regression | cOLS1 | cOLS3 | cOLS4 |
| US 1948–1972 | Yes | Yes | |
| US 1990–2012 | Yes | Yes | Yes |
| Canada | Yes | ||
| Observations | 239 | 208 | 88 |
| dCENSUS | 0.96 (0.42) | 1.04 (0.46) | 0.82 (0.23) |
| R2 | 0.02 | 0.02 | 0.05 |
| F-statistic | 5.3 | 5.2 | 12.4 |
Table 8
Biased OLS estimates
| Dependent variable: | dEMPLOY | |||||
|---|---|---|---|---|---|---|
| Regression | bOLS1 | bOLS2 | bOLS3 | bOLS4 | bOLS5 | bOLS6 |
| US 1948–1972 | Yes | Yes | Yes | |||
| US 1990–2012 | Yes | Yes | Yes | Yes | ||
| Canada | Yes | Yes | Yes | |||
| Korea | Yes | Yes | Yes | |||
| Observations | 271 | 1322 | 208 | 88 | 51 | 12 |
| dGOV | 0.94 (0.55) | 0.95 (0.34) | 1.61 (0.59) | 0.77 (0.24) | 0.09 (0.26) | 0.69 (0.77) |
| Non-census years | Yes | |||||
| Controls | Yes | |||||
| R2 | 0.05 | 0.08 | 0.08 | 0.05 | 0.00 | 0.09 |
| F-statistic | 3.0 | . | 7.5 | 11.0 | 0.1 | 0.8 |
Table 9
Main GMM results
| Dependent variable: dEMPLOY | ||||||
|---|---|---|---|---|---|---|
| Regression | GMM1 | GMM2 | GMM3 | GMM4 | GMM5 | GMM6 |
| US 1948–1972 | Yes | Yes | Yes | |||
| US 1990–2012 | Yes | Yes | Yes | Yes | ||
| Canada | Yes | Yes | Yes | |||
| Korea | Yes | Yes | Yes | |||
| Observations | 271 | 1,322 | 208 | 88 | 51 | 12 |
| dGOV | 0.72 (0.66) | 0.68 (0.44) | 1.48 (1.11) | 0.80 (0.35) | 0.38 (0.70) | -0.01 (0.53) |
| Controls | Yes | |||||
| Non-census years | Yes | |||||
Table 10
First-stage instrumental results
| Dependant variable: dGOV | ||||||
|---|---|---|---|---|---|---|
| Regression | IV1, first | IV2, first | IV3, first | IV4, first | IV5, first | IV6, first |
| US 1948–1972 | Yes | Yes | Yes | |||
| US 1990–2012 | Yes | Yes | Yes | Yes | ||
| Canada | Yes | Yes | Yes | |||
| Korea | Yes | Yes | Yes | |||
| Observations | 271 | 1322 | 208 | 95 | 51 | 12 |
| dCENSUS | 0.69 (0.01) | 0.71 (0.00) | 0.7 (0.17) | 1 (0.02) | 0.63 (0.12) | |
| Canadian Census April | 0.0006 | 0.0007 | 0.0006 | |||
| (0.0000) | (0.0000) | (0.0005) | ||||
| Canadian Census May | 0.0016 | 0.0017 | 0.0017 | |||
| (0.0000) | (0.0000) | (0.0006) | ||||
| Canadian Census June | -0.0022 | -0.0021 | -0.0021 | |||
| (0.0000) | (0.0000) | (0.0005) | ||||
| Korean Census October | 0.0002 | 0.0004 | -0.0002 | |||
| (0.0000) | (0.0000) | (0.0008) | ||||
| Korean Census November | 0.0026 | 0.0027 | 0.0022 | |||
| (0.0000) | (0.0000) | (0.0008) | ||||
| Korean Census December | -0.0016 | -0.0010 | -0.0020 | |||
| (0.0000) | (0.0000) | (0.0008) | ||||
| Korean Census January | -0.0011 | -0.0006 | -0.0014 | |||
| (0.0000) | (0.0000) | (0.0017) | ||||
| Non-census years | Yes | |||||
| Controls | Yes | |||||
| R2 | 0.51 | 0.26 | 0.35 | 0.98 | 0.61 | 0.69 |
| F-statistic | 1.6E+06 | 3.9E+15 | 17.6 | 2823.4 | 12.6 | 58.2 |