
Table 1
Summary statistics
| Arizona | Other states | |
|---|---|---|
| US-born labor force participation | ||
| Low-skilled female | 0.66 | 0.68 |
| High-skilled female | 0.80 | 0.82 |
| Married women | 0.72 | 0.75 |
| Single women | 0.80 | 0.80 |
| Male | 0.77 | 0.80 |
| High-skilled male | 0.90 | 0.92 |
| US-born labor hours (hours >0) | ||
| Low-skilled female | 37.41 | 36.74 |
| High-skilled female | 38.78 | 38.19 |
| Married women | 37.56 | 36.94 |
| Single women | 39.61 | 39.05 |
| Low-skilled male | 42.12 | 43.18 |
| High-skilled male | 44.37 | 44.89 |
| Household service sector | ||
| Hourly earnings | 7.99 | 8.60 |
| % self-employed | 0.28 | 0.28 |
| % female | 0.60 | 0.68 |
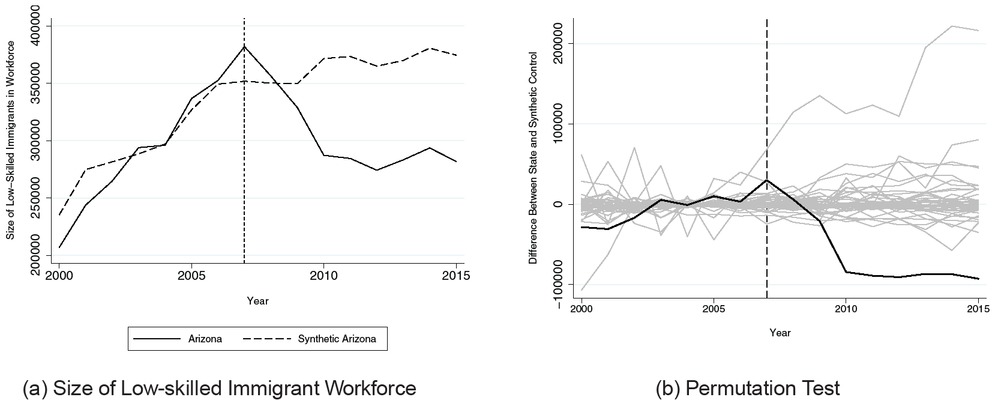
Figure 1
LAWA and size of low-skilled immigrant workforce
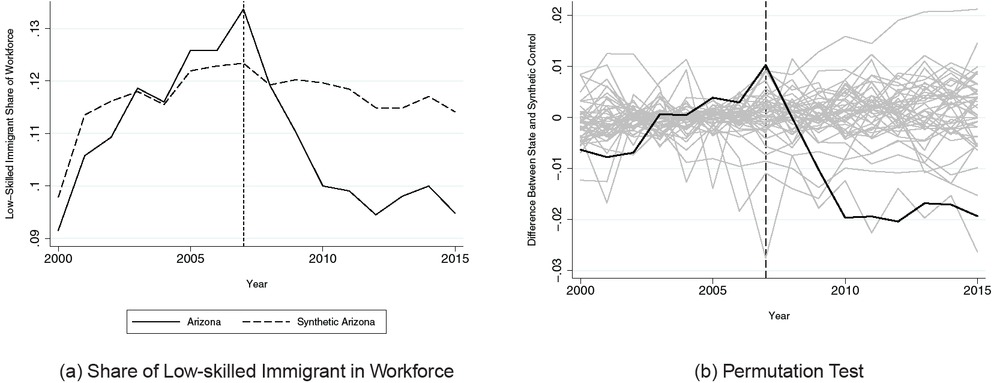
Figure 2
LAWA and share of low-skilled immigrants in workforce
Table 2
Universal E-verify and low-skilled immigrant workforce
| Average pre–post difference in the state | Average pre–post difference in the synthetic state | DD estimates | Rank, lowest to highest | P-value from one-tailed test, P (Δ ≤ Δ treat) | |
|---|---|---|---|---|---|
| A. Arizona (adoption year: 2007) | |||||
| Size of low-skilled immigrant workforce | 23,027 | 71,912 | –48,885 | 1/44 | 0.023 |
| Share of low-skilled immigrant in the workforce | –0.008 | 0.003 | –0.011 | 2/44 | 0.045 |
| B. Alabama (adoption year: 2011) | |||||
| Size of low-skilled immigrant workforce | 12,506 | 16,339 | –3,833 | 7/44 | 0.159 |
| Share of low-skilled immigrant in the workforce | 0.006 | 0.007 | –0.002 | 8/44 | 0.182 |
| C. Georgia (adoption year: 2011) | |||||
| Size of low-skilled immigrant workforce | 39,513 | 41,080 | –1,567 | 15/44 | 0.341 |
| Share of low-skilled immigrant in the workforce | 0.005 | 0.003 | 0.002 | 26/44 | 0.591 |
| D. Mississippi (adoption year: 2008) | |||||
| Size of low-skilled immigrant workforce | 4,216 | 8,181 | –3,965 | 8/44 | 0.182 |
| Share of low-skilled immigrant in the workforce | 0.003 | 0.002 | 0.001 | 21/44 | 0.477 |
| E. North Carolina (adoption year: 2011) | |||||
| Size of low-skilled immigrant workforce | 660 | 2,320 | –1,660 | 14/44 | 0.318 |
| Share of low-skilled immigrant in the workforce | 0.001 | 0.003 | –0.003 | 5/44 | 0.114 |
| F. South Carolina (adoption year: 2011) | |||||
| Size of low-skilled immigrant workforce | 19,778 | 17,861 | 1,917 | 29/44 | 0.659 |
| Share of low-skilled immigrant in the workforce | 0.007 | 0.007 | 0.000 | 15/44 | 0.341 |
| G. Utah (adoption year: 2010) | |||||
| Size of low-skilled immigrant workforce | 18,115 | 21,022 | –2,907 | 11/44 | 0.250 |
| Share of low-skilled immigrant in the workforce | 0.007 | 0.004 | 0.003 | 30/44 | 0.682 |
[i] Notes: Estimates based on Integrated Public Use Microdata Series (IPUMS) 5% 2000 Census and 2001–2015 ACS. The donor pool size is represented by the denominator of the rank. The one-tailed test of the significance of the difference-in-difference estimates uses the empirical distribution of the placebo effect estimates of universal E-Verify policy for states in the donor pool. The information on states adoption year of universal E-Verify program is from Orrenius and Zavodny (2015). DD, difference in differences; ACS, American Community Survey.
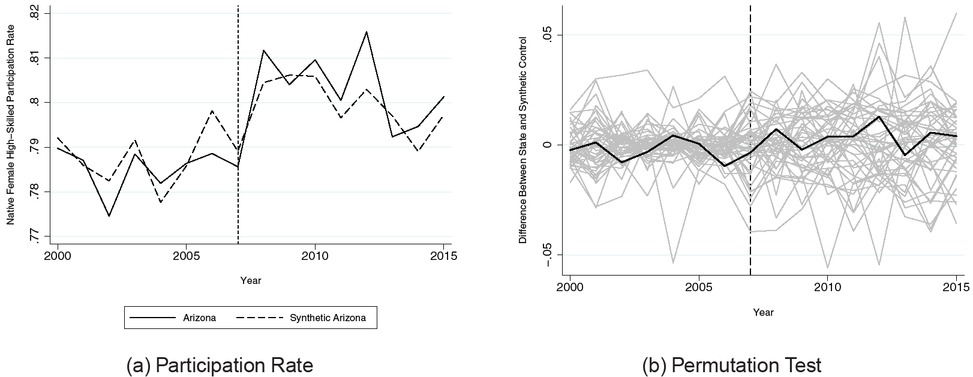
Figure 3
Native high-skilled female participation rate
Table 3
LAWA and native labor supply
| Average pre– post difference in Arizona | Average pre–post difference in synthetic Arizona | DD estimates | Rank, lowest to highest | P-value from one-tailed test, P (△ ≤ △ AZ) | |
|---|---|---|---|---|---|
| A. Native female participation rate | |||||
| High skilled | 0.016 | 0.011 | 0.005 | 31/45 | 0.689 |
| Low skilled | −0.031 | −0.020 | −0.011 | 9/45 | 0.200 |
| Married | 0.017 | 0.009 | 0.008 | 36/45 | 0.800 |
| B. Native female hours per week | |||||
| High skilled | −0.496 | −0.244 | −0.252 | 8/45 | 0.178 |
| Low skilled | −0.983 | −0.712 | −0.271 | 15/45 | 0.333 |
| Married | −0.148 | 0.070 | −0.217 | 13/45 | 0.289 |
| Wage per hour | |||||
| percentile | |||||
| −100 | −0.317 | 0.106 | −0.423 | 7/45 | 0.156 |
| −75 | −0.319 | −0.170 | −0.149 | 16/45 | 0.356 |
| −50 | −0.505 | −0.395 | −0.110 | 15/45 | 0.333 |
| −25 | −1.168 | −1.017 | −0.151 | 18/45 | 0.400 |
| C. Native male participation rate | |||||
| High skilled | −0.018 | −0.008 | −0.010 | 5/45 | 0.111 |
| Low skilled | −0.069 | −0.046 | −0.023 | 6/45 | 0.133 |
| D. Native male hours per week | |||||
| High skilled | −1.314 | −1.083 | −0.230 | 14/45 | 0.311 |
| Low skilled | −2.157 | −1.377 | −0.779 | 5/45 | 0.111 |
[i] Notes: Estimates based on IPUMS 5% 2000 Census and 2001–2015 ACS. The donor pool size is represented by the denominator of the rank. The one-tailed test of the significance of the difference-in-difference estimates use the empirical distribution of the placebo effect estimates of LAWA for states in the donor pool. The pretreatment period is 2000–2006, while the posttreatment period is 2007–2015. Low-skilled female are defined as those with at most high school diploma. High-skilled female are defined as those with college education. LAWA, Legal Arizona Workers Act; DD, difference in differences; ACS, American Community Survey.
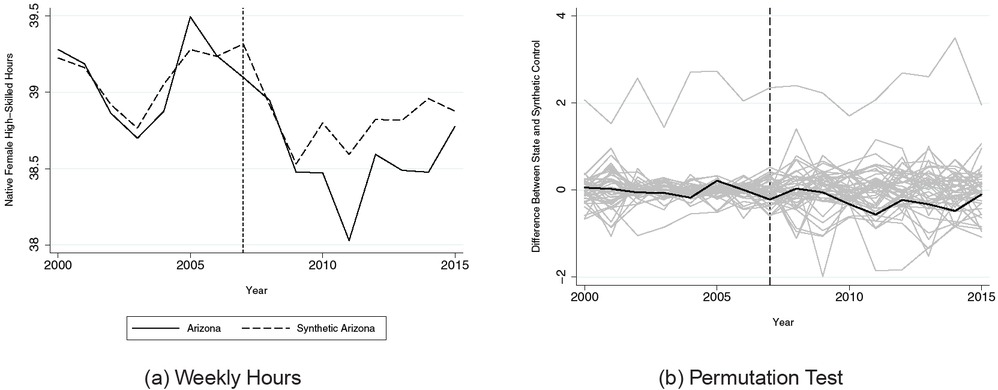
Figure 4
Native high-skilled female weekly hours (hours > 0)
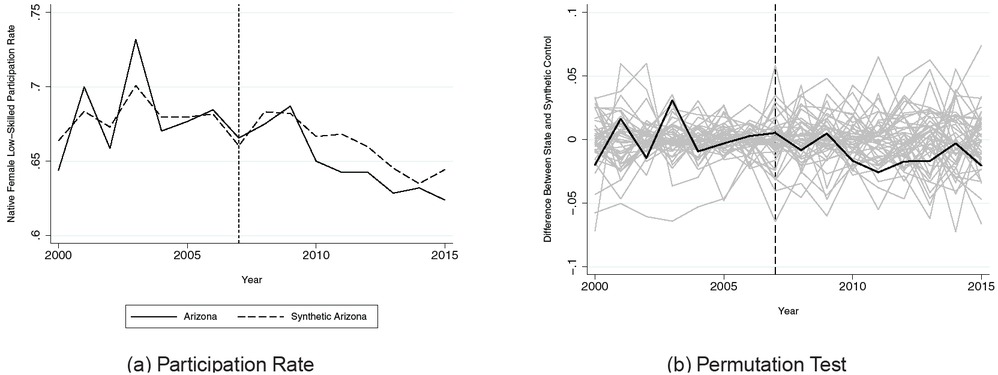
Figure 5
Native low-skilled female participation rate
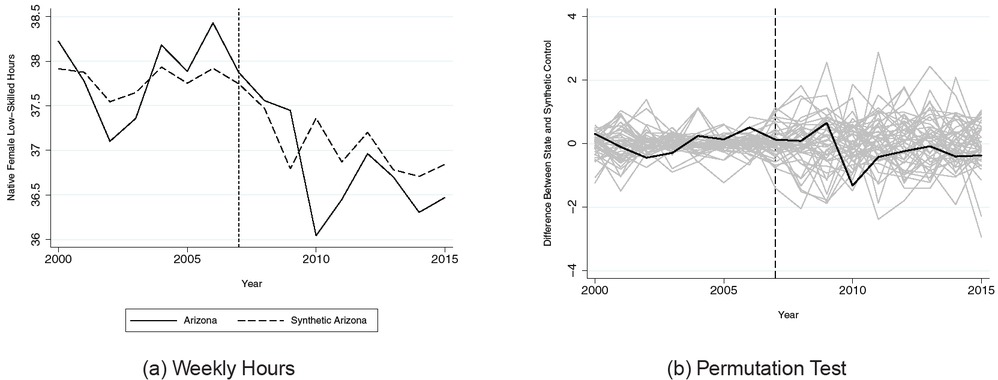
Figure 6
Native low-skilled female weekly hours (hours > 0)
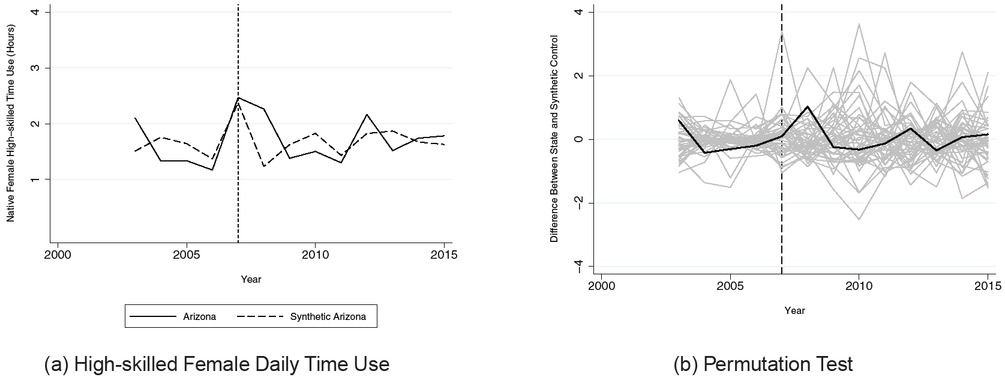
Figure 7
Native high-skilled female daily time spent on housework, gardening, and caring for children
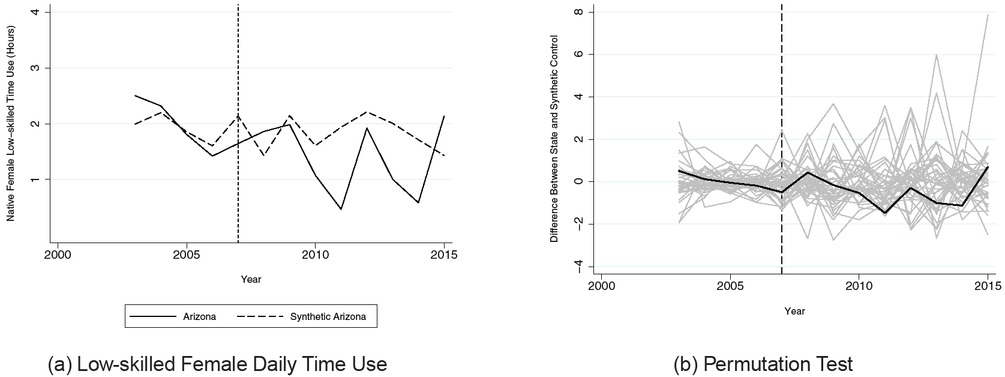
Figure 8
Native low-skilled female daily time spent on housework, gardening, and caring for children
Table 4
LAWA and native daily time spent on housework, gardening, and caring for children (hours)
| Avgerage pre–post difference in Arizona | Average pre– post difference in synthetic Arizona | DD Estimates | Rank, highest to lowest | P-value from one-tailed test, P (△ ≥ △ AZ) | |
|---|---|---|---|---|---|
| Female | |||||
| High skilled | 0.306 | 0.151 | 0.155 | 11/45 | 0.244 |
| Low skilled | −0.604 | −0.067 | −0.537 | 35/38 | 0.921 |
| Male | |||||
| High skilled | 0.215 | 0.096 | 0.119 | 13/43 | 0.302 |
| Low skilled | −0.323 | 0.156 | −0.479 | 34/37 | 0.919 |
[i] Notes: Estimates based on American Time Use Survey 2003–2015. The donor pool size is represented by the denominator of the rank. The one-tailed test of the significance of the difference-in-difference estimates uses the empirical distribution of the placebo effect estimates of LAWA for states in the donor pool. The pretreatment period is 2003–2006, while the posttreatment period is 2007–2015. Low-skilled females are defined as those with at most high school diploma. High-skilled females are defined as those with college education. LAWA, Legal Arizona Workers Act; DD, difference in differences.
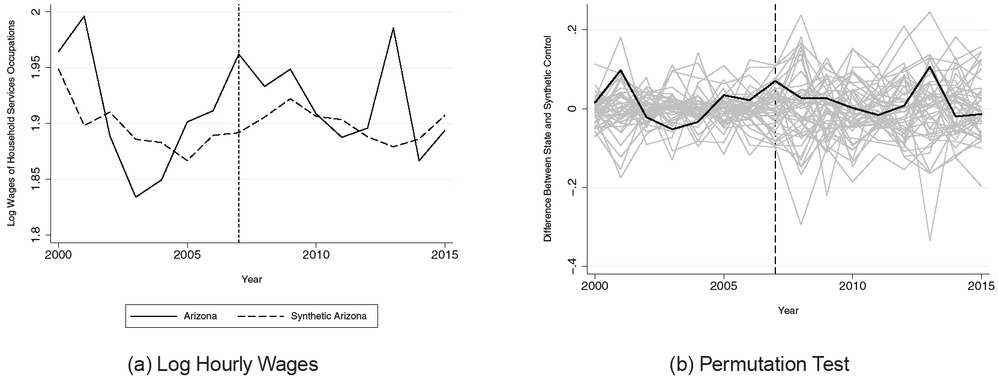
Figure 9
Wages in household service occupations (housekeepers, gardeners, and childcare workers)
Table 5
LAWA and household service occupations’ wages/supply
| Average pre–post difference in Arizona | Average pre– post difference in synthetic Arizona | DD estimates | Rank | P-value from one-tailed test | |
|---|---|---|---|---|---|
| A. Price of Household services | |||||
| Log hourly wages | 0.014 | 0.001 | 0.012 | 18/45 (highest | 0.400 |
| to lowest) | |||||
| B. Household service occupations’ supply | |||||
| Overall immigrant | 10,087 | 19,811 | -9,724 | 1/44 (lowest | 0.023 |
| supply | to highest) | ||||
| Male immigrant | 5,197 | 12,581 | -7,383 | 1/44 (lowest | 0.023 |
| to highest) | |||||
| Female immigrant | 4,890 | 9,090 | -4,200 | 1/44 (lowest | 0.023 |
| to highest) | |||||
| Overall native | 12,391 | 4,755 | 7,636 | 1/45 (highest | 0.022 |
| supply | to lowest) | ||||
| Native male | 8,980 | 2,247 | 6,732 | 1/45 (highest | 0.022 |
| to lowest) | |||||
| Native female | 3,412 | 754 | 2,658 | 6/45 (highest | 0.133 |
| to lowest) | |||||
| Overall | 22,478 | 22,174 | 304 | 27/45 (lowest | 0.600 |
| (immigrant + | to highest) | ||||
| native) supply | |||||
[i] Notes: Estimates based on Integrated Public Use Microdata Series (IPUMS) 5% 2000 Census and 2001–2015 ACS. The donor pool size is represented by the denominator of the rank. The one-tailed test of the significance of the difference-in-difference estimates uses the empirical distribution of the placebo effect estimates of LAWA for states in the donor pool. The pretreatment period is 2000–2006, while the posttreatment period is 2007–2015. LAWA, Legal Arizona Workers Act; DD, difference in differences; ACS, American Community Survey.
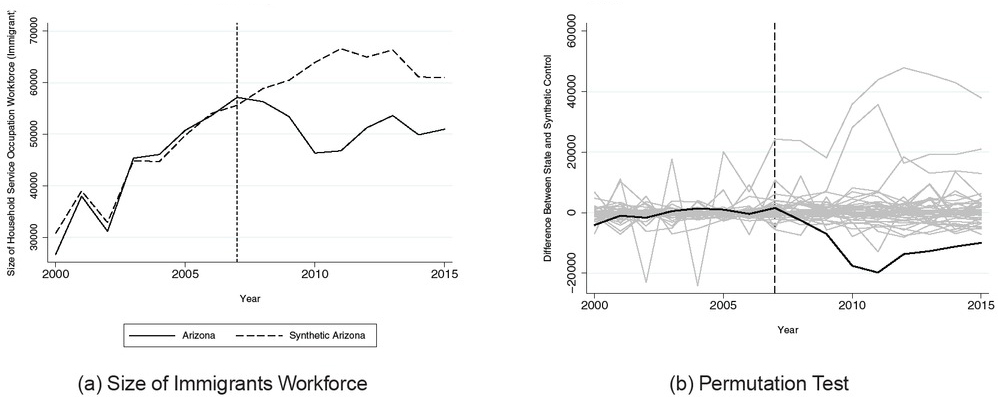
Figure 10
Size of immigrant workforce in household service occupations
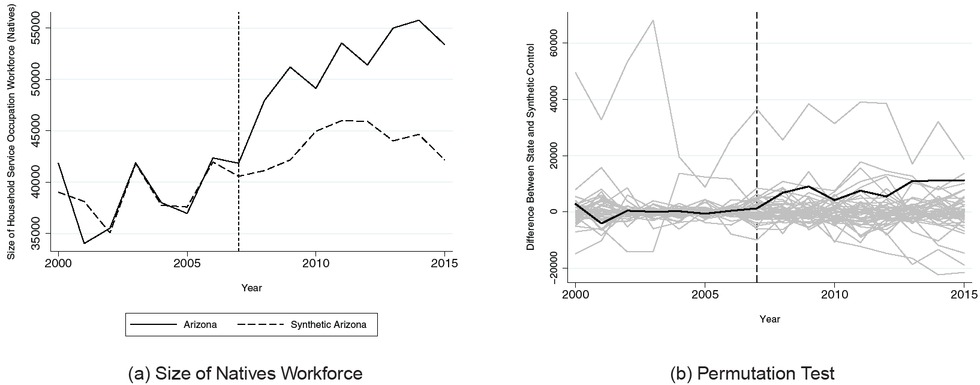
Figure 11
Size of native workforce in household service occupations
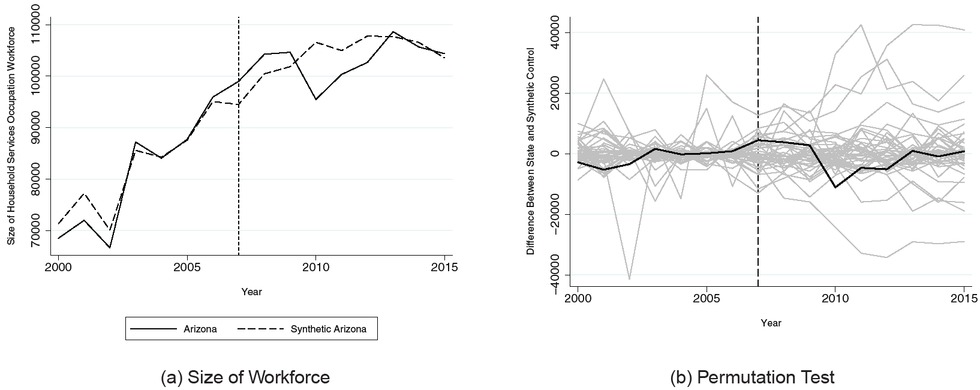
Figure 12
Size of household service occupations workforce
Table 6
LAWA and occupation income score
| Average pre–post difference in Arizona | Average pre– post difference in synthetic Arizona | DD estimates | Rank | P-value from one-tailed test | |
|---|---|---|---|---|---|
| A. Occupational income score | |||||
| Low-skilled | -0.844 | -0.474 | -0.369 | 3/45 (lowest | 0.067 |
| native male | to highest) | ||||
| Low-skilled | -0.426 | -0.525 | 0.099 | 27/45 (lowest | 0.600 |
| native female | to highest) | ||||
| B. Employment rate | |||||
| Low-skilled | -0.101 | -0.066 | -0.035 | 42/45 (highest | 0.933 |
| native male | to lowest) | ||||
| Low-skilled | -0.050 | -0.027 | -0.023 | 42/45 (highest | 0.933 |
| native female | to lowest) | ||||
[i] Notes: Estimates based on Integrated Public Use Microdata Series (IPUMS) 5% 2000 Census and 2001–2015 ACS. The donor pool size is represented by the denominator of the rank. The one-tailed test of the significance of the difference-in-difference estimates uses the empirical distribution of the placebo effect estimates of LAWA for states in the donor pool. The pretreatment period is 2000–2006, while the posttreatment period is 2007–2015. LAWA, Legal Arizona Workers Act; DD, difference in differences; ACS, American Community Survey.
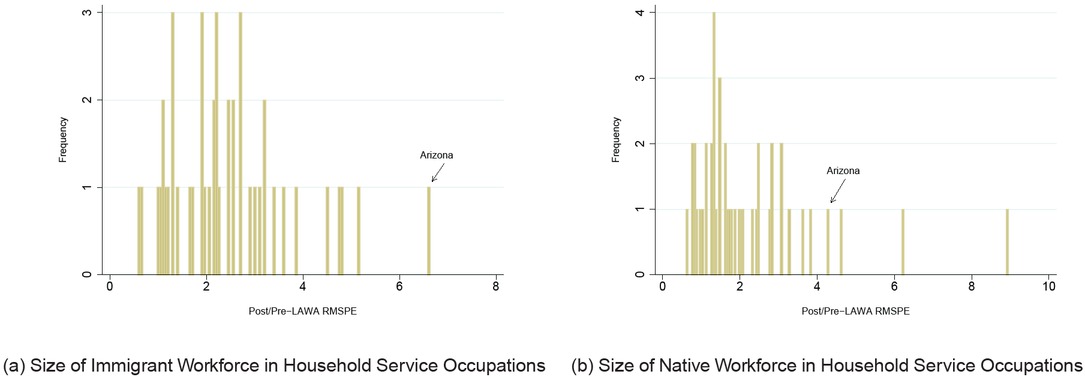
Figure 13
Robustness check: taking into account pre-treatment match quality
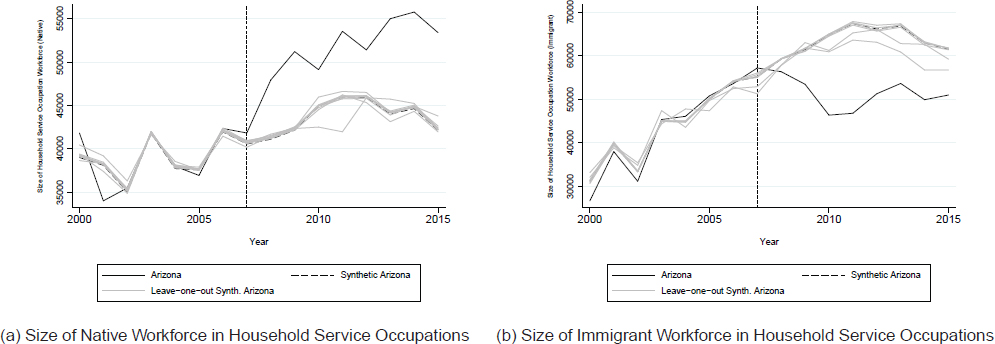
Figure 14
Robustness check: leave-one-out test
Table 7
Sensitivity check – excluding post-2010
| Average pre–post difference in Arizona | Average pre– post difference in synthetic Arizona | DD estimates | Rank | P-value from one-tailed test | |
|---|---|---|---|---|---|
| A. Native female participation rate | |||||
| High skilled | 0.017 | 0.014 | 0.004 | 30/45 (lowest to highest) | 0.667 |
| Low skilled | -0.011 | -0.007 | -0.004 | 15/45 (lowest to highest) | 0.333 |
| B. Native female hours per week | |||||
| High skilled | -0.343 | -0.201 | -0.142 | 12/45 (lowest to highest) | 0.267 |
| Low skilled | -0.620 | -0.455 | -0.165 | 17/45 (lowest to highest) | 0.378 |
| C. Household service occupations | |||||
| Number of immigrants | 11,650 | 17,435 | -5,785 | 1/44 (lowest to highest) | 0.023 |
| Number of natives | 8,891 | 3,451 | 5,440 | 3/45 (highest to lowest) | 0.067 |
[i] Notes: Estimates based on Integrated Public Use Microdata Series (IPUMS) 5% 2000 Census and 2001–2015 ACS. The donor pool size is represented by the denominator of the rank. The one-tailed test of the significance of the difference-in-difference estimates uses the empirical distribution of the placebo effect estimates of LAWA for states in the donor pool. The pretreatment period is 2000–2006, while the posttreatment period is 2007–2010. Low-skilled females are defined as those with at most high school diploma. High-skilled females are defined as those with college education. DD, difference in differences; ACS, American Community Survey; LAWA, Legal Arizona Workers Act.
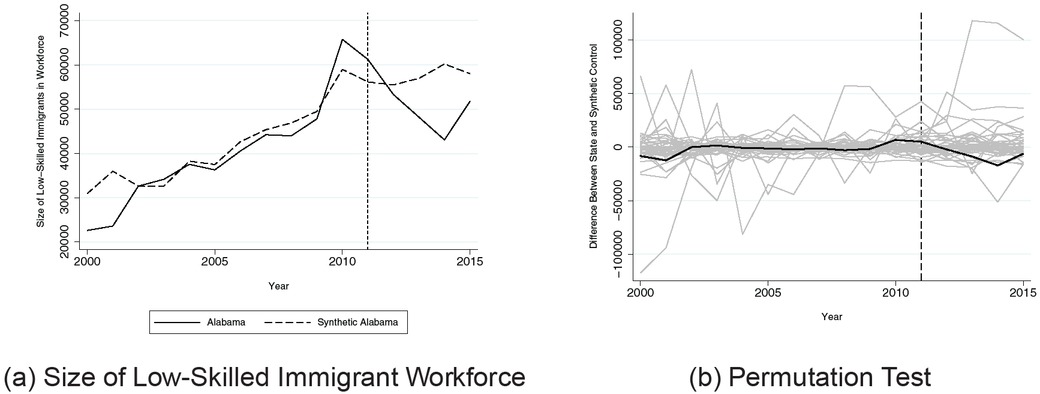
Figure A1
Alabama universal e-verify and size of low-skilled immigrant workforce
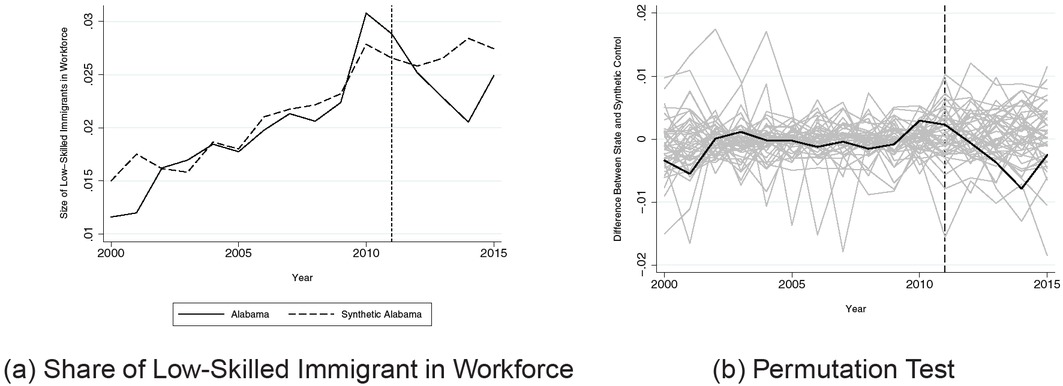
Figure A2
Alabama universal e-verify and share of low-skilled immigrants in workforce
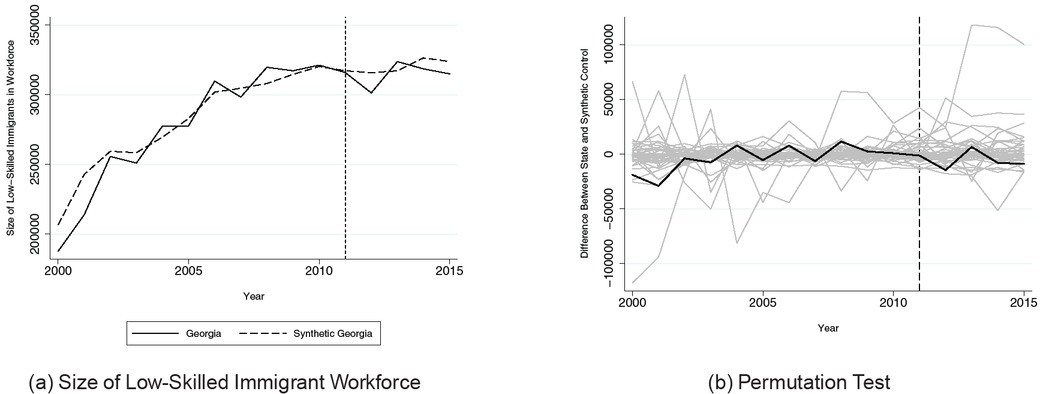
Figure A3
Georgia universal e-verify and size of low-skilled immigrant workforce
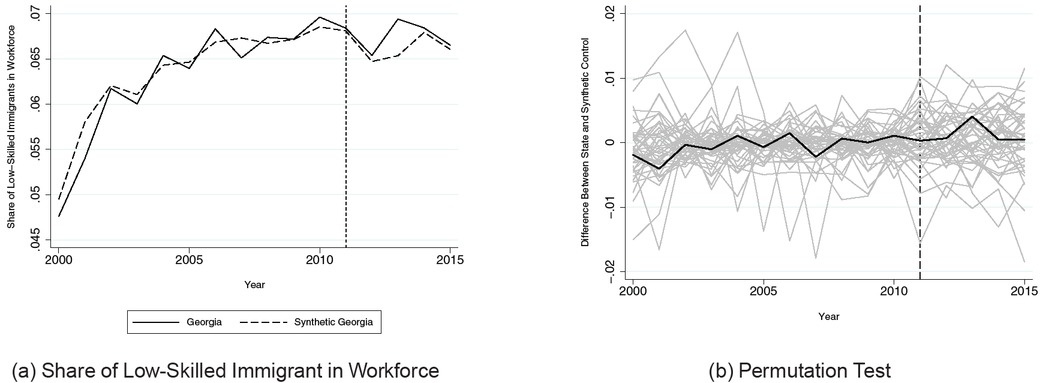
Figure A4
Georgia universal e-verify and share of low-skilled immigrants in workforce
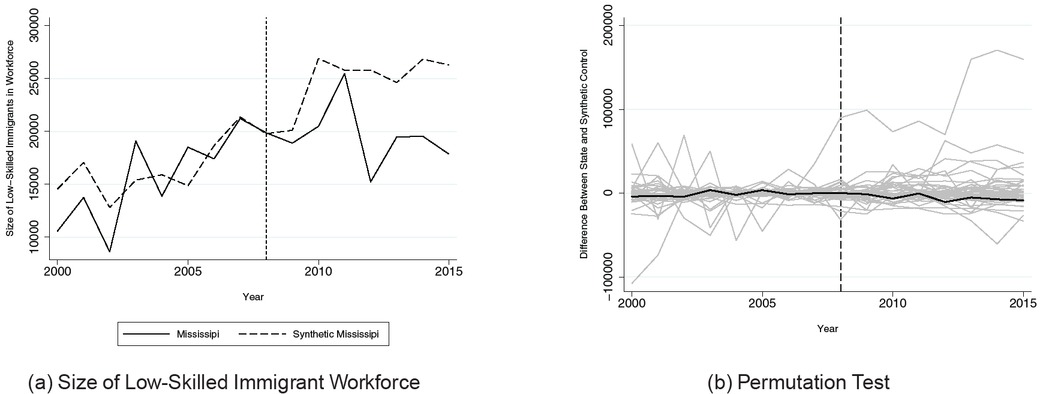
Figure A5
Mississippi universal e-verify and size of low-skilled immigrant workforce
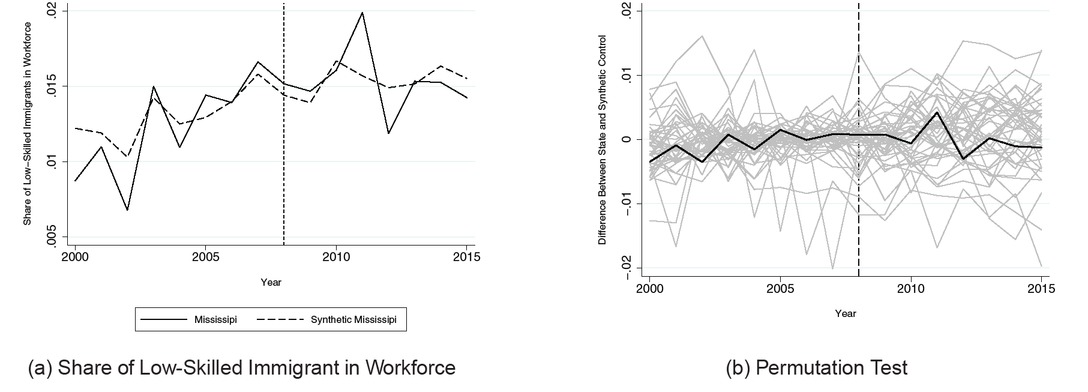
Figure A6
Mississippi universal e-verify and share of low-skilled immigrants in workforce
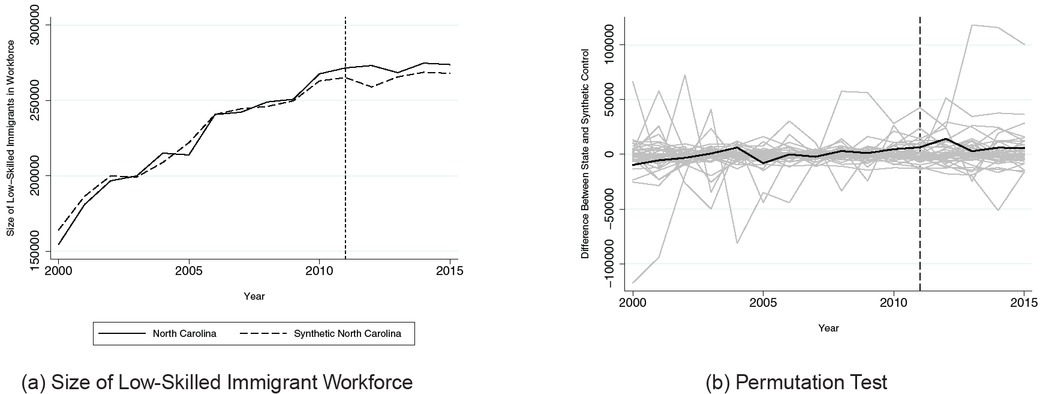
Figure A7
North carolina universal e-verify and size of low-skilled immigrant workforce
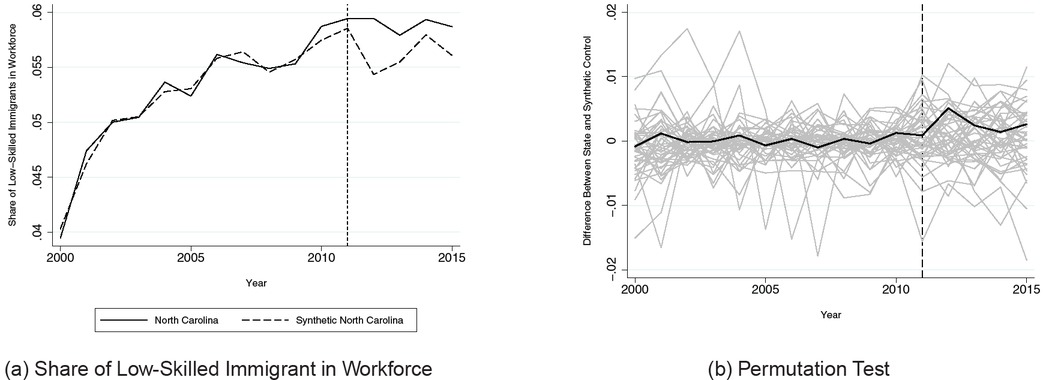
Figure A8
North carolina universal e-verify and share of low-skilled immigrants in workforce
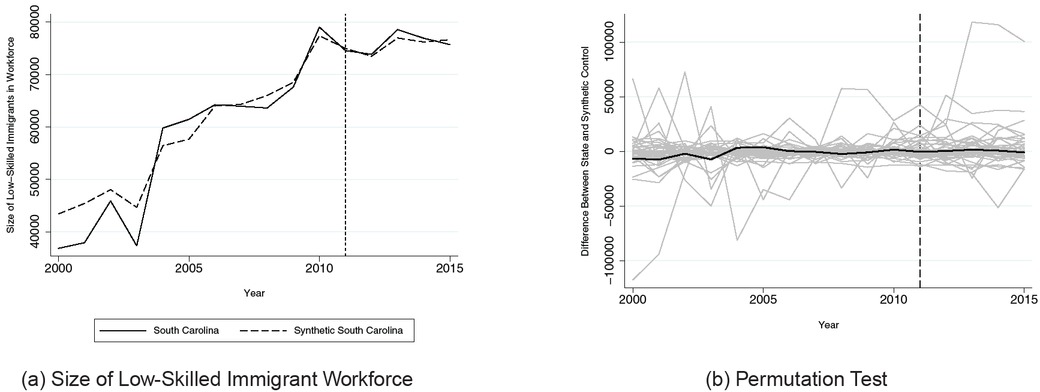
Figure A9
South carolina universal e-verify and size of low-skilled immigrant workforce
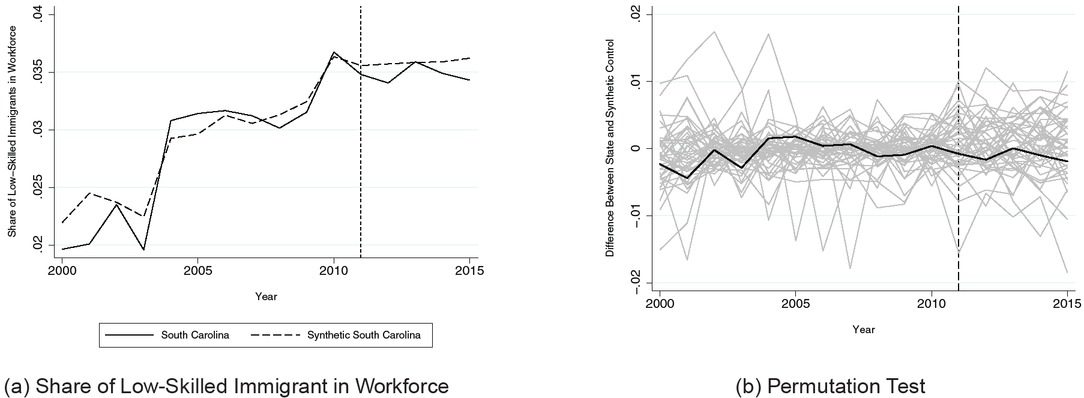
Figure A10
South carolina universal e-verify and share of low-skilled immigrants in workforce
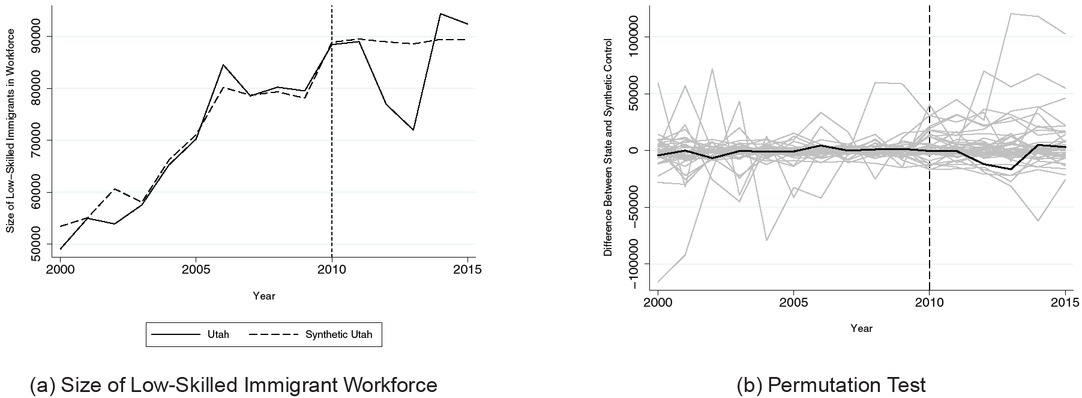
Figure A11
Utah universal e-verify and size of low-skilled immigrant workforce
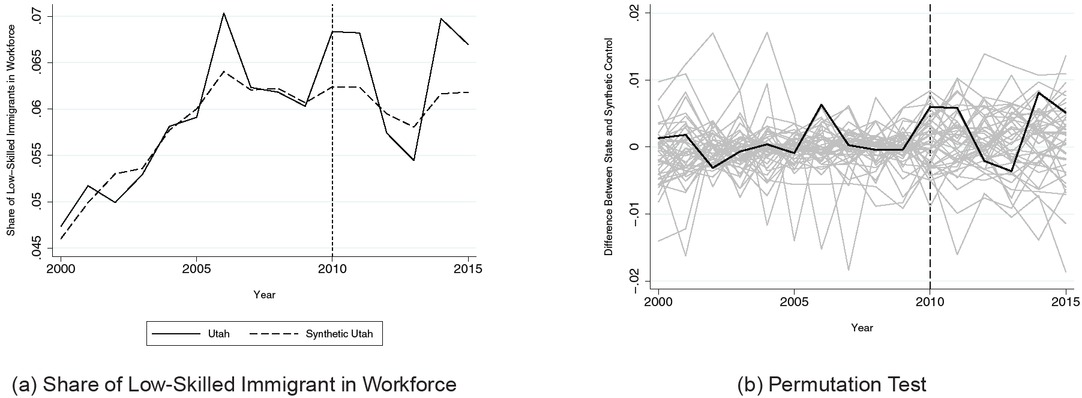
Figure A12
Utah universal e-verify and share of low-skilled immigrants in workforce
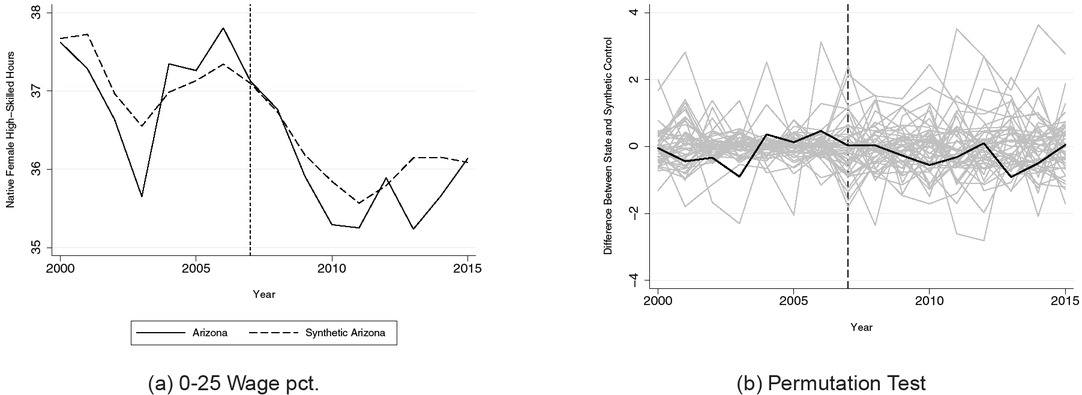
Figure A13
Native female weekly hours (0-25 wage pct. | hours >0)
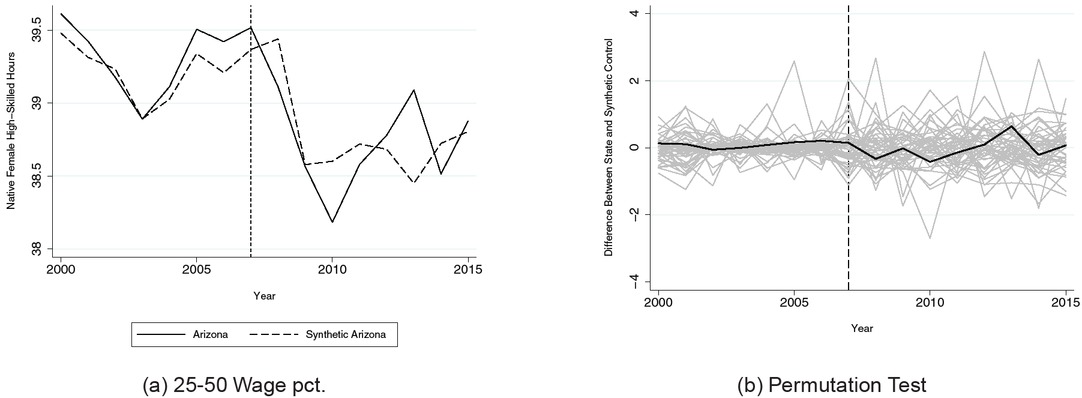
Figure A14
Native female weekly hours (25-50 wage pct. | hours>0)
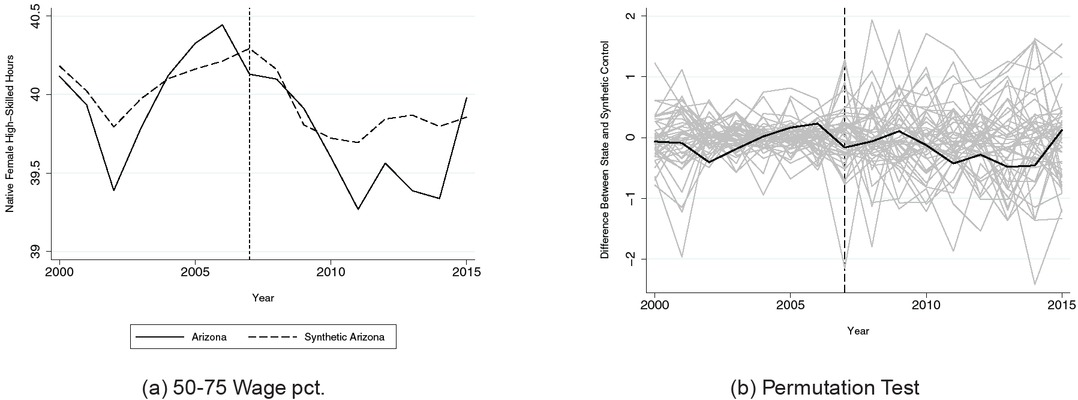
Figure A15
Native female weekly hours (50-75 wage pct. | hours>0)
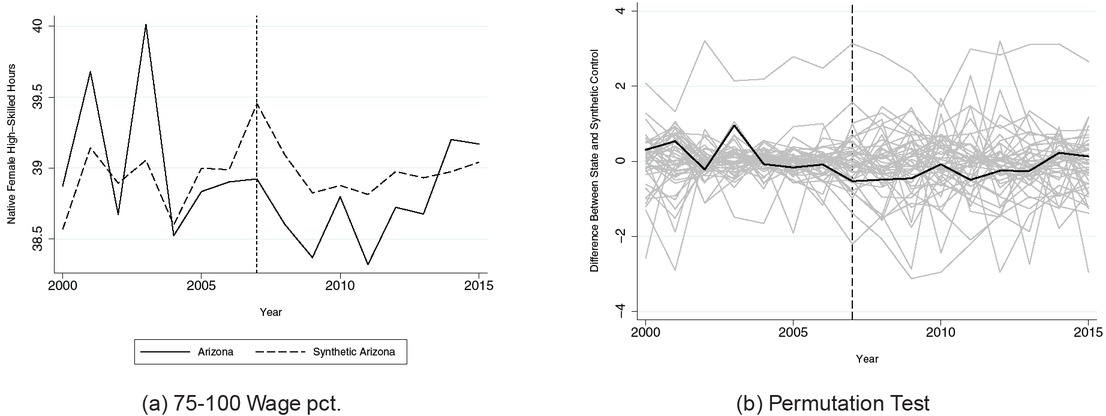
Figure A16
Native female weekly hours (75-100 wage pct. | hours>0)
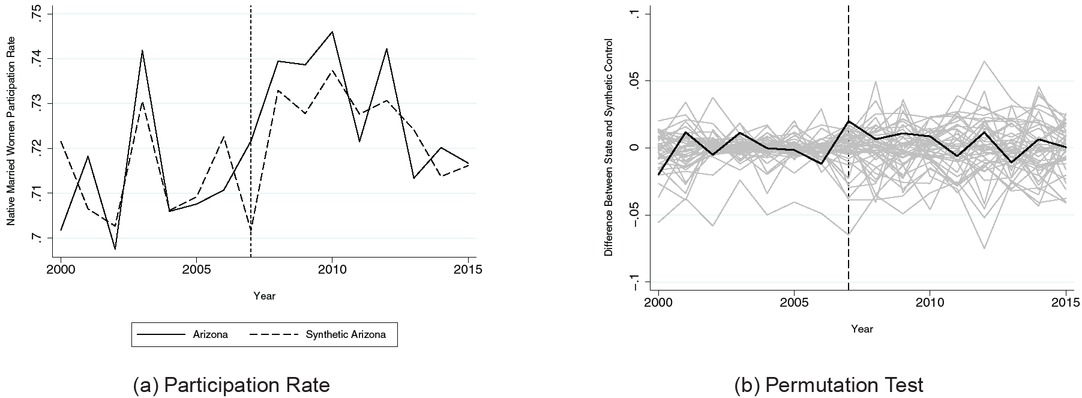
Figure A17
Native married women participation rate
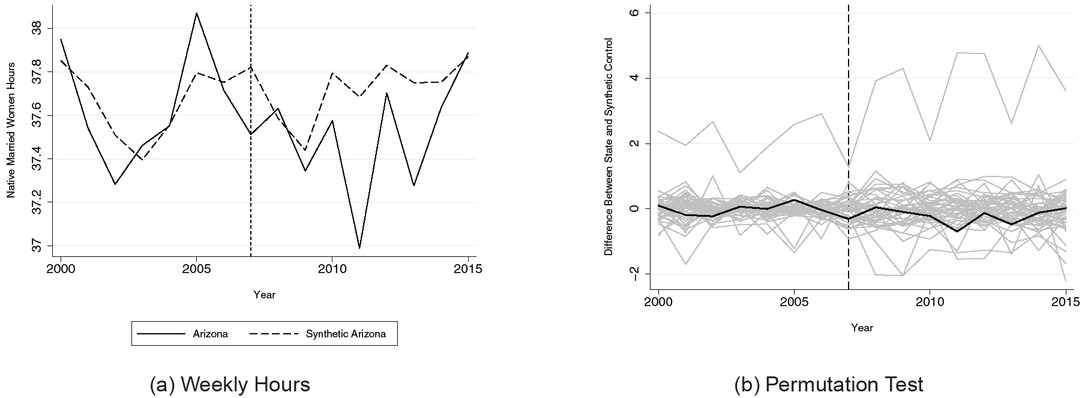
Figure A18
Native married women weekly hours (hours > 0)
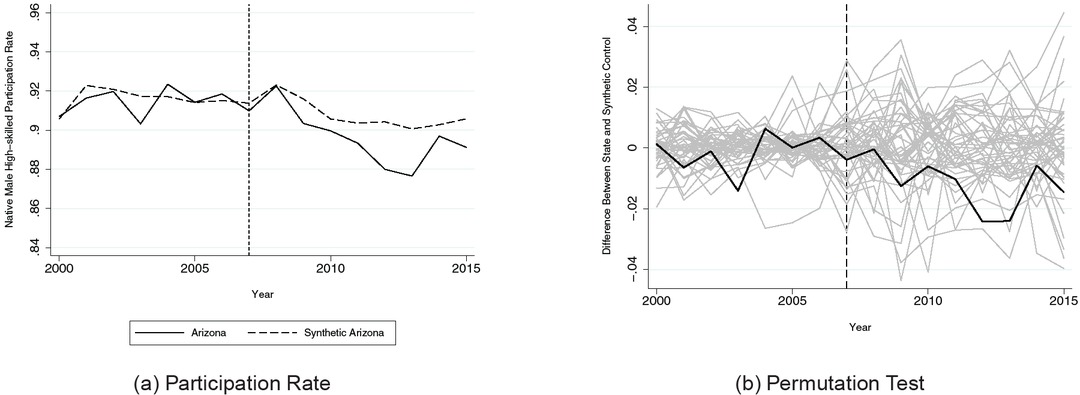
Figure A19
Native high-skilled male participation rate
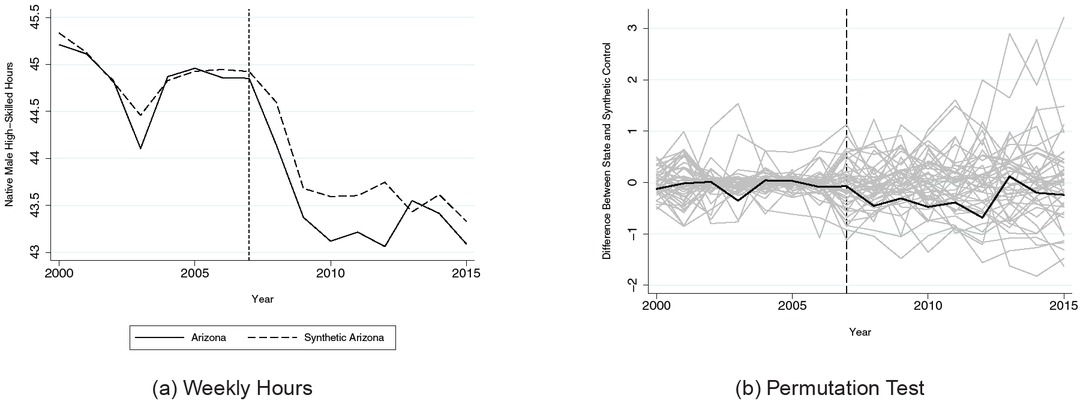
Figure A20
Native high-skilled male weekly hours (hours > 0)
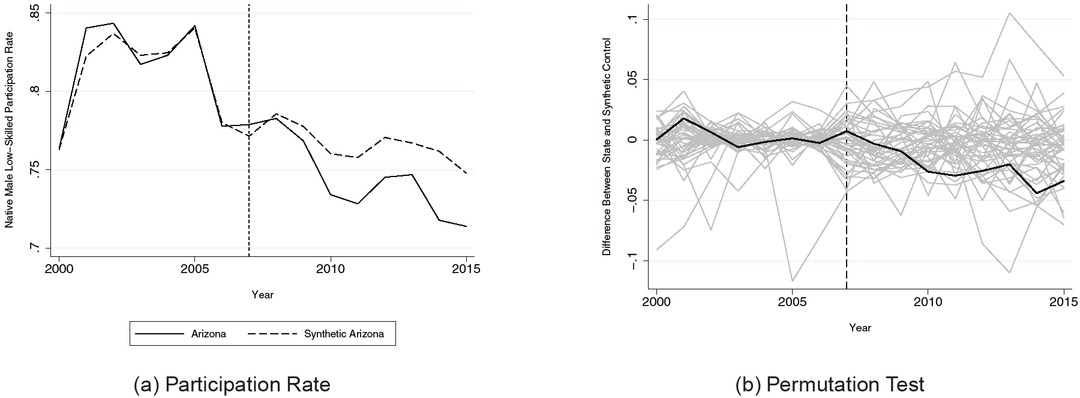
Figure A21
Native Low-skilled Male Participation Rate
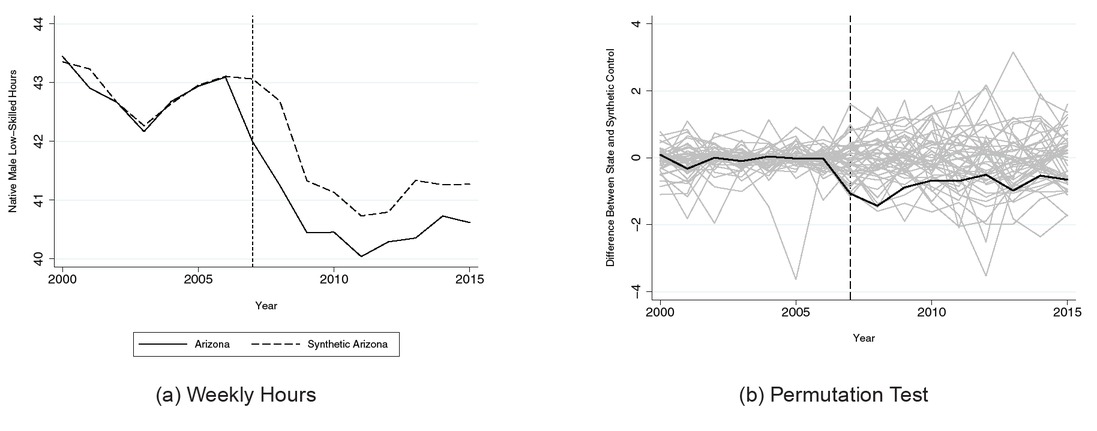
Figure A22
Native low-skilled male weekly hours (hours > 0)
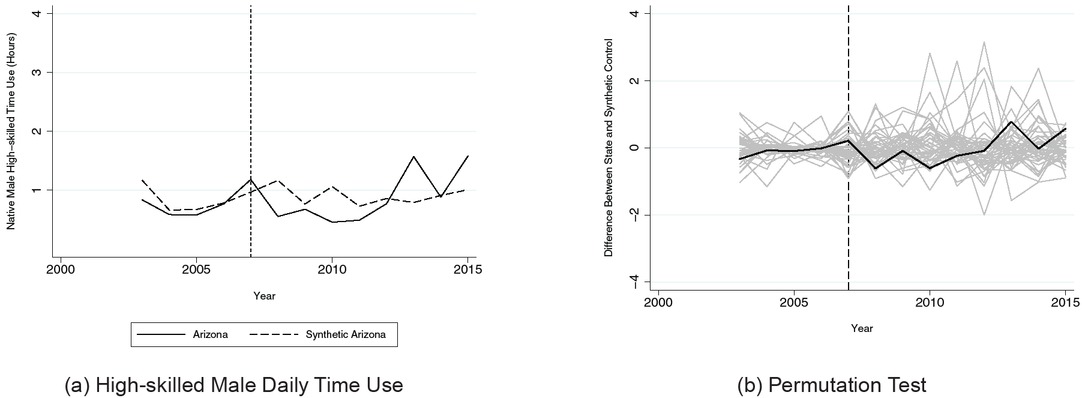
Figure A23
Native high-skilled male daily time spent on housework, gardening, and caring for children
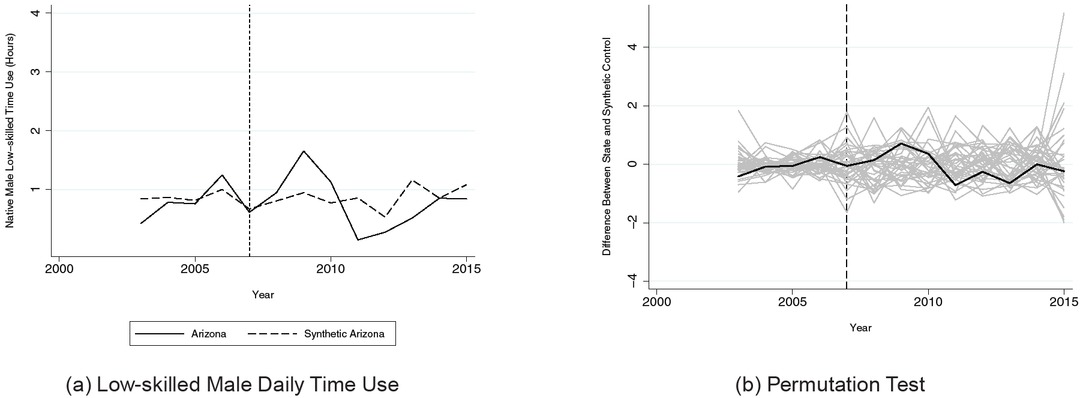
Figure A24
Native low-skilled male daily time spent on housework, gardening, and caring for children
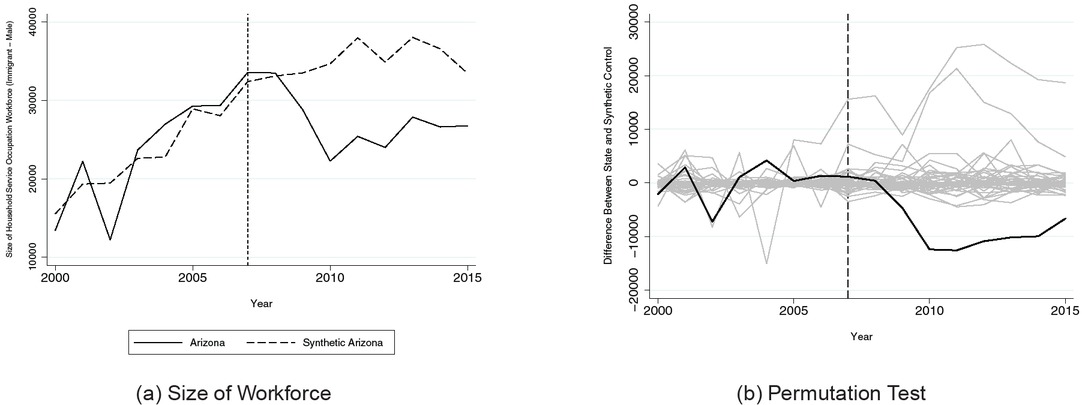
Figure A25
Size of immigrant workforce (male) in household service occupations
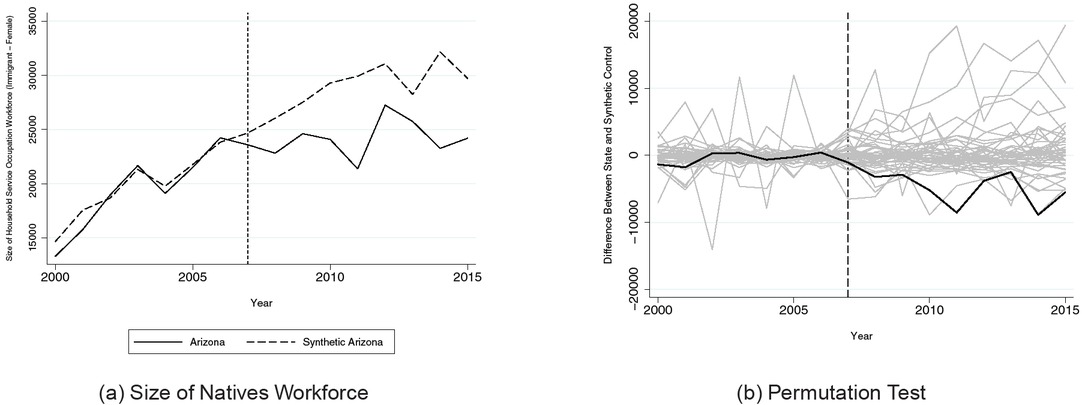
Figure A26
Size of immigrant workforce (female) in household service occupations
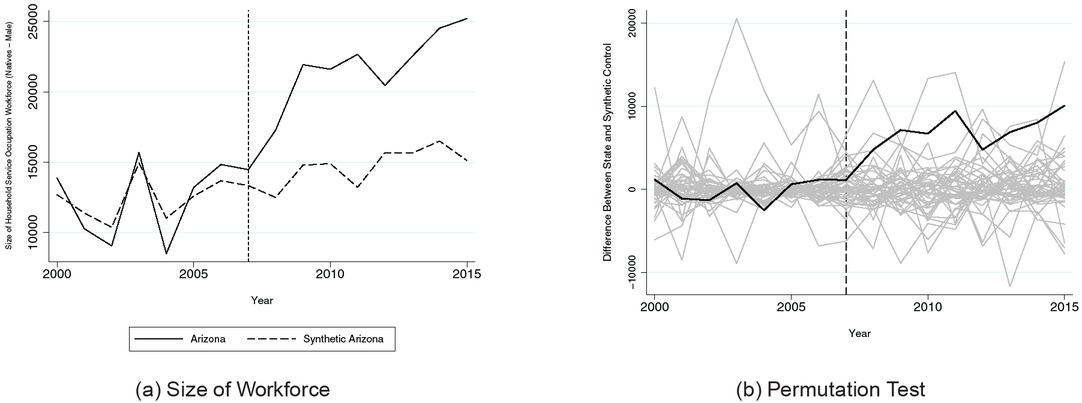
Figure A27
Size of native workforce (male) in household service occupations
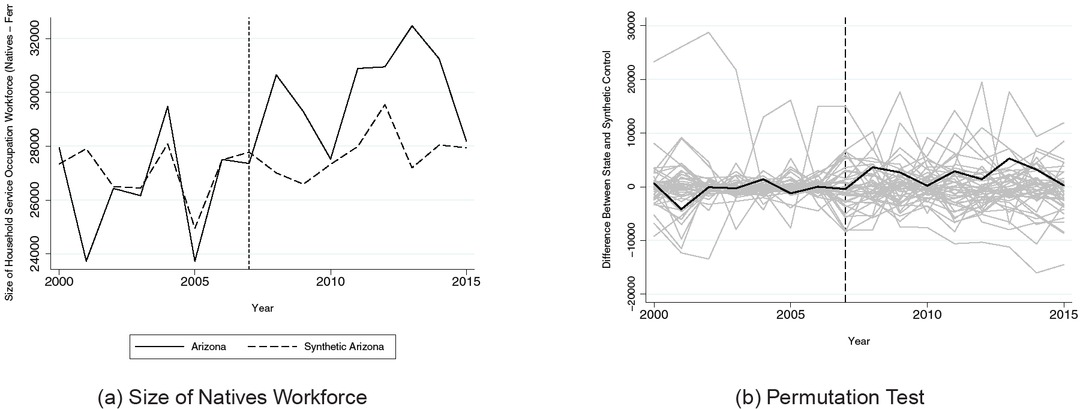
Figure A28
Size of native workforce (female) in household service occupations
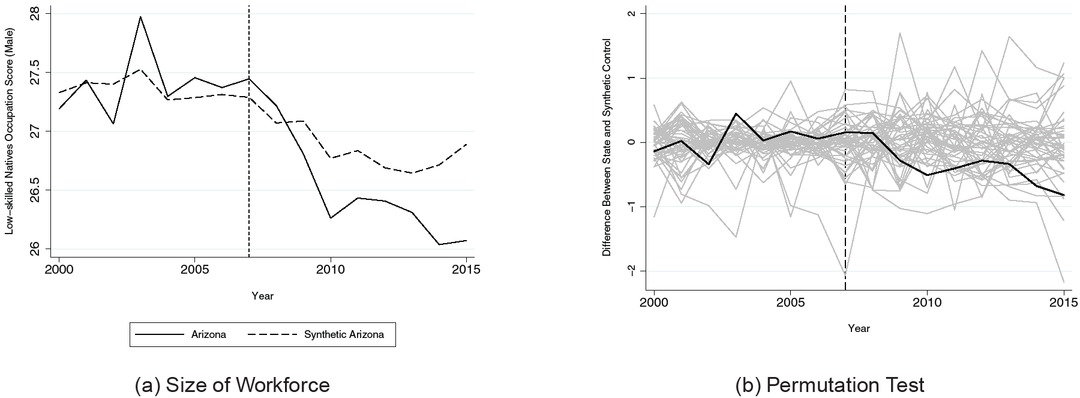
Figure A29
Low-skilled natives occupational income score (male)
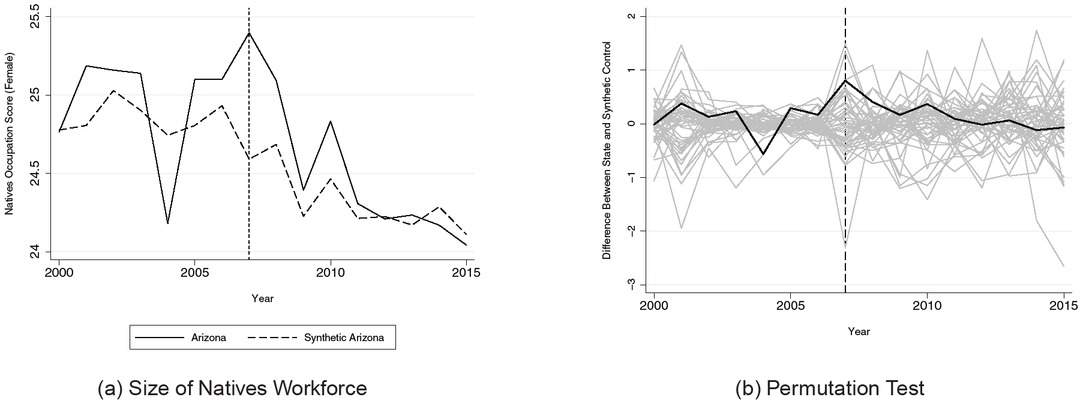
Figure A30
Low-skilled natives occupational income score (female)
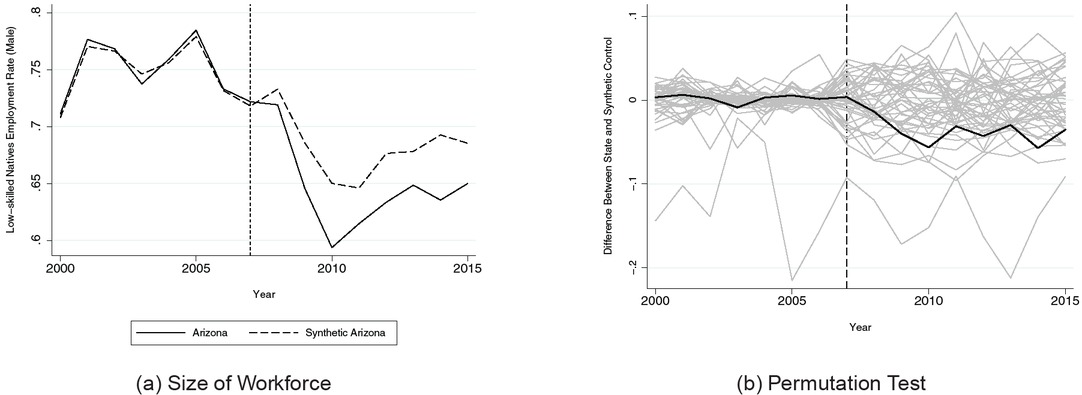
Figure A31
Low-skilled natives employment rate (male)
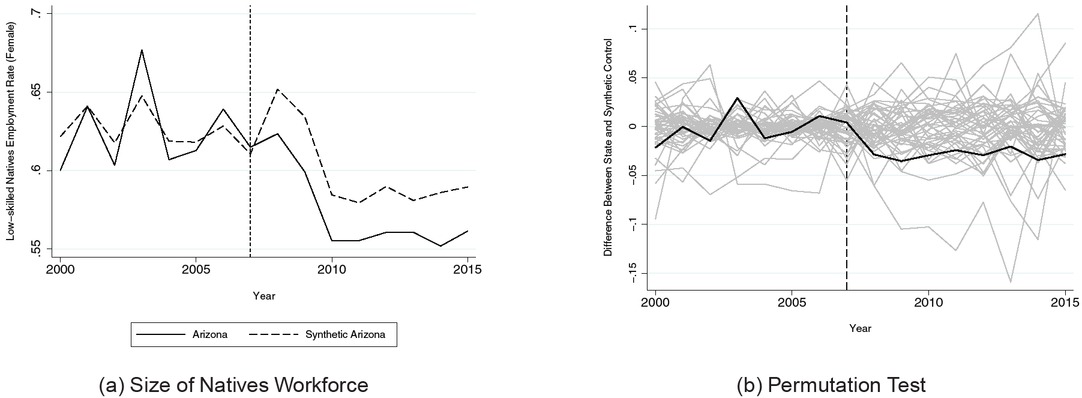
Figure A32
Low-skilled natives employment rate (female)
Table A1
Weights used in construction of synthetic control for low-skilled immigrant analysis in Table 2
| States | Arizona | Alabama | Georgia | Mississippi | North Carolina | South Carolina | Utah | |||||||
|---|---|---|---|---|---|---|---|---|---|---|---|---|---|---|
| Size of workforce | Share of workforce | Size of workforce | Share of workforce | Size of workforce | Share of workforce | Size of workforce | Share of workforce | Size of workforce | Share of workforce | Size of workforce | Share of workforce | Size of workforce | Share of workforce | |
| Alaska | 0.000 | 0.000 | 0.000 | 0.000 | 0.000 | 0.000 | 0.257 | 0.035 | 0.000 | 0.000 | 0.062 | 0.000 | 0.000 | 0.001 |
| Arkansas | 0.000 | 0.000 | 0.000 | 0.037 | 0.000 | 0.000 | 0.000 | 0.000 | 0.000 | 0.041 | 0.000 | 0.000 | 0.000 | 0.000 |
| California | 0.000 | 0.107 | 0.000 | 0.000 | 0.000 | 0.018 | 0.000 | 0.000 | 0.000 | 0.009 | 0.000 | 0.000 | 0.000 | 0.000 |
| Colorado | 0.135 | 0.219 | 0.000 | 0.000 | 0.199 | 0.189 | 0.000 | 0.000 | 0.000 | 0.118 | 0.000 | 0.000 | 0.000 | 0.420 |
| Connecticut | 0.000 | 0.000 | 0.000 | 0.000 | 0.000 | 0.000 | 0.000 | 0.000 | 0.000 | 0.000 | 0.000 | 0.000 | 0.000 | 0.000 |
| Delaware | 0.000 | 0.000 | 0.000 | 0.000 | 0.000 | 0.009 | 0.000 | 0.000 | 0.000 | 0.006 | 0.043 | 0.151 | 0.000 | 0.000 |
| District of | 0.000 | 0.000 | 0.030 | 0.011 | 0.000 | 0.000 | 0.000 | 0.000 | 0.000 | 0.000 | 0.000 | 0.000 | 0.032 | 0.000 |
| Columbia | ||||||||||||||
| Florida | 0.152 | 0.271 | 0.000 | 0.000 | 0.047 | 0.068 | 0.000 | 0.000 | 0.000 | 0.000 | 0.000 | 0.000 | 0.000 | 0.000 |
| Hawaii | 0.000 | 0.000 | 0.034 | 0.000 | 0.000 | 0.000 | 0.000 | 0.000 | 0.000 | 0.000 | 0.000 | 0.000 | 0.000 | 0.000 |
| Idaho | 0.000 | 0.000 | 0.000 | 0.000 | 0.000 | 0.000 | 0.000 | 0.000 | 0.000 | 0.046 | 0.000 | 0.000 | 0.000 | 0.000 |
| Illinois | 0.000 | 0.000 | 0.000 | 0.000 | 0.000 | 0.000 | 0.000 | 0.000 | 0.000 | 0.000 | 0.000 | 0.000 | 0.000 | 0.000 |
| Indiana | 0.000 | 0.000 | 0.000 | 0.000 | 0.219 | 0.000 | 0.000 | 0.000 | 0.310 | 0.147 | 0.097 | 0.261 | 0.000 | 0.000 |
| Iowa | 0.000 | 0.000 | 0.000 | 0.042 | 0.000 | 0.000 | 0.000 | 0.000 | 0.000 | 0.000 | 0.000 | 0.000 | 0.000 | 0.000 |
| Kansas | 0.000 | 0.000 | 0.000 | 0.000 | 0.000 | 0.000 | 0.000 | 0.000 | 0.000 | 0.000 | 0.000 | 0.000 | 0.000 | 0.271 |
| Kentucky | 0.000 | 0.000 | 0.407 | 0.370 | 0.326 | 0.244 | 0.000 | 0.000 | 0.000 | 0.000 | 0.367 | 0.212 | 0.000 | 0.000 |
| Louisiana | 0.050 | 0.000 | 0.454 | 0.432 | 0.000 | 0.017 | 0.370 | 0.196 | 0.171 | 0.034 | 0.165 | 0.251 | 0.151 | 0.044 |
| Maine | 0.000 | 0.000 | 0.000 | 0.000 | 0.000 | 0.000 | 0.000 | 0.000 | 0.000 | 0.000 | 0.000 | 0.000 | 0.000 | 0.000 |
| Maryland | 0.000 | 0.000 | 0.000 | 0.000 | 0.074 | 0.033 | 0.000 | 0.000 | 0.066 | 0.000 | 0.000 | 0.000 | 0.046 | 0.000 |
| Massachusetts | 0.000 | 0.000 | 0.000 | 0.000 | 0.000 | 0.000 | 0.000 | 0.000 | 0.000 | 0.000 | 0.000 | 0.000 | 0.000 | 0.000 |
| Michigan | 0.000 | 0.000 | 0.000 | 0.044 | 0.000 | 0.000 | 0.000 | 0.261 | 0.028 | 0.024 | 0.000 | 0.001 | 0.000 | 0.000 |
| Minnesota | 0.000 | 0.000 | 0.000 | 0.000 | 0.000 | 0.000 | 0.000 | 0.000 | 0.000 | 0.000 | 0.000 | 0.000 | 0.000 | 0.000 |
| Missouri | 0.000 | 0.000 | 0.000 | 0.000 | 0.000 | 0.000 | 0.000 | 0.000 | 0.000 | 0.000 | 0.000 | 0.000 | 0.000 | 0.000 |
| Montana | 0.000 | 0.000 | 0.000 | 0.000 | 0.000 | 0.000 | 0.000 | 0.000 | 0.000 | 0.000 | 0.000 | 0.000 | 0.000 | 0.000 |
| Nebraska | 0.000 | 0.000 | 0.000 | 0.000 | 0.000 | 0.000 | 0.000 | 0.000 | 0.000 | 0.000 | 0.000 | 0.000 | 0.000 | 0.000 |
| Nevada | 0.083 | 0.000 | 0.000 | 0.000 | 0.009 | 0.062 | 0.000 | 0.000 | 0.000 | 0.052 | 0.000 | 0.000 | 0.014 | 0.052 |
| New | 0.000 | 0.000 | 0.000 | 0.000 | 0.000 | 0.000 | 0.000 | 0.000 | 0.000 | 0.000 | 0.033 | 0.000 | 0.518 | 0.086 |
| Hampshire | ||||||||||||||
| New Jersey | 0.000 | 0.000 | 0.000 | 0.000 | 0.000 | 0.000 | 0.000 | 0.000 | 0.000 | 0.000 | 0.000 | 0.000 | 0.000 | 0.000 |
| New Mexico | 0.000 | 0.000 | 0.000 | 0.000 | 0.000 | 0.000 | 0.000 | 0.000 | 0.000 | 0.071 | 0.000 | 0.000 | 0.000 | 0.000 |
| New York | 0.000 | 0.000 | 0.000 | 0.000 | 0.040 | 0.000 | 0.000 | 0.000 | 0.021 | 0.007 | 0.000 | 0.000 | 0.000 | 0.000 |
| North | 0.000 | 0.000 | 0.000 | 0.000 | 0.000 | 0.000 | 0.000 | 0.000 | 0.000 | 0.000 | 0.000 | 0.000 | 0.000 | 0.000 |
| Dakota | ||||||||||||||
| Ohio | 0.000 | 0.000 | 0.000 | 0.000 | 0.000 | 0.000 | 0.000 | 0.000 | 0.000 | 0.000 | 0.128 | 0.000 | 0.000 | 0.000 |
| Oklahoma | 0.000 | 0.000 | 0.000 | 0.000 | 0.000 | 0.000 | 0.000 | 0.000 | 0.000 | 0.000 | 0.000 | 0.000 | 0.000 | 0.000 |
| Oregon | 0.000 | 0.000 | 0.057 | 0.000 | 0.000 | 0.000 | 0.000 | 0.000 | 0.000 | 0.066 | 0.000 | 0.000 | 0.000 | 0.000 |
| Pennsylvania | 0.313 | 0.000 | 0.019 | 0.000 | 0.000 | 0.000 | 0.000 | 0.000 | 0.000 | 0.000 | 0.000 | 0.000 | 0.000 | 0.000 |
| Rhode Island | 0.000 | 0.000 | 0.000 | 0.000 | 0.000 | 0.000 | 0.000 | 0.000 | 0.000 | 0.000 | 0.000 | 0.000 | 0.000 | 0.000 |
| South | 0.000 | 0.000 | 0.000 | 0.000 | 0.000 | 0.000 | 0.000 | 0.000 | 0.000 | 0.000 | 0.000 | 0.000 | 0.000 | 0.000 |
| Dakota | ||||||||||||||
| Tennessee | 0.000 | 0.000 | 0.000 | 0.058 | 0.000 | 0.223 | 0.000 | 0.000 | 0.100 | 0.312 | 0.000 | 0.000 | 0.000 | 0.000 |
| Texas | 0.037 | 0.403 | 0.000 | 0.000 | 0.085 | 0.137 | 0.000 | 0.000 | 0.072 | 0.037 | 0.000 | 0.000 | 0.000 | 0.000 |
| Vermont | 0.000 | 0.000 | 0.000 | 0.000 | 0.000 | 0.000 | 0.000 | 0.000 | 0.000 | 0.000 | 0.000 | 0.000 | 0.000 | 0.000 |
| Virginia | 0.000 | 0.000 | 0.000 | 0.000 | 0.000 | 0.000 | 0.000 | 0.000 | 0.038 | 0.000 | 0.000 | 0.000 | 0.053 | 0.000 |
| Washington | 0.230 | 0.000 | 0.000 | 0.000 | 0.000 | 0.000 | 0.000 | 0.000 | 0.194 | 0.030 | 0.107 | 0.125 | 0.186 | 0.127 |
| West Virginia | 0.000 | 0.000 | 0.000 | 0.006 | 0.000 | 0.000 | 0.372 | 0.507 | 0.000 | 0.000 | 0.000 | 0.000 | 0.000 | 0.000 |
| Wisconsin | 0.000 | 0.000 | 0.000 | 0.000 | 0.000 | 0.000 | 0.000 | 0.000 | 0.000 | 0.000 | 0.000 | 0.000 | 0.000 | 0.000 |
| Wyoming | 0.000 | 0.000 | 0.000 | 0.000 | 0.000 | 0.000 | 0.000 | 0.000 | 0.000 | 0.000 | 0.000 | 0.000 | 0.000 | 0.000 |
Table A2
Weights used in construction of synthetic Arizona for female labor supply analysis in Table 3
| Donor states | Labor force participation (LFP) | Hours per week | ||||
|---|---|---|---|---|---|---|
| High | Low | Married | High | Low | Married | |
| skilled | skilled | skilled | skilled | |||
| Alaska | 0.000 | 0.089 | 0.047 | 0.000 | 0.000 | 0.000 |
| Arkansas | 0.000 | 0.090 | 0.000 | 0.000 | 0.000 | 0.000 |
| California | 0.079 | 0.000 | 0.000 | 0.000 | 0.000 | 0.000 |
| Colorado | 0.000 | 0.383 | 0.000 | 0.285 | 0.000 | 0.176 |
| Connecticut | 0.000 | 0.000 | 0.000 | 0.000 | 0.000 | 0.000 |
| Delaware | 0.000 | 0.000 | 0.000 | 0.000 | 0.000 | 0.000 |
| District of Columbia | 0.000 | 0.000 | 0.000 | 0.095 | 0.000 | 0.000 |
| Florida | 0.037 | 0.000 | 0.000 | 0.100 | 0.042 | 0.074 |
| Hawaii | 0.000 | 0.000 | 0.173 | 0.000 | 0.000 | 0.000 |
| Idaho | 0.217 | 0.000 | 0.514 | 0.000 | 0.000 | 0.000 |
| Illinois | 0.000 | 0.000 | 0.000 | 0.000 | 0.000 | 0.000 |
| Indiana | 0.000 | 0.000 | 0.000 | 0.000 | 0.000 | 0.000 |
| Iowa | 0.000 | 0.000 | 0.000 | 0.000 | 0.000 | 0.000 |
| Kansas | 0.000 | 0.000 | 0.000 | 0.000 | 0.000 | 0.000 |
| Kentucky | 0.000 | 0.000 | 0.000 | 0.000 | 0.000 | 0.000 |
| Louisiana | 0.000 | 0.000 | 0.000 | 0.000 | 0.000 | 0.000 |
| Maine | 0.000 | 0.000 | 0.000 | 0.153 | 0.156 | 0.151 |
| Maryland | 0.000 | 0.000 | 0.000 | 0.000 | 0.000 | 0.075 |
| Massachusetts | 0.000 | 0.000 | 0.000 | 0.000 | 0.000 | 0.000 |
| Michigan | 0.000 | 0.000 | 0.000 | 0.000 | 0.000 | 0.000 |
| Minnesota | 0.000 | 0.000 | 0.000 | 0.000 | 0.000 | 0.000 |
| Missouri | 0.000 | 0.000 | 0.000 | 0.000 | 0.000 | 0.000 |
| Montana | 0.000 | 0.106 | 0.000 | 0.000 | 0.000 | 0.000 |
| Nebraska | 0.000 | 0.000 | 0.000 | 0.000 | 0.000 | 0.000 |
| Nevada | 0.124 | 0.028 | 0.072 | 0.192 | 0.127 | 0.160 |
| New Hampshire | 0.000 | 0.000 | 0.000 | 0.015 | 0.000 | 0.000 |
| New Jersey | 0.000 | 0.000 | 0.000 | 0.000 | 0.000 | 0.000 |
| New Mexico | 0.092 | 0.000 | 0.000 | 0.000 | 0.060 | 0.000 |
| New York | 0.000 | 0.000 | 0.000 | 0.000 | 0.000 | 0.000 |
| North Dakota | 0.000 | 0.000 | 0.000 | 0.000 | 0.000 | 0.000 |
| Ohio | 0.000 | 0.000 | 0.000 | 0.000 | 0.000 | 0.000 |
| Oklahoma | 0.252 | 0.000 | 0.000 | 0.000 | 0.000 | 0.000 |
| Oregon | 0.000 | 0.000 | 0.025 | 0.000 | 0.000 | 0.000 |
| Pennsylvania | 0.000 | 0.000 | 0.000 | 0.000 | 0.000 | 0.000 |
| Rhode Island | 0.000 | 0.000 | 0.000 | 0.000 | 0.000 | 0.000 |
| South Dakota | 0.000 | 0.000 | 0.000 | 0.000 | 0.206 | 0.000 |
| Tennessee | 0.000 | 0.000 | 0.000 | 0.000 | 0.000 | 0.000 |
| Texas | 0.199 | 0.000 | 0.003 | 0.150 | 0.409 | 0.364 |
| Vermont | 0.000 | 0.000 | 0.000 | 0.011 | 0.000 | 0.000 |
| Virginia | 0.000 | 0.000 | 0.000 | 0.000 | 0.000 | 0.000 |
| Washington | 0.000 | 0.075 | 0.000 | 0.000 | 0.000 | 0.000 |
| West Virginia | 0.000 | 0.230 | 0.167 | 0.000 | 0.000 | 0.000 |
| Wisconsin | 0.000 | 0.000 | 0.000 | 0.000 | 0.000 | 0.000 |
| Wyoming | 0.000 | 0.000 | 0.000 | 0.000 | 0.000 | 0.000 |
Table A3
Weights used in construction of synthetic Arizona for male labor supply analysis in Table 3
| Donor states | Labor force participation (LFP) | Hours per week | ||
|---|---|---|---|---|
| High skilled | Low skilled | High skilled | Low skilled | |
| Alaska | 0.000 | 0.000 | 0.000 | 0.000 |
| Arkansas | 0.155 | 0.000 | 0.000 | 0.000 |
| California | 0.224 | 0.463 | 0.129 | 0.071 |
| Colorado | 0.000 | 0.000 | 0.128 | 0.466 |
| Connecticut | 0.000 | 0.000 | 0.000 | 0.000 |
| Delaware | 0.000 | 0.000 | 0.000 | 0.000 |
| District of Columbia | 0.000 | 0.016 | 0.000 | 0.022 |
| Florida | 0.124 | 0.000 | 0.220 | 0.011 |
| Hawaii | 0.073 | 0.000 | 0.000 | 0.000 |
| Idaho | 0.000 | 0.000 | 0.000 | 0.034 |
| Illinois | 0.000 | 0.000 | 0.000 | 0.000 |
| Indiana | 0.000 | 0.000 | 0.000 | 0.000 |
| Iowa | 0.000 | 0.000 | 0.000 | 0.000 |
| Kansas | 0.000 | 0.000 | 0.000 | 0.000 |
| Kentucky | 0.000 | 0.000 | 0.000 | 0.000 |
| Louisiana | 0.000 | 0.046 | 0.000 | 0.000 |
| Maine | 0.000 | 0.000 | 0.000 | 0.000 |
| Maryland | 0.000 | 0.000 | 0.000 | 0.000 |
| Massachusetts | 0.000 | 0.000 | 0.000 | 0.000 |
| Michigan | 0.000 | 0.000 | 0.000 | 0.000 |
| Minnesota | 0.000 | 0.000 | 0.000 | 0.000 |
| Missouri | 0.000 | 0.000 | 0.000 | 0.000 |
| Montana | 0.000 | 0.233 | 0.193 | 0.000 |
| Nebraska | 0.000 | 0.000 | 0.000 | 0.000 |
| Nevada | 0.115 | 0.000 | 0.160 | 0.315 |
| New Hampshire | 0.000 | 0.000 | 0.000 | 0.000 |
| New Jersey | 0.000 | 0.000 | 0.000 | 0.000 |
| New Mexico | 0.122 | 0.000 | 0.000 | 0.000 |
| New York | 0.000 | 0.000 | 0.000 | 0.000 |
| North Dakota | 0.000 | 0.000 | 0.000 | 0.000 |
| Ohio | 0.000 | 0.000 | 0.000 | 0.000 |
| Oklahoma | 0.000 | 0.000 | 0.000 | 0.000 |
| Oregon | 0.000 | 0.000 | 0.000 | 0.020 |
| Pennsylvania | 0.000 | 0.000 | 0.000 | 0.000 |
| Rhode Island | 0.000 | 0.037 | 0.000 | 0.000 |
| South Dakota | 0.000 | 0.000 | 0.000 | 0.000 |
| Tennessee | 0.084 | 0.000 | 0.111 | 0.000 |
| Texas | 0.000 | 0.000 | 0.054 | 0.000 |
| Vermont | 0.000 | 0.000 | 0.000 | 0.000 |
| Virginia | 0.000 | 0.070 | 0.000 | 0.000 |
| Washington | 0.000 | 0.000 | 0.006 | 0.061 |
| West Virginia | 0.000 | 0.135 | 0.000 | 0.000 |
| Wisconsin | 0.000 | 0.000 | 0.000 | 0.000 |
| Wyoming | 0.103 | 0.000 | 0.000 | 0.000 |
Table A4
Weights used in construction of synthetic Arizona for female labor supply analysis in Table 3
| Donor states | 0–25 pct. | 25–50 pct. | 50–75 pct. | 75–100 pct. |
|---|---|---|---|---|
| Alaska | 0.000 | 0.000 | 0.000 | 0.000 |
| Arkansas | 0.000 | 0.000 | 0.000 | 0.000 |
| California | 0.000 | 0.007 | 0.000 | 0.000 |
| Colorado | 0.064 | 0.169 | 0.198 | 0.170 |
| Connecticut | 0.000 | 0.000 | 0.000 | 0.000 |
| Delaware | 0.000 | 0.087 | 0.000 | 0.000 |
| District of Columbia | 0.014 | 0.010 | 0.000 | 0.015 |
| Florida | 0.000 | 0.391 | 0.163 | 0.406 |
| Hawaii | 0.000 | 0.001 | 0.000 | 0.000 |
| Idaho | 0.000 | 0.019 | 0.000 | 0.000 |
| Illinois | 0.000 | 0.000 | 0.000 | 0.000 |
| Indiana | 0.000 | 0.000 | 0.000 | 0.054 |
| Iowa | 0.000 | 0.000 | 0.000 | 0.000 |
| Kansas | 0.000 | 0.000 | 0.000 | 0.000 |
| Kentucky | 0.000 | 0.000 | 0.000 | 0.000 |
| Louisiana | 0.000 | 0.000 | 0.000 | 0.000 |
| Maine | 0.000 | 0.000 | 0.000 | 0.000 |
| Maryland | 0.000 | 0.000 | 0.000 | 0.000 |
| Massachusetts | 0.000 | 0.000 | 0.000 | 0.000 |
| Michigan | 0.000 | 0.000 | 0.000 | 0.000 |
| Minnesota | 0.000 | 0.000 | 0.000 | 0.000 |
| Missouri | 0.000 | 0.000 | 0.000 | 0.000 |
| Montana | 0.000 | 0.000 | 0.000 | 0.000 |
| Nebraska | 0.240 | 0.000 | 0.000 | 0.000 |
| Nevada | 0.118 | 0.074 | 0.203 | 0.095 |
| New Hampshire | 0.000 | 0.000 | 0.000 | 0.000 |
| New Jersey | 0.000 | 0.000 | 0.000 | 0.000 |
| New Mexico | 0.230 | 0.000 | 0.000 | 0.000 |
| New York | 0.000 | 0.000 | 0.124 | 0.000 |
| North Dakota | 0.000 | 0.000 | 0.000 | 0.000 |
| Ohio | 0.000 | 0.000 | 0.000 | 0.000 |
| Oklahoma | 0.000 | 0.000 | 0.000 | 0.000 |
| Oregon | 0.000 | 0.000 | 0.000 | 0.000 |
| Pennsylvania | 0.000 | 0.000 | 0.000 | 0.000 |
| Rhode Island | 0.000 | 0.000 | 0.000 | 0.000 |
| South Dakota | 0.000 | 0.000 | 0.000 | 0.000 |
| Tennessee | 0.000 | 0.000 | 0.000 | 0.000 |
| Texas | 0.336 | 0.240 | 0.313 | 0.095 |
| Vermont | 0.000 | 0.000 | 0.000 | 0.000 |
| Virginia | 0.000 | 0.000 | 0.000 | 0.135 |
| Washington | 0.000 | 0.000 | 0.000 | 0.000 |
| West Virginia | 0.000 | 0.000 | 0.000 | 0.031 |
| Wisconsin | 0.000 | 0.000 | 0.000 | 0.000 |
| Wyoming | 0.000 | 0.000 | 0.000 | 0.000 |
Table A5
Weights used in construction of synthetic Arizona for time-use analysis in Table 4
| High-skilled female | Low-skilled female | High-skilled male | Low-skilled male | ||||
|---|---|---|---|---|---|---|---|
| Donor states | Weight | Donor states | Weight | Donor states | Weight | Donor states | Weight |
| Alaska | 0.010 | Arkansas | 0.000 | Arkansas | 0.000 | Arkansas | 0.002 |
| Arkansas | 0.000 | California | 0.000 | California | 0.000 | California | 0.000 |
| California | 0.000 | Colorado | 0.000 | Colorado | 0.180 | Colorado | 0.450 |
| Colorado | 0.275 | Connecticut | 0.000 | Connecticut | 0.000 | Connecticut | 0.000 |
| Connecticut | 0.000 | Florida | 0.209 | Delaware | 0.000 | Florida | 0.189 |
| Delaware | 0.145 | Hawaii | 0.043 | District of | 0.000 | Idaho | 0.000 |
| Columbia | |||||||
| District of | 0.000 | Idaho | 0.073 | Florida | 0.064 | Illinois | 0.000 |
| Columbia | |||||||
| Florida | 0.248 | Illinois | 0.000 | Hawaii | 0.022 | Indiana | 0.000 |
| Hawaii | 0.000 | Indiana | 0.000 | Idaho | 0.000 | Iowa | 0.000 |
| Idaho | 0.149 | Iowa | 0.000 | Illinois | 0.000 | Kansas | 0.000 |
| Illinois | 0.000 | Kansas | 0.000 | Indiana | 0.000 | Kentucky | 0.015 |
| Indiana | 0.000 | Kentucky | 0.000 | Iowa | 0.000 | Louisiana | 0.000 |
| Iowa | 0.000 | Louisiana | 0.000 | Kansas | 0.000 | Maine | 0.000 |
| Kansas | 0.000 | Maryland | 0.051 | Kentucky | 0.000 | Maryland | 0.000 |
| Kentucky | 0.000 | Massachusetts | 0.000 | Louisiana | 0.188 | Massachusetts | 0.000 |
| Louisiana | 0.046 | Michigan | 0.000 | Maine | 0.000 | Michigan | 0.000 |
| Maine | 0.000 | Minnesota | 0.000 | Maryland | 0.000 | Minnesota | 0.000 |
| Maryland | 0.000 | Missouri | 0.000 | Massachusetts | 0.000 | Missouri | 0.000 |
| Massachusetts | 0.000 | Montana | 0.000 | Michigan | 0.000 | Montana | 0.000 |
| Michigan | 0.000 | Nebraska | 0.000 | Minnesota | 0.000 | Nebraska | 0.000 |
| Minnesota | 0.000 | Nevada | 0.127 | Missouri | 0.000 | Nevada | 0.113 |
| Missouri | 0.000 | New Hampshire | 0.000 | Montana | 0.000 | New | 0.000 |
| Hampshire | |||||||
| Montana | 0.000 | New Jersey | 0.000 | Nebraska | 0.000 | New Jersey | 0.000 |
| Nebraska | 0.000 | New Mexico | 0.000 | Nevada | 0.143 | New Mexico | 0.000 |
| Nevada | 0.126 | New York | 0.000 | New Hampshire | 0.000 | New York | 0.000 |
| New Hampshire | 0.000 | Ohio | 0.000 | New Jersey | 0.000 | North Dakota | 0.000 |
| New Jersey | 0.000 | Oklahoma | 0.000 | New Mexico | 0.000 | Ohio | 0.000 |
| New Mexico | 0.000 | Oregon | 0.000 | New York | 0.000 | Oklahoma | 0.000 |
| New York | 0.000 | Pennsylvania | 0.000 | North Dakota | 0.000 | Oregon | 0.002 |
| North Dakota | 0.000 | Rhode Island | 0.000 | Ohio | 0.000 | Pennsylvania | 0.000 |
| Ohio | 0.000 | South Dakota | 0.104 | Oklahoma | 0.000 | Tennessee | 0.000 |
| Oklahoma | 0.000 | Tennessee | 0.000 | Oregon | 0.000 | Texas | 0.166 |
| Oregon | 0.000 | Texas | 0.392 | Pennsylvania | 0.000 | Virginia | 0.063 |
| Pennsylvania | 0.000 | Virginia | 0.000 | Rhode Island | 0.000 | Washington | 0.000 |
| Rhode Island | 0.000 | Washington | 0.001 | South Dakota | 0.089 | West Virginia | 0.000 |
| South Dakota | 0.000 | West Virginia | 0.000 | Tennessee | 0.000 | Wisconsin | 0.000 |
| Tennessee | 0.000 | Wisconsin | 0.000 | Texas | 0.205 | ||
| Texas | 0.000 | Vermont | 0.000 | ||||
| Vermont | 0.000 | Virginia | 0.109 | ||||
| Virginia | 0.000 | Washington | 0.000 | ||||
| Washington | 0.000 | West Virginia | 0.000 | ||||
| West Virginia | 0.000 | Wisconsin | 0.000 | ||||
| Wisconsin | 0.000 | ||||||
| Wyoming | 0.000 | ||||||
Table A6
Weights used in construction of synthetic Arizona for household service sector analysis in Table 5
| Donor states | Hourly wage | Native supply | Native male | Native female | Immigrant supply | Immigrant male | Immigrant female | Overall supply |
|---|---|---|---|---|---|---|---|---|
| Alaska | 0.000 | 0.000 | 0.000 | 0.000 | 0.000 | 0.000 | 0.000 | 0.000 |
| Arkansas | 0.000 | 0.000 | 0.000 | 0.000 | 0.000 | 0.000 | 0.000 | 0.000 |
| California | 0.000 | 0.064 | 0.000 | 0.056 | 0.000 | 0.015 | 0.000 | 0.000 |
| Colorado | 0.102 | 0.386 | 0.000 | 0.000 | 0.000 | 0.000 | 0.057 | 0.411 |
| Connecticut | 0.000 | 0.000 | 0.000 | 0.000 | 0.000 | 0.000 | 0.000 | 0.000 |
| Delaware | 0.000 | 0.000 | 0.000 | 0.000 | 0.000 | 0.000 | 0.000 | 0.000 |
| District of | 0.000 | 0.000 | 0.000 | 0.001 | 0.000 | 0.000 | 0.000 | 0.000 |
| Columbia | ||||||||
| Florida | 0.282 | 0.000 | 0.000 | 0.000 | 0.000 | 0.000 | 0.020 | 0.000 |
| Hawaii | 0.000 | 0.031 | 0.000 | 0.030 | 0.000 | 0.000 | 0.000 | 0.000 |
| Idaho | 0.044 | 0.000 | 0.000 | 0.000 | 0.110 | 0.000 | 0.000 | 0.011 |
| Illinois | 0.000 | 0.000 | 0.000 | 0.000 | 0.042 | 0.058 | 0.000 | 0.000 |
| Indiana | 0.000 | 0.000 | 0.000 | 0.000 | 0.000 | 0.000 | 0.000 | 0.000 |
| Iowa | 0.000 | 0.000 | 0.000 | 0.000 | 0.000 | 0.000 | 0.000 | 0.000 |
| Kansas | 0.000 | 0.000 | 0.000 | 0.174 | 0.000 | 0.000 | 0.000 | 0.000 |
| Kentucky | 0.032 | 0.000 | 0.000 | 0.000 | 0.000 | 0.000 | 0.000 | 0.000 |
| Louisiana | 0.000 | 0.000 | 0.000 | 0.000 | 0.000 | 0.000 | 0.000 | 0.000 |
| Maine | 0.000 | 0.000 | 0.000 | 0.000 | 0.000 | 0.000 | 0.000 | 0.000 |
| Maryland | 0.038 | 0.000 | 0.000 | 0.000 | 0.000 | 0.000 | 0.000 | 0.000 |
| Massachusetts | 0.000 | 0.000 | 0.000 | 0.084 | 0.000 | 0.000 | 0.000 | 0.000 |
| Michigan | 0.000 | 0.000 | 0.000 | 0.000 | 0.210 | 0.000 | 0.000 | 0.000 |
| Minnesota | 0.000 | 0.000 | 0.025 | 0.000 | 0.000 | 0.000 | 0.000 | 0.000 |
| Missouri | 0.000 | 0.000 | 0.000 | 0.000 | 0.000 | 0.000 | 0.000 | 0.000 |
| Montana | 0.099 | 0.000 | 0.000 | 0.059 | 0.000 | 0.000 | 0.000 | 0.000 |
| Nebraska | 0.000 | 0.000 | 0.000 | 0.000 | 0.000 | 0.000 | 0.000 | 0.000 |
| Nevada | 0.000 | 0.230 | 0.377 | 0.433 | 0.000 | 0.000 | 0.137 | 0.170 |
| New Hampshire | 0.000 | 0.019 | 0.000 | 0.000 | 0.000 | 0.000 | 0.000 | 0.000 |
| New Jersey | 0.000 | 0.000 | 0.092 | 0.000 | 0.443 | 0.000 | 0.000 | 0.208 |
| New Mexico | 0.000 | 0.231 | 0.000 | 0.000 | 0.000 | 0.000 | 0.336 | 0.074 |
| New York | 0.000 | 0.000 | 0.000 | 0.000 | 0.000 | 0.000 | 0.017 | 0.000 |
| North Dakota | 0.000 | 0.000 | 0.000 | 0.000 | 0.000 | 0.000 | 0.000 | 0.000 |
| Ohio | 0.000 | 0.000 | 0.000 | 0.000 | 0.000 | 0.000 | 0.000 | 0.000 |
| Oklahoma | 0.000 | 0.000 | 0.436 | 0.000 | 0.000 | 0.000 | 0.000 | 0.000 |
| Oregon | 0.000 | 0.000 | 0.000 | 0.000 | 0.000 | 0.000 | 0.086 | 0.000 |
| Pennsylvania | 0.000 | 0.004 | 0.000 | 0.000 | 0.000 | 0.000 | 0.000 | 0.000 |
| Rhode Island | 0.000 | 0.000 | 0.000 | 0.000 | 0.000 | 0.000 | 0.000 | 0.000 |
| South Dakota | 0.000 | 0.000 | 0.000 | 0.000 | 0.000 | 0.000 | 0.000 | 0.000 |
| Tennessee | 0.000 | 0.000 | 0.000 | 0.159 | 0.000 | 0.000 | 0.000 | 0.000 |
| Texas | 0.404 | 0.000 | 0.070 | 0.004 | 0.160 | 0.341 | 0.106 | 0.099 |
| Vermont | 0.000 | 0.000 | 0.000 | 0.000 | 0.000 | 0.000 | 0.000 | 0.000 |
| Virginia | 0.000 | 0.000 | 0.000 | 0.000 | 0.000 | 0.585 | 0.219 | 0.000 |
| Washington | 0.000 | 0.000 | 0.000 | 0.000 | 0.036 | 0.000 | 0.000 | 0.000 |
| West Virginia | 0.000 | 0.035 | 0.000 | 0.000 | 0.000 | 0.000 | 0.021 | 0.026 |
| Wisconsin | 0.000 | 0.000 | 0.000 | 0.000 | 0.000 | 0.000 | 0.000 | 0.000 |
| Wyoming | 0.000 | 0.000 | 0.000 | 0.000 | 0.000 | 0.000 | 0.000 | 0.000 |
Table A7
Weights used in construction of synthetic Arizona for occupation income score analysis in Table 6
| Donor states | Occupation income score | Employment rate | ||
|---|---|---|---|---|
| Native male | Native female | Native male | Native female | |
| Alaska | 0.000 | 0.000 | 0.000 | 0.000 |
| Arkansas | 0.000 | 0.000 | 0.000 | 0.000 |
| California | 0.000 | 0.099 | 0.338 | 0.000 |
| Colorado | 0.199 | 0.211 | 0.000 | 0.621 |
| Connecticut | 0.000 | 0.000 | 0.000 | 0.000 |
| Delaware | 0.000 | 0.175 | 0.027 | 0.000 |
| District of Columbia | 0.000 | 0.009 | 0.000 | 0.000 |
| Florida | 0.000 | 0.402 | 0.000 | 0.000 |
| Hawaii | 0.000 | 0.000 | 0.000 | 0.000 |
| Idaho | 0.000 | 0.000 | 0.000 | 0.000 |
| Illinois | 0.000 | 0.000 | 0.000 | 0.000 |
| Indiana | 0.000 | 0.000 | 0.000 | 0.000 |
| Iowa | 0.000 | 0.000 | 0.000 | 0.000 |
| Kansas | 0.000 | 0.000 | 0.000 | 0.000 |
| Kentucky | 0.000 | 0.000 | 0.000 | 0.000 |
| Louisiana | 0.219 | 0.000 | 0.000 | 0.000 |
| Maine | 0.000 | 0.000 | 0.000 | 0.000 |
| Maryland | 0.184 | 0.024 | 0.007 | 0.000 |
| Massachusetts | 0.000 | 0.000 | 0.000 | 0.000 |
| Michigan | 0.000 | 0.000 | 0.000 | 0.000 |
| Minnesota | 0.000 | 0.000 | 0.000 | 0.000 |
| Missouri | 0.000 | 0.000 | 0.000 | 0.000 |
| Montana | 0.000 | 0.000 | 0.198 | 0.000 |
| Nebraska | 0.000 | 0.000 | 0.000 | 0.000 |
| Nevada | 0.146 | 0.000 | 0.087 | 0.052 |
| New Hampshire | 0.218 | 0.000 | 0.000 | 0.000 |
| New Jersey | 0.000 | 0.000 | 0.000 | 0.000 |
| New Mexico | 0.020 | 0.000 | 0.000 | 0.000 |
| New York | 0.000 | 0.000 | 0.000 | 0.000 |
| North Dakota | 0.000 | 0.000 | 0.000 | 0.000 |
| Ohio | 0.000 | 0.000 | 0.000 | 0.000 |
| Oklahoma | 0.000 | 0.000 | 0.000 | 0.000 |
| Oregon | 0.000 | 0.000 | 0.000 | 0.000 |
| Pennsylvania | 0.000 | 0.000 | 0.000 | 0.000 |
| Rhode Island | 0.000 | 0.000 | 0.000 | 0.000 |
| South Dakota | 0.000 | 0.000 | 0.000 | 0.000 |
| Tennessee | 0.000 | 0.000 | 0.000 | 0.000 |
| Texas | 0.000 | 0.081 | 0.110 | 0.000 |
| Vermont | 0.000 | 0.000 | 0.000 | 0.000 |
| Virginia | 0.014 | 0.000 | 0.000 | 0.000 |
| Washington | 0.000 | 0.000 | 0.044 | 0.030 |
| West Virginia | 0.000 | 0.000 | 0.188 | 0.297 |
| Wisconsin | 0.000 | 0.000 | 0.000 | 0.000 |
| Wyoming | 0.000 | 0.000 | 0.000 | 0.000 |