
Table 1
Descriptive Statistics
| Mean | Standard deviation | |
|---|---|---|
| (1) | (2) | |
| Panel A: Demographic characteristics | ||
| Age | 27.94 | 9.16 |
| Age 15-19 | 0.22 | 0.41 |
| Age 20-24 | 0.21 | 0.41 |
| Age 25-29 | 0.18 | 0.39 |
| Age 30-34 | 0.14 | 0.35 |
| Age 35-39 | 0.11 | 0.31 |
| Age 40-44 | 0.08 | 0.28 |
| Age 45-49 | 0.06 | 0.24 |
| Married | 0.60 | 0.49 |
| Primary school completion | 0.52 | 0.50 |
| Secondary school completion | 0.12 | 0.32 |
| Panel B: Employment outcomes | ||
| Employed in transactional sex | 0.03 | 0.16 |
| Employed outside of transactional sex | 0.60 | 0.49 |
| Employed in agriculture | 0.36 | 0.48 |
| Employed in sales | 0.15 | 0.35 |
| Employed in crafts | 0.02 | 0.14 |
| Employed in protective services | 0.02 | 0.13 |
| Employed, other | 0.06 | 0.25 |
| Observations | 8,359 |
[i] Notes: Standard deviations are in parentheses. All variables except “Age” are indicator variables.
*** Significant at the 1 percent level, ** Significant at the 5 percent level, * Significant at the 10 percent level.
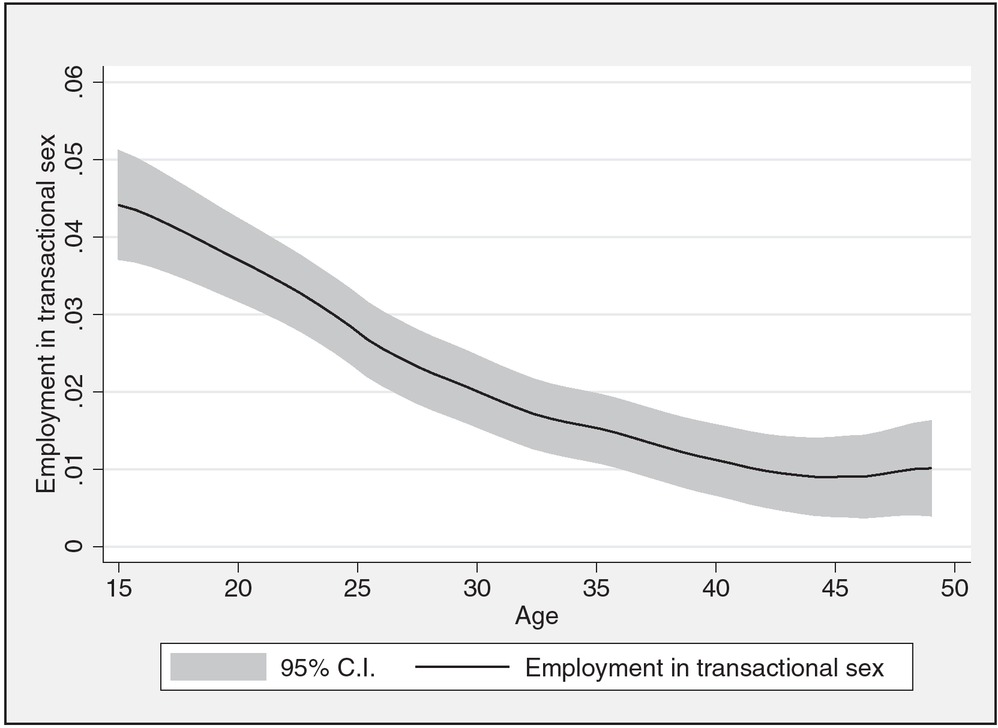
Figure 1
Employment in Transactional Sex and Age
Table 2
Employment-Age Profiles, Employment in Transactional Sex
| Dependent variable: | Employed in transactional sex (Yes=100, No=0) | |||||
|---|---|---|---|---|---|---|
| (1) | (2) | (3) | (4) | (5) | (6) | |
| Age | -0.140*** | -0.136*** | -0.137*** | |||
| (0.023) | (0.022) | (0.023) | ||||
| Age 20-24 | -1.470* | -1.387* | -1.294* | |||
| (0.813) | (0.754) | (0.743) | ||||
| Age 25-29 | -3.116*** | -2.824*** | -2.787*** | |||
| (0.746) | (0.678) | (0.674) | ||||
| Age 30-34 | -3.063*** | -2.909*** | -2.879*** | |||
| (0.758) | (0.716) | (0.715) | ||||
| Age 35-39 | -3.766*** | -3.407*** | -3.416*** | |||
| (0.804) | (0.739) | (0.741) | ||||
| Age 40-44 | -3.874*** | -3.835*** | -3.833*** | |||
| (0.798) | (0.766) | (0.774) | ||||
| Age 45-49 | -3.919*** | -3.795*** | -3.765*** | |||
| (0.861) | (0.789) | (0.789) | ||||
| District and survey year/month fixed effects | NO | YES | YES | NO | YES | YES |
| Individual-level controls | NO | NO | YES | NO | NO | YES |
| Observations | 8,359 | 8,359 | 8,359 | 8,359 | 8,359 | 8,359 |
[i] Notes: Parameters estimated using ordinary least squares (OLS) regression. Robust standard errors are in parentheses. “Employed in transactional sex” is an indicator variable equal to 100 if the respondent reported exchanged sex for money in the past twelve months and 0 otherwise. In Columns (4)-(6), excluded age category is “Age 15-19”. Individual-level controls are indicator variables for primary school completion and secondary school completion.
*** Significant at the 1 percent level, ** Significant at the 5 percent level, * Significant at the 10 percent level.
Table 3
Possible Mechanisms Underlying Transactional Sex Employment-Age Profiles
| Dependent variable: | Employed in transactional sex (Yes=100, No=0) | |||||
|---|---|---|---|---|---|---|
| (1) | (2) | (3) | (4) | (5) | (6) | |
| Age | -0.138*** | -0.081*** | -0.086*** | |||
| (0.023) | (0.019) | (0.020) | ||||
| Age 20-24 | -1.379* | 0.205 | 0.105 | |||
| (0.758) | (0.727) | (0.728) | ||||
| Age 25-29 | -2.906*** | -0.903 | -1.044 | |||
| (0.707) | (0.626) | (0.638) | ||||
| Age 30-34 | -3.001*** | -0.923 | -1.066 | |||
| (0.725) | (0.708) | (0.691) | ||||
| Age 35-39 | -3.551*** | -1.550** | -1.710** | |||
| (0.791) | (0.637) | (0.671) | ||||
| Age 40-44 | -3.976*** | -2.112*** | -2.281*** | |||
| (0.798) | (0.682) | (0.687) | ||||
| Age 45-49 | -3.899*** | -2.080*** | -2.238*** | |||
| (0.828) | (0.701) | (0.728) | ||||
| Employed outside | 0.001 | 0.004 | 0.003 | 0.003 | ||
| of transactional sex | (0.003) | (0.004) | (0.003) | (0.004) | ||
| Married | -3.489*** | -3.518*** | -3.554*** | -3.560*** | ||
| (0.819) | (0.834) | (0.858) | (0.863) | |||
| District and survey year/month fixed effects | YES | YES | YES | YES | YES | YES |
| Additional individual-level controls | YES | YES | YES | YES | YES | YES |
| Observations | 8,359 | 8,359 | 8,359 | 8,359 | 8,359 | 8,359 |
[i] Notes: Parameters estimated using ordinary least squares (OLS) regression. Robust standard errors are in parentheses. “Employed in (outside of) transactional sex” is an indicator variable equal to 100 if the respondent reported employment in (outside of) transactional sex and 0 otherwise. In Columns (4)-(6), excluded age category is “Age 15-19”. Additional individual-level controls are indicator variables for primary school completion and secondary school completion.
*** Significant at the 1 percent level, ** Significant at the 5 percent level, * Significant at the 10 percent level.
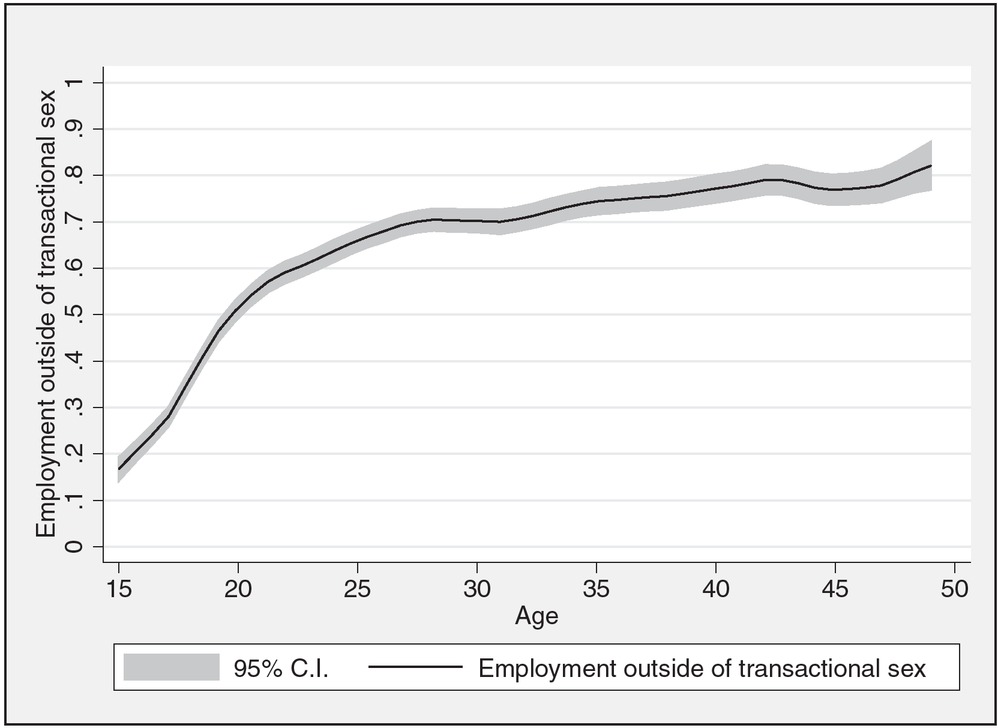
Figure 2
Employment Outside of Transactional Sex and Age
Table 4
Employment-Age Profiles, Employment Outside of Transactional Sex
| Dependent variable: | Employed (Yes=100, No=0): | |||||||||||
|---|---|---|---|---|---|---|---|---|---|---|---|---|
| Outside of transactional sex | Agriculture | Sales | Crafts | Protective services | Other | Outside of transactional sex | Agriculture | Sales | Crafts | Protective services | Other | |
| (1) | (2) | (3) | (4) | (5) | (6) | (7) | (8) | (9) | (10) | (11) | (12) | |
| Age | 1.529*** | 0.584*** | 0.496*** | 0.083*** | 0.035* | 0.331*** | ||||||
| (0.122) | (0.073) | (0.101) | -0.02 | (0.0180) | (0.065) | |||||||
| Age 20-24 | 28.636*** | 12.083*** | 11.204*** | 1.287*** | 1.742*** | 2.319*** | ||||||
| (1.716) | (1.958) | (1.743) | (0.433) | (0.466) | (0.869) | |||||||
| Age 25-29 | 40.145*** | 13.553*** | 16.029*** | 2.027*** | 1.742*** | 6.794*** | ||||||
| (2.726) | (2.229) | (2.618) | (0.423) | (0.607) | (1.188) | |||||||
| Age 30-34 | 41.089*** | 13.598*** | 14.849*** | 2.467*** | 2.422*** | 7.754*** | ||||||
| (3.216) | (2.179) | (2.734) | (0.623) | (0.631) | (1.645) | |||||||
| Age 35-39 | 45.576*** | 14.079*** | 17.825*** | 2.385*** | 1.351** | 9.937*** | ||||||
| (3.197) | (2.303) | (2.784) | (0.586) | (0.527) | (1.815) | |||||||
| Age 40-44 | 48.366*** | 20.192*** | 17.745*** | 1.815*** | 1.448*** | 7.165*** | ||||||
| (3.826) | (2.804) | (3.729) | (0.624) | (0.538) | (1.822) | |||||||
| Age 45-49 | 45.371*** | 18.837*** | 12.946*** | 3.091*** | 1.657** | 8.839*** | ||||||
| (2.695) | (2.903) | (2.654) | (0.837) | (0.768) | (1.528) | |||||||
| District and survey year/ month fixed effects | YES | YES | YES | YES | YES | YES | YES | YES | YES | YES | YES | YES |
| Individual-level controls | YES | YES | YES | YES | YES | YES | YES | YES | YES | YES | YES | YES |
| Observations | 8,359 | 8,359 | 8,359 | 8,359 | 8,359 | 8,359 | 8,359 | 8,359 | 8,359 | 8,359 | 8,359 | 8,359 |
[i] Notes: Parameters estimated using ordinary least squares (OLS) regression. Robust standard errors are in parentheses. "Outside of transactional sex" is an indicator variable equal to 100 if the respondent reported employment outside of transactional sex and 0 otherwise. "Agriculture", "Sales", etc. defined similarly. "Other" refers to other occupation outside of transactional sex. In Columns (7)-(12), excluded age category is "Age 15-19". Individual-level controls are indicator variablesfor married, primary school completion, and secondary school completion,
*** Significant at the 1 percent level, ** Significant at the ; 5 percent level, * Significant at the 10 percent level.