
Figure 1
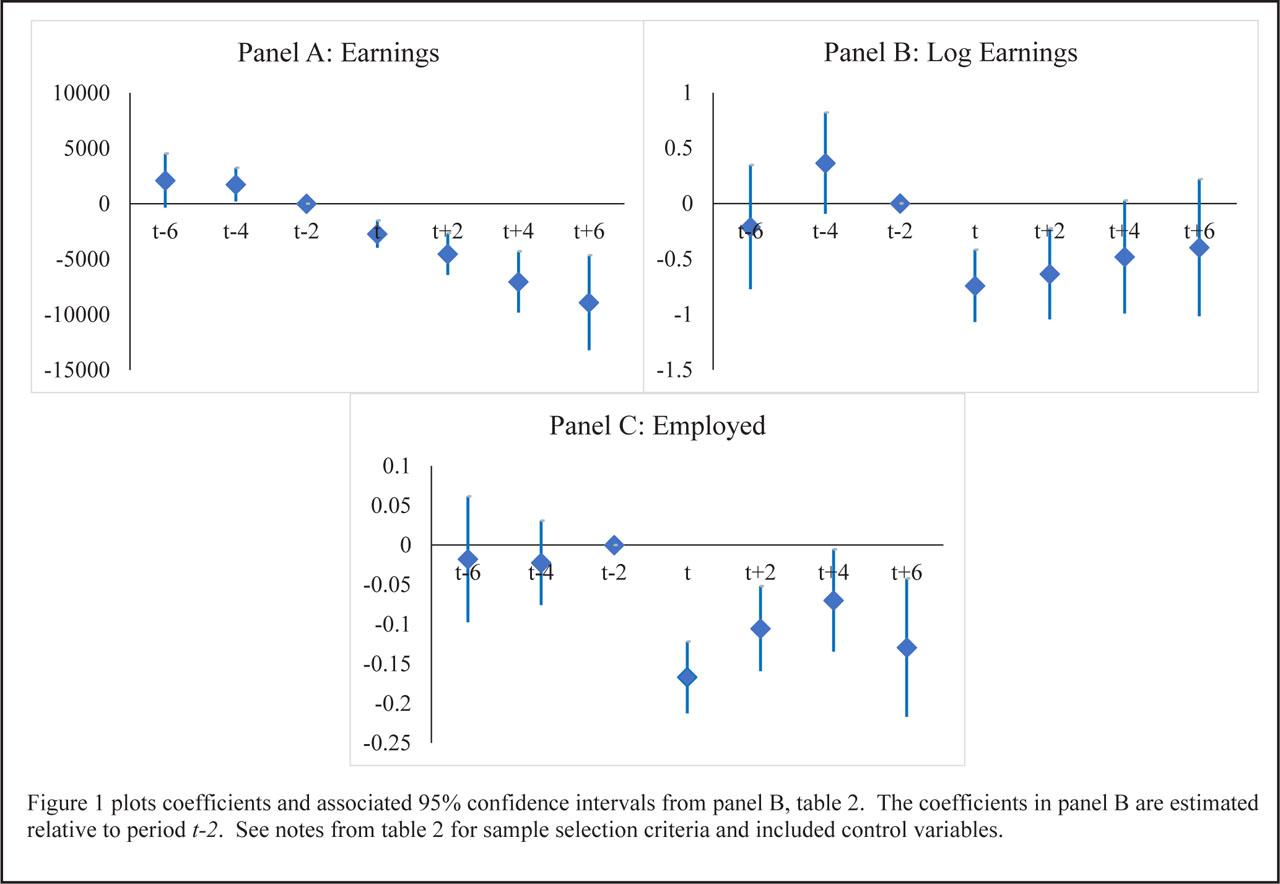
Figure 2
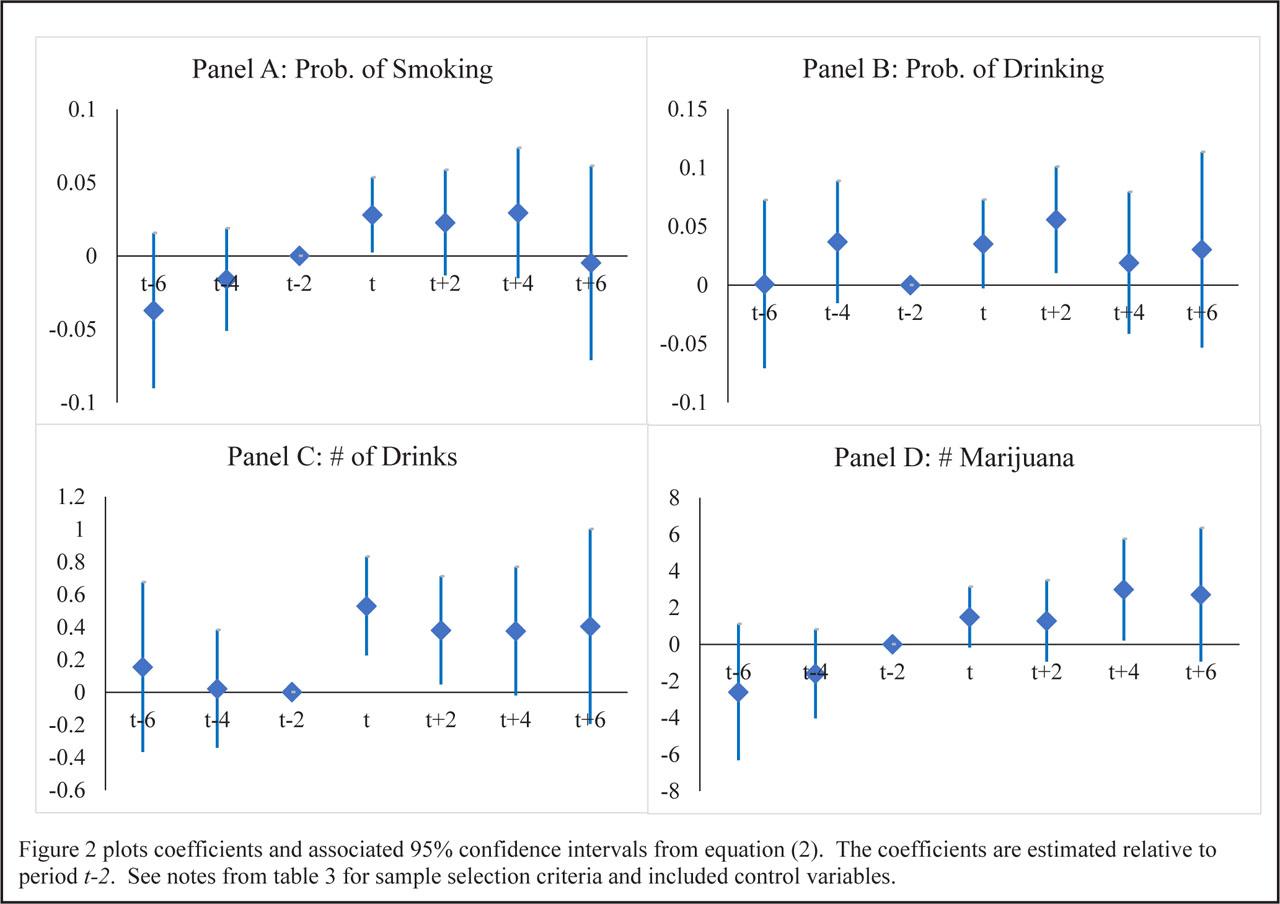
Figure H-1
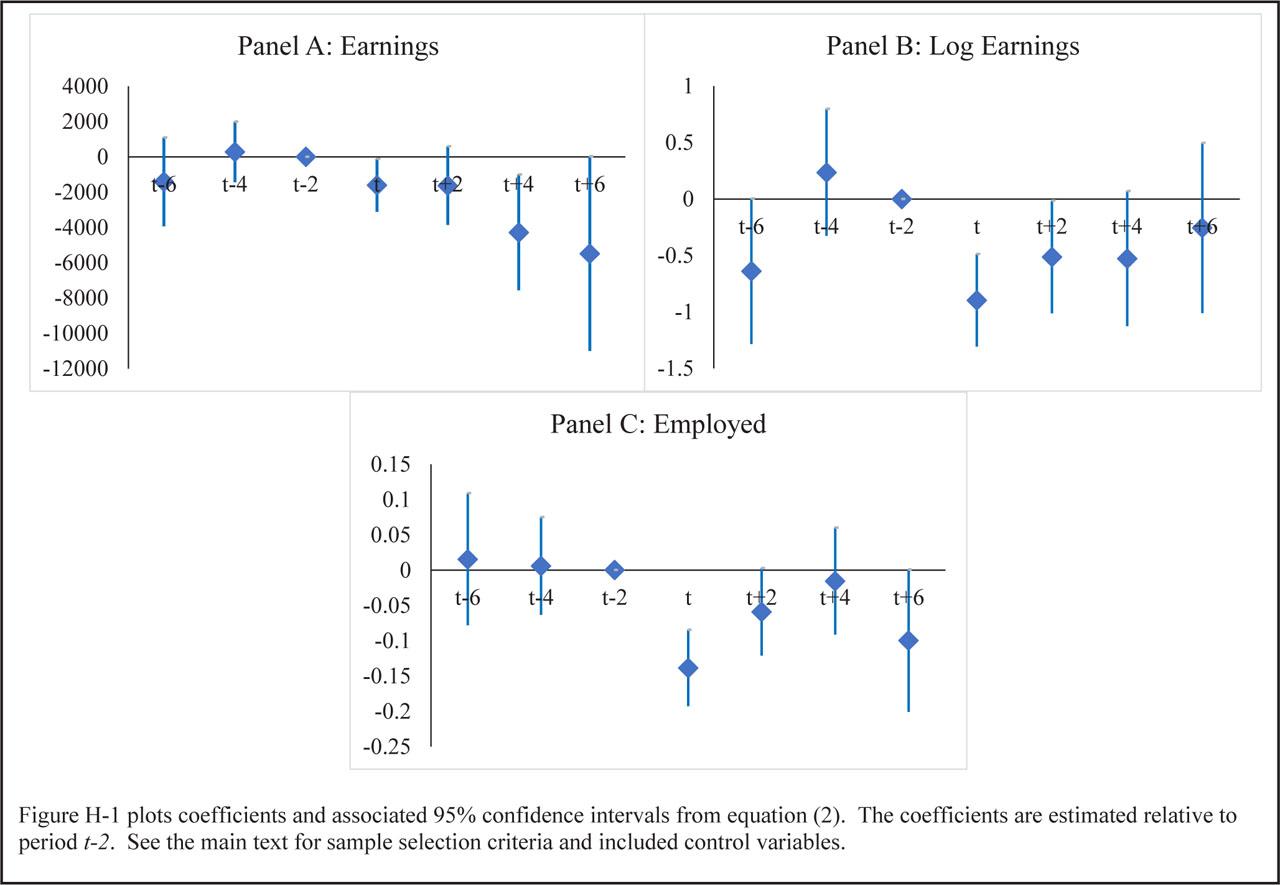
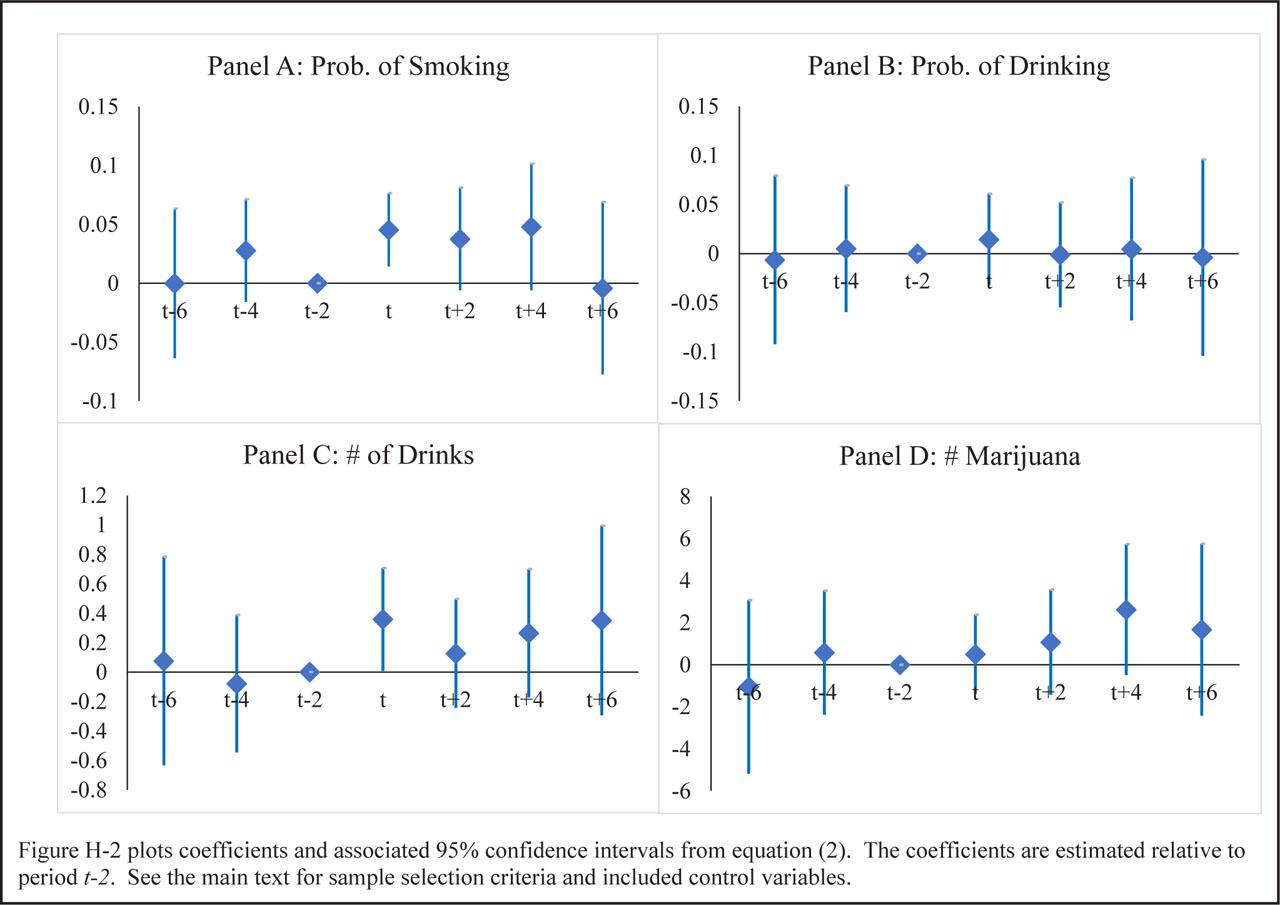
Figure H-2
Heterogeneity by Race
| Panel A: Labor Market Outcomes | |||||
| Log Earnings | Real Earnings | Employed | |||
| Non-White | −0.504 (0.334) | −6,288.925*** (1,392.415) | −0.145*** (0.052) | ||
| White | −0.050 (0.406) | 546.915 (2510.808) | −0.125** (0.058) | ||
| R2 | 0.18 | 0.17 | 0.09 | ||
| N | 6,501 | 8,416 | 8,416 | ||
| # Individuals | 2,296 | 2,461 | 2,461 | ||
| Sig. Different | No | 5% | No | ||
| Panel B: Substance Use at Extensive Margin | |||||
| Currently Smokes | Currently Drinks | Ever Used Marijuana | Ever Used Other Drugs | Ever Used Pain Relievers/Narcotics | |
| Non-White | 0.038 (0.030) | 0.048 (0.041) | −0.049 (0.040) | −0.018 (0.031) | −0.082 (0.085) |
| White | −0.060 (0.037) | 0.048 (0.047) | −0.034 (0.041) | −0.041 (0.038) | 0.060 (0.129) |
| R2 | 0.00 | 0.11 | 0.07 | 0.02 | 0.06 |
| N | 8,398 | 8,390 | 8,369 | 8,369 | 3,906 |
| # Individuals | 2,461 | 2,461 | 2,461 | 2,461 | 1,778 |
| Sig. Different | 5% | No | No | No | No |
| Panel C: Substance Use at Intensive Margin | |||||
| # Cigarettes Smoked Per Day | Drinks Several Times per Month | # Drinks per Session | # Times Used Marijuana in Past 12 Months | # Times Used Pain Relievers Past 12 Months | |
| Non-White | −0.013 (1.351) | −0.012 (0.067) | 0.468 (0.325) | 5.123** (2.483) | −5.342 (4.714) |
| White | 0.223 (1.032) | −0.039 (0.063) | −0.294 (0.318) | −2.184 (1.988) | −5.776** (2.575) |
| R2 | 0.03 | 0.06 | 0.04 | 0.03 | 0.04 |
| N | 1,152 | 5,359 | 5,315 | 3,988 | 1,221 |
| # Individuals | 530 | 2,009 | 2,002 | 1,579 | 860 |
| Sig. Different | No | No | 10% | 5% | No |
Heterogeneity - Relative Differences
| # Cigarettes | # Drinks | Marijuana | Pain Relievers | |
|---|---|---|---|---|
| Panel A: Gender | ||||
| Men | −0.058 (0.206) | 0.306*** (0.100) | 0.431 (0.349) | −0.089 (0.638) |
| Women | −0.076 (0.145) | 0.106* (0.062) | 0.332 (0.507) | −0.645 (0.475) |
| R2 | 0.04 | 0.02 | 0.04 | 0.06 |
| N | 1,263 | 4,730 | 2,773 | 318 |
| # Individuals | 458 | 1,496 | 896 | 211 |
| Sig. Different | No | 10% | No | No |
| Panel B: Race | ||||
| Non-White | −0.064 (0.147) | 0.296*** (0.081) | 0.154 (0.311) | −0.285 (0.423) |
| White | −0.063 (0.231) | 0.117 (0.091) | 0.735 (0.559) | −0.777 (0.718) |
| R2 | 0.04 | 0.02 | 0.04 | 0.06 |
| N | 1,259 | 4,726 | 2,773 | 318 |
| # Individuals | 457 | 1,495 | 896 | 211 |
| Sig. Different | No | No | No | No |
| Panel C: Living Arrangements | ||||
| With Others | 0.104 (0.220) | 0.212*** (0.071) | 0.282 (0.365) | −0.422* (0.254) |
| On Own | −0.230 (0.152) | 0.216** (0.104) | 0.502 (0.461) | −0.478 (0.780) |
| R2 | 0.04 | 0.02 | 0.04 | 0.06 |
| N | 1,263 | 4,730 | 2,773 | 318 |
| # Individuals | 458 | 1,496 | 896 | 211 |
| Sig. Different | No | No | No | No |
The Effect of Substance Use on Employment
| Smoking | Drinking | Marijuana | Other Drugs | Pain Reliever | |
|---|---|---|---|---|---|
| Panel A: Non-users in t – 2 & Users in t = 0 | |||||
| After | −0.194** (0.084) | −0.088** (0.043) | −0.146** (0.057) | −0.118* (0.061) | −0.171 (0.106) |
| R2 | 0.09 | 0.09 | 0.09 | 0.09 | 0.02 |
| N | 7,962 | 8,325 | 8,100 | 8,056 | 3,809 |
| # Individuals | 2,345 | 2,443 | 2,376 | 2,370 | 1,729 |
| Panel B: Non-users in t – 2 & t = 0 | |||||
| After | −0.111*** (0.024) | −0.176*** (0.040) | −0.128*** (0.031) | −0.130*** (0.024) | −0.145** (0.057) |
| R2 | 0.09 | 0.09 | 0.09 | 0.09 | 0.02 |
| N | 9,857 | 8,512 | 8,869 | 9,855 | 4,031 |
| # Individuals | 2,806 | 2,474 | 2,557 | 2,808 | 1,815 |
Non-Random Attrition
| Employed | Current Smoke | Current Drink | Marijuana | Other Drug | Pain Reliever | |
|---|---|---|---|---|---|---|
| Attrite | 0.006 (0.010) | 0.008 (0.016) | −0.015 (0.012) | 0.002 (0.013) | 0.005 (0.014) | 0.000 (0.000) |
| R2 | 0.68 | 0.68 | 0.69 | 0.69 | 0.69 | 1.00 |
| N | 5,725 | 5,718 | 5,716 | 5,707 | 5,707 | 884 |
| # Individuals | 1,417 | 1,417 | 1,417 | 1,417 | 1,417 | 573 |
Heterogeneity by Living Arrangements
| Panel A: Labor Market Outcomes | |||||
| Log Earnings | Real Earnings | Employed | |||
| With Others | −0.838** (0.338) | −5,882.592*** (1,195.762) | −0.127*** (0.047) | ||
| On Own | 0.669* (0.385) | 201.614 (2794.817) | −0.153** (0.069) | ||
| R2 | 0.18 | 0.17 | 0.09 | ||
| N | 6,505 | 8,422 | 8,422 | ||
| # Individuals | 2,297 | 2,463 | 2,463 | ||
| Sig. Different | 1% | 5% | No | ||
| Panel B: Substance Use at Extensive Margin | |||||
| Currently Smokes | Currently Drinks | Ever Used Marijuana | Ever Used Other Drugs | Ever Used Pain Relievers/Narcotics | |
| With Others | 0.004 (0.028) | 0.053 (0.040) | −0.072** (0.034) | 0.003 (0.030) | 0.068 (0.101) |
| On Own | −0.001 (0.042) | 0.036 (0.049) | 0.012 (0.054) | −0.067* (0.040) | −0.161* (0.097) |
| R2 | 0.00 | 0.11 | 0.07 | 0.02 | 0.06 |
| N | 8,403 | 8,395 | 8,374 | 8,374 | 3,907 |
| # Individuals | 2,463 | 2,463 | 2,463 | 2,463 | 1,779 |
| Sig. Different | No | No | No | No | 10% |
| Panel C: Substance Use at Intensive Margin | |||||
| # Cigarettes Smoked Per Day | Drinks Several Times per Month | # Drinks per Session | # Times Used Marijuana in Past 12 Months | # Times Used Pain Relievers Past 12 Months | |
| With Others | 0.879 (1.199) | −0.067 (0.059) | 0.084 (0.268) | 1.696 (2.148) | −0.860 (1.539) |
| On Own | −1.190 (0.795) | 0.041 (0.068) | 0.225 (0.431) | 1.901 (2.649) | −13.398** (5.556) |
| R2 | 0.03 | 0.06 | 0.03 | 0.02 | 0.05 |
| N | 1,156 | 5,363 | 5,319 | 3,991 | 1,221 |
| # Individuals | 531 | 2,010 | 2,003 | 1,580 | 860 |
| Sig. Different | No | No | No | No | 5% |
Descriptive Statistics (means) of Selected Variables
| Non-Displaced (matched) | Displaced (matched) | |
|---|---|---|
| Total Earningsa,b | $3,094.56 | $2,214.53 |
| Hours Workedb | 18.43 | 21.14 |
| Employed | 54.13% | 55.35% |
| Age | 18.93 | 18.78 |
| Female | 53.59% | 50.20% |
| Whitec | 35.86% | 36.40% |
| Responsible for Own Household | 15.02% | 14.88% |
| Education | ||
| < High School | 13.86% | 13.69% |
| High School Degree/GED | 23.41% | 29.700% |
| Some College/Associates Degree | 61.14% | 56.38% |
| Bachelor's Degree | 1.36% | 0.23% |
| Master's Degree | 0.23% | - |
| Currently Smoke | 18.94% | 21.65% |
| Number Cigarettes/Day | 8.49 | 8.72 |
| Currently Drink Alcohol | 44.25% | 46.55% |
| Drink at Least Several Times/Month | 50.15% | 50.29% |
| Number Drinks/Session | 3.71 | 3.64 |
| Ever Used Marijuana | 43.55% | 46.07% |
| Number of Uses of Marijuana previous 12 Monthsd | 11.82 | 14.4 |
| Ever Used Amphetamines, Cocaine, Barbiturates, or Tranquilizers | 16.42% | 15.86% |
| Ever Used Pain Relievers/Narcotics | 27.93% | 34.43% |
| Number of Uses of Pain Relievers/Narcotics previous | 9.39 | 6.17 |
| 12 Monthsd | ||
| Total Number of Individuals | 739 | 739 |
Displacement's Effect on Labor Market Outcomes
| Earnings | Log Earnings | Employed | |
|---|---|---|---|
| After | −1,991.898*** (663.265) | −0.647*** (0.138) | −0.112*** (0.020) |
| R2 | 0.20 | 0.15 | 0.08 |
| N | 6,043 | 4,760 | 6,043 |
| # Individuals | 1,307 | 1,263 | 1,307 |
Displacement's Effect on Living Arrangements
| On Own | Transition | |
|---|---|---|
| After | −0.024 (0.015) | −0.017 (0.013) |
| R2 | 0.42 | 0.09 |
| N | 10,816 | 10,816 |
| # Individuals | 3,039 | 3,039 |
Sensitivity Analysis - Substance Use: Intensive Margin
| # Cigarettes Smoked per Day | Drinks Several Times per Month | # Drinks Consumed per Session | # Times Used Marijuana past 12 Months | # Times used Pain Relievers/Narcotics past 12 Months | |
|---|---|---|---|---|---|
| Panel A: Displaced from Main Job | |||||
| After | 1.503* (0.841) | −0.036 (0.046) | 0.785*** (0.230) | 1.287 (1.371) | −1.451 (2.836) |
| R2 | 0.03 | 0.05 | 0.03 | 0.02 | 0.04 |
| N | 1,721 | 6,883 | 6,825 | 5,320 | 1,419 |
| # Individuals | 748 | 2,516 | 2,509 | 2,019 | 978 |
| Panel B: Employed at Baseline Interview | |||||
| After | 0.412 (0.623) | −0.016 (0.035) | 0.560*** (0.172) | 1.396 (1.134) | −4.750 (3.226) |
| R2 | 0.05 | 0.05 | 0.03 | 0.03 | 0.05 |
| N | 918 | 3,790 | 3,762 | 2,868 | 765 |
| # Individuals | 411 | 1,432 | 1,429 | 1,111 | 545 |
| Panel C: Worked at Least 25 Hours per Week at Baseline Interview | |||||
| After | −0.084 (0.701) | 0.008 (0.039) | 0.669*** (0.210) | 0.652 (1.171) | −3.729 (2.969) |
| R2 | 0.03 | 0.03 | 0.04 | 0.02 | 0.13 |
| N | 758 | 2,805 | 2,785 | 2,186 | 417 |
| # Individuals | 310 | 885 | 887 | 714 | 286 |
| Panel D: Displaced Workers Present from t – 2 and t + 2 | |||||
| After | 0.589 (0.665) | −0.055* (0.031) | 0.454*** (0.151) | 0.824 (0.950) | −1.635 (2.576) |
| R2 | 0.03 | 0.05 | 0.03 | 0.02 | 0.04 |
| N | 1,539 | 6,362 | 6,307 | 4,883 | 1,315 |
| # Individuals | 665 | 2,299 | 2,292 | 1,834 | 901 |
Displacement's Effect on Attrition
| Attrite | |
|---|---|
| After | 0.008 (0.016) |
| R2 | 0.68 |
| N | 5,725 |
| # Individuals | 1,417 |
Sensitivity Analysis - Substance Use: Extensive Margin
| Currently Smokes | Currently Drinks | Ever Use Marijuana | Ever Use Other Drugs | Ever Use Pain Relievers | |
|---|---|---|---|---|---|
| Panel A: Displaced from Main Job | |||||
| After | 0.032 (0.022) | −0.020 (0.027) | −0.075*** (0.025) | −0.011 (0.021) | 0.065 (0.068) |
| R2 | 0.00 | 0.11 | 0.07 | 0.03 | 0.06 |
| N | 10,790 | 10,781 | 10,759 | 10,759 | 4,486 |
| # Individuals | 3,039 | 3,039 | 3,039 | 3,039 | 2,004 |
| Panel B: Employed at Baseline Interview | |||||
| After | 0.040** (0.017) | 0.025 (0.025) | −0.031 (0.020) | 0.014 (0.020) | 0.057 (0.046) |
| R2 | 0.00 | 0.09 | 0.06 | 0.03 | 0.06 |
| N | 5,767 | 5,763 | 5,758 | 5,758 | 2,523 |
| # Individuals | 1,695 | 1,695 | 1,695 | 1,695 | 1,147 |
| Panel C: Worked at Least 25 Hours per Week at Baseline Interview | |||||
| After | 0.049** (0.020) | 0.020 (0.026) | −0.012 (0.023) | 0.012 (0.024) | 0.032 (0.070) |
| R2 | 0.01 | 0.07 | 0.06 | 0.04 | 0.05 |
| N | 3,999 | 3,996 | 3,994 | 3,994 | 1,098 |
| # Individuals | 989 | 989 | 989 | 989 | 475 |
| Panel D: Displaced Workers Present between t – 2 and t + 2 | |||||
| After | 0.028* (0.015) | 0.019 (0.021) | −0.034** (0.017) | −0.001 (0.017) | 0.043 (0.055) |
| R2 | 0.00 | 0.11 | 0.06 | 0.03 | 0.06 |
| N | 9,979 | 9,970 | 9,950 | 9,950 | 4,132 |
| # Individuals | 2,787 | 2,787 | 2,787 | 2,787 | 1,849 |
Displacement's Effect on Substance Use - Declining Economic Activity
| Panel A: Extensive Margin | ||||
|---|---|---|---|---|
| Currently Smokes | Currently Drinks | Ever Use Marijuana | Ever Use Other Drugs | |
| After | 0.032 (0.027) | 0.052 (0.034) | 0.018 (0.029) | 0.040 (0.029) |
| R2 | 0.00 | 0.11 | 0.07 | 0.03 |
| N | 8,585 | 8,577 | 8,559 | 8,559 |
| # Individuals | 2,492 | 2,492 | 2,492 | 2,492 |
Sensitivity Analysis - Labor Market Outcomes
| Earnings | Log Earnings | Employed | |
|---|---|---|---|
| Panel A: Displaced Main Job | |||
| After | −6,673.086*** (849.543) | −0.863*** (0.245) | −0.406*** (0.033) |
| R2 | 0.17 | 0.16 | 0.10 |
| N | 10,816 | 8,460 | 10,816 |
| # Individuals | 3,039 | 2,863 | 3,039 |
| Panel B: Employed at Baseline | |||
| After | −4,616.058*** (949.157) | −0.860*** (0.196) | −0.141*** (0.022) |
| R2 | 0.23 | 0.14 | 0.12 |
| N | 5,781 | 4,914 | 5,781 |
| # Individuals | 1,695 | 1,655 | 1,695 |
| Panel C: Works at Least 25 Hours at Baseline | |||
| After | −4,896.733*** (1,456.795) | −0.836*** (0.203) | −0.179*** (0.030) |
| R2 | 0.12 | 0.17 | 0.07 |
| N | 4,005 | 3,589 | 4,005 |
| # Individuals | 989 | 986 | 989 |
| Panel D: Displaced Workers Present between t–2 and t+2 | |||
| After | −4,993.206*** (848.074) | −0.886*** (0.167) | −0.117*** (0.024) |
| R2 | 0.17 | 0.17 | 0.08 |
| N | 10,004 | 7,802 | 10,004 |
| # Individuals | 2,787 | 2,617 | 2,787 |
Displacement's Effect on Substance Use
| Panel A: Substance Use at Extensive Margin | |||||
|---|---|---|---|---|---|
| Current Smokes | Current Drink | Ever Used Marijuana | Ever Used Other Drugs | Ever Used Pain Reliever/Narcotics | |
| After | 0.024* (0.013) | 0.020 (0.018) | 0.002 (0.015) | 0.024* (0.014) | −0.007 (0.030) |
| R2 | 0.00 | 0.10 | 0.05 | 0.02 | 0.07 |
| N | 6,034 | 6,028 | 6,015 | 6,015 | 1,883 |
| # Individuals | 1,307 | 1,307 | 1,307 | 1,307 | 695 |
Displacement's Effect on Substance Use by Type of Support – Extensive Margin
| Cigarettes | Alcohol | Marijuana | Other Drugs | Pain Relievers/Narcotics | |
|---|---|---|---|---|---|
| Panel A: Parental Support | |||||
| After | 0.045** (0.019) | 0.035 (0.023) | 0.016 (0.020) | 0.031 (0.019) | 0.054 (0.054) |
| R2 | 0.01 | 0.11 | 0.07 | 0.03 | 0.06 |
| N | 9,221 | 9,212 | 9,191 | 9,191 | 4,084 |
| # Individuals | 2,656 | 2,656 | 2,656 | 2,656 | 1,843 |
| Panel B: Government Support | |||||
| After | 0.084** (0.036) | −0.016 (0.048) | −0.043 (0.040) | 0.073* (0.038) | −0.068 (0.116) |
| R2 | 0.01 | 0.11 | 0.07 | 0.03 | 0.06 |
| N | 8,138 | 8,131 | 8,111 | 8,111 | 3,786 |
| # Individuals | 2,388 | 2,388 | 2,388 | 2,388 | 1,728 |
| Panel C: Own Support | |||||
| After | 0.030** (0.014) | 0.040** (0.020) | 0.006 (0.017) | 0.023 (0.016) | −0.018 (0.039) |
| R2 | 0.00 | 0.11 | 0.07 | 0.03 | 0.06 |
| N | 10,084 | 10,076 | 10,053 | 10,053 | 4,313 |
| # Individuals | 2,857 | 2,857 | 2,857 | 2,857 | 1,935 |
Heterogeneity by Gender
| Panel A: Labor Market Outcomes | |||||
| Log Earnings | Real | Employed | |||
| Men | −0.908** (0.368) | −3,174.104 (2,223.554) | −0.077 (0.055) | ||
| Women | 0.225 (0.354) | −4002.388*** (1513.980) | −0.184*** (0.054) | ||
| R2 | 0.18 | 0.17 | 0.09 | ||
| N | 6,505 | 8,422 | 8,422 | ||
| # Individuals | 2,297 | 2,463 | 2,463 | ||
| Sig. Different | 5% | No | No | ||
| Panel B: Substance Use at Extensive Margin | |||||
| Currently Smokes | Currently Drinks | Ever Used Marijuana | Ever Used Other Drugs | Ever Used Pain Relievers/Narcotics | |
| Men | −0.001 (0.036) | 0.008 (0.041) | −0.061 (0.039) | −0.022 (0.041) | 0.047 (0.099) |
| Women | 0.004 (0.031) | 0.078* (0.045) | −0.024 (0.042) | −0.024 (0.028) | −0.099 (0.098) |
| R2 | 0.00 | 0.11 | 0.07 | 0.02 | 0.06 |
| N | 8,403 | 8,395 | 8,374 | 8,374 | 3,907 |
| # Individuals | 2,463 | 2,463 | 2,463 | 2,463 | 1,779 |
| Sig. Different | No | No | No | No | No |
| Panel C: Substance Use at Intensive Margin | |||||
| # Cigarettes Smoked Per Day | Drinks Several Times per Month | # Drinks per Session | # Times Used Marijuana in Past 12 Months | # Times Used Pain Relievers Past 12 Months | |
| Men | 0.667 (1.294) | −0.054 (0.064) | 0.624* (0.365) | 2.149 (2.545) | −7.610** (3.573) |
| Women | −0.743 (0.807) | 0.002 (0.065) | −0.347 (0.265) | 1.382 (2.152) | −4.688 (3.749) |
| R2 | 0.03 | 0.06 | 0.04 | 0.02 | 0.04 |
| N | 1,156 | 5,363 | 5,319 | 3,991 | 1,221 |
| # Individuals | 531 | 2,010 | 2,003 | 1,580 | 860 |
| Sig. Different | No | No | 5% | No | No |
Displacement's Effect on Substance Use by Type of Support – Intensive Margin
| # Cigarettes | Drinks Several Times per Month | # Drinks per Session | # Times Used Marijuana in Previous 12 Months | # Times Used Pain Relievers in Previous 12 Months | |
|---|---|---|---|---|---|
| Panel A: Parental Support | |||||
| After | 0.614 (0.834) | −0.067* (0.035) | 0.214 (0.152) | 3.147*** (1.129) | −1.313 (2.667) |
| R2 | 0.03 | 0.05 | 0.04 | 0.03 | 0.04 |
| N | 1,359 | 5,958 | 5,908 | 4,544 | 1,291 |
| # Individuals | 608 | 2,190 | 2,184 | 1,749 | 894 |
| Panel B: Government Support | |||||
| After | 0.539 (1.009) | 0.066 (0.060) | 0.679** (0.334) | 2.389 (1.615) | −3.034 (2.231) |
| R2 | 0.03 | 0.06 | 0.03 | 0.02 | 0.05 |
| N | 1,097 | 5,181 | 5,135 | 3,877 | 1,180 |
| # Individuals | 506 | 1,941 | 1,934 | 1,543 | 829 |
| Panel C: Own Support | |||||
| After | 0.034 (0.636) | −0.036 (0.028) | 0.324** (0.135) | 2.324** (0.903) | −2.030 (2.136) |
| R2 | 0.02 | 0.05 | 0.03 | 0.03 | 0.04 |
| N | 1,503 | 6,508 | 6,455 | 4,937 | 1,363 |
| # Individuals | 661 | 2,368 | 2,362 | 1,882 | 939 |
Displacement's Effect on Labor Market Outcome - Heterogeneity
| Log Earnings | Real Earnings | Employed | |
|---|---|---|---|
| Panel A: Gender | |||
| Men | −0.816*** (0.184) | −2,988.339*** (983.679) | −0.108*** (0.028) |
| Women | −0.694*** (0.200) | −5573.236*** (867.409) | −0.161*** (0.028) |
| R2 | 0.16 | 0.17 | 0.08 |
| N | 8,460 | 10,816 | 10,816 |
| # Individuals | 2,863 | 3,039 | 3,039 |
| Sig. Different | No | 5% | No |
| Panel B: Race | |||
| Non-White | −0.946*** (0.178) | −5,958.624*** (785.528) | −0.151*** (0.025) |
| White | −0.492** (0.212) | −1481.940 (1177.504) | −0.108*** (0.031) |
| R2 | 0.17 | 0.17 | 0.08 |
| N | 8,453 | 10,807 | 10,807 |
| # Individuals | 2,861 | 3,036 | 3,036 |
| Sig. Different | 10% | 1% | No |
| Panel C: Living Arrangements | |||
| With Others | −0.984*** (0.184) | −5,054.904*** (795.454) | −0.086*** (0.026) |
| On Own | −0.506** (0.202) | −3360.716*** (1094.889) | −0.193*** (0.030) |
| R2 | 0.17 | 0.17 | 0.09 |
| N | 8,460 | 10,816 | 10,816 |
| # Individuals | 2,863 | 3,039 | 3,039 |
| Sig. Different | 10% | No | 1% |
Substance Use's Effect on Displacement
| Panel A: Extensive Margin | |||||
|---|---|---|---|---|---|
| Current Smoke | Current Drink | Ever Used Marijuana | Ever Used Other Drugs | Ever Used Pain Relievers/Narcotics | |
| Job Loss | 0.010 (0.022) | −0.012 (0.013) | 0.014 (0.014) | 0.009 (0.017) | −0.029 (0.026) |
| R2 | 0.01 | 0.01 | 0.01 | 0.01 | 0.00 |
| N | 7,768 | 7,761 | 7,755 | 7,755 | 2,510 |
| # Individuals | 3,038 | 3,037 | 3,038 | 3,038 | 1,793 |