
Figure 1
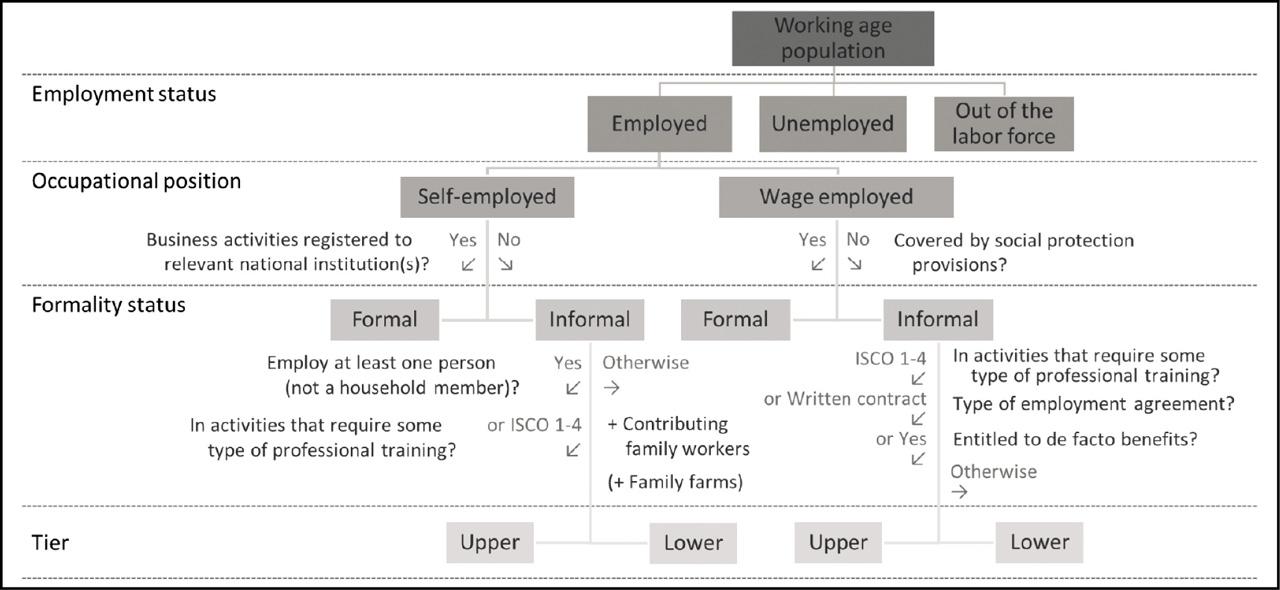
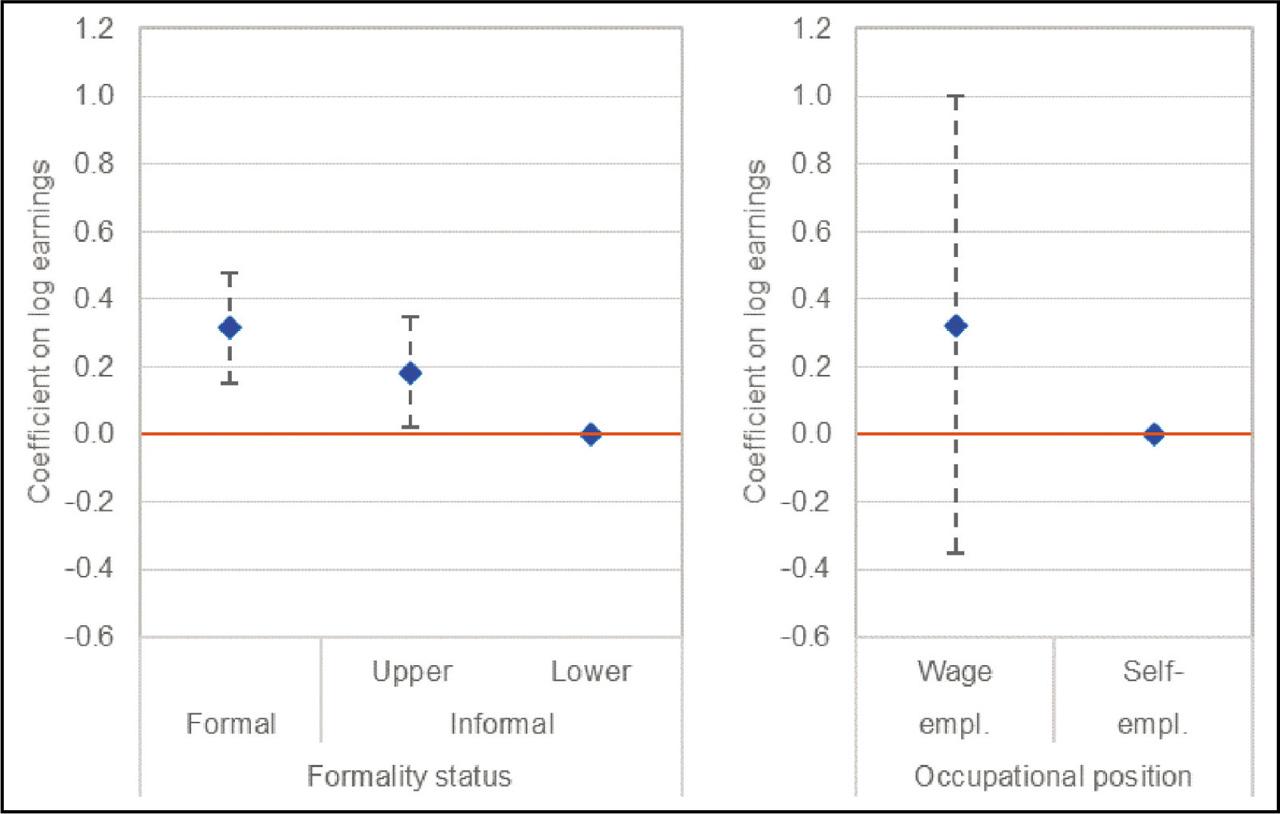
Figure 2
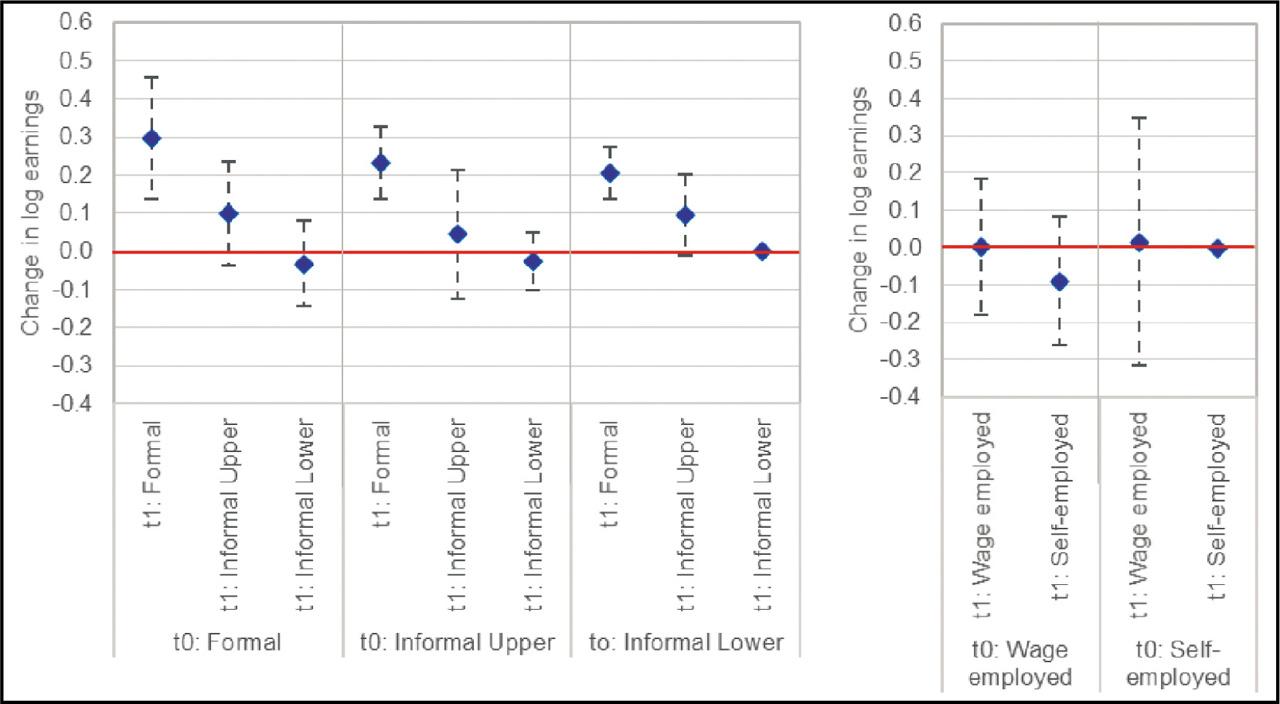
Figure C1
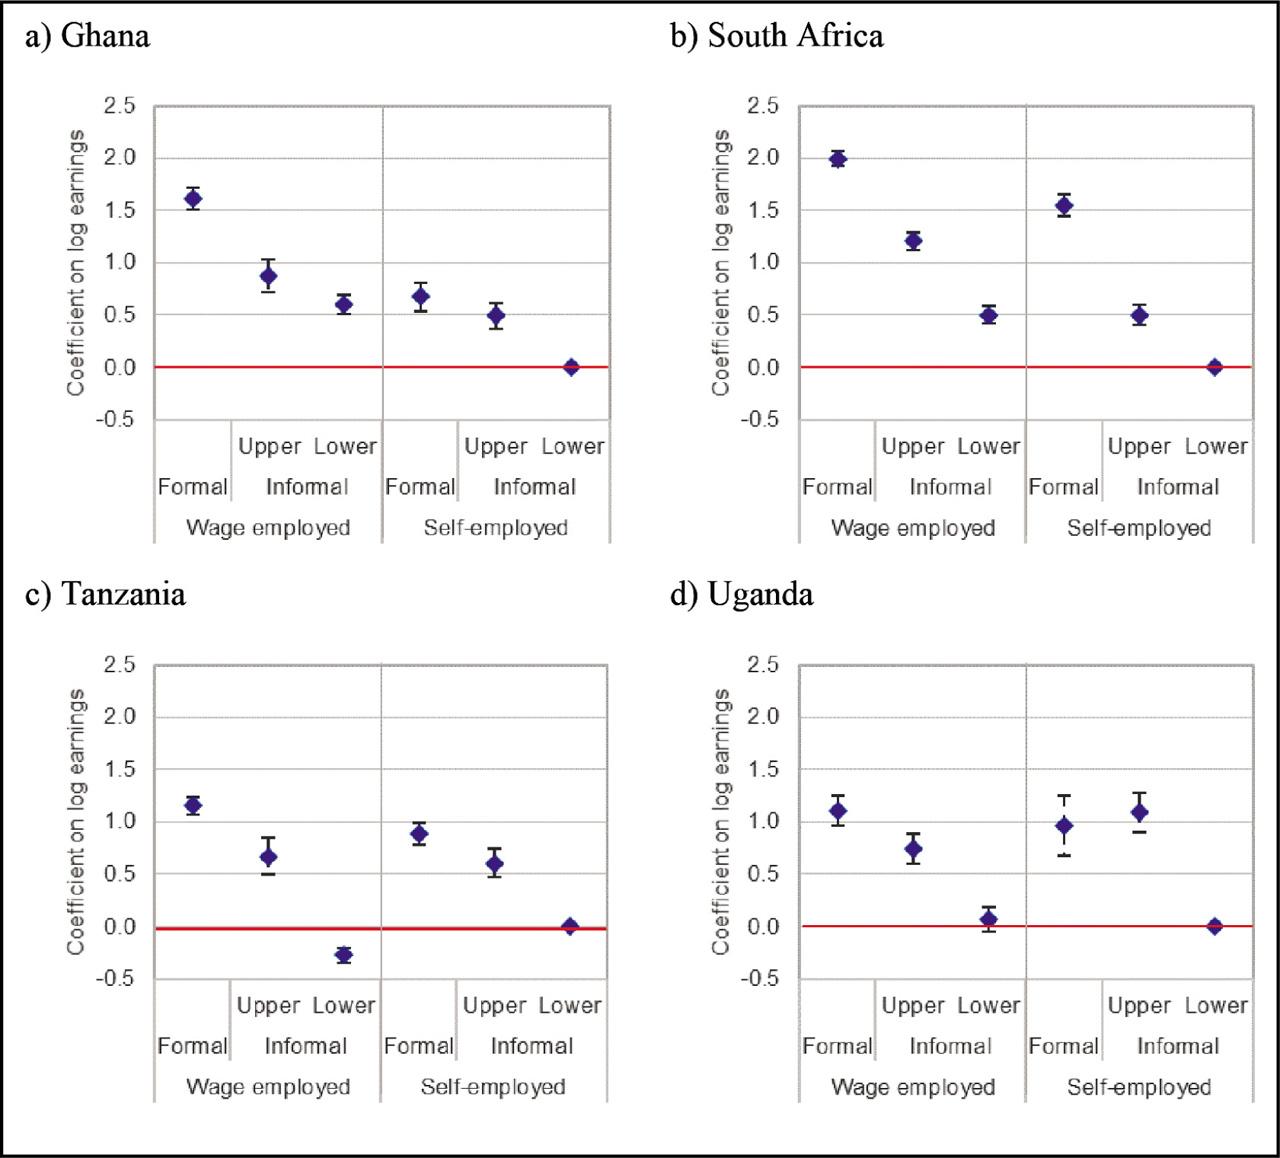
Figure C2
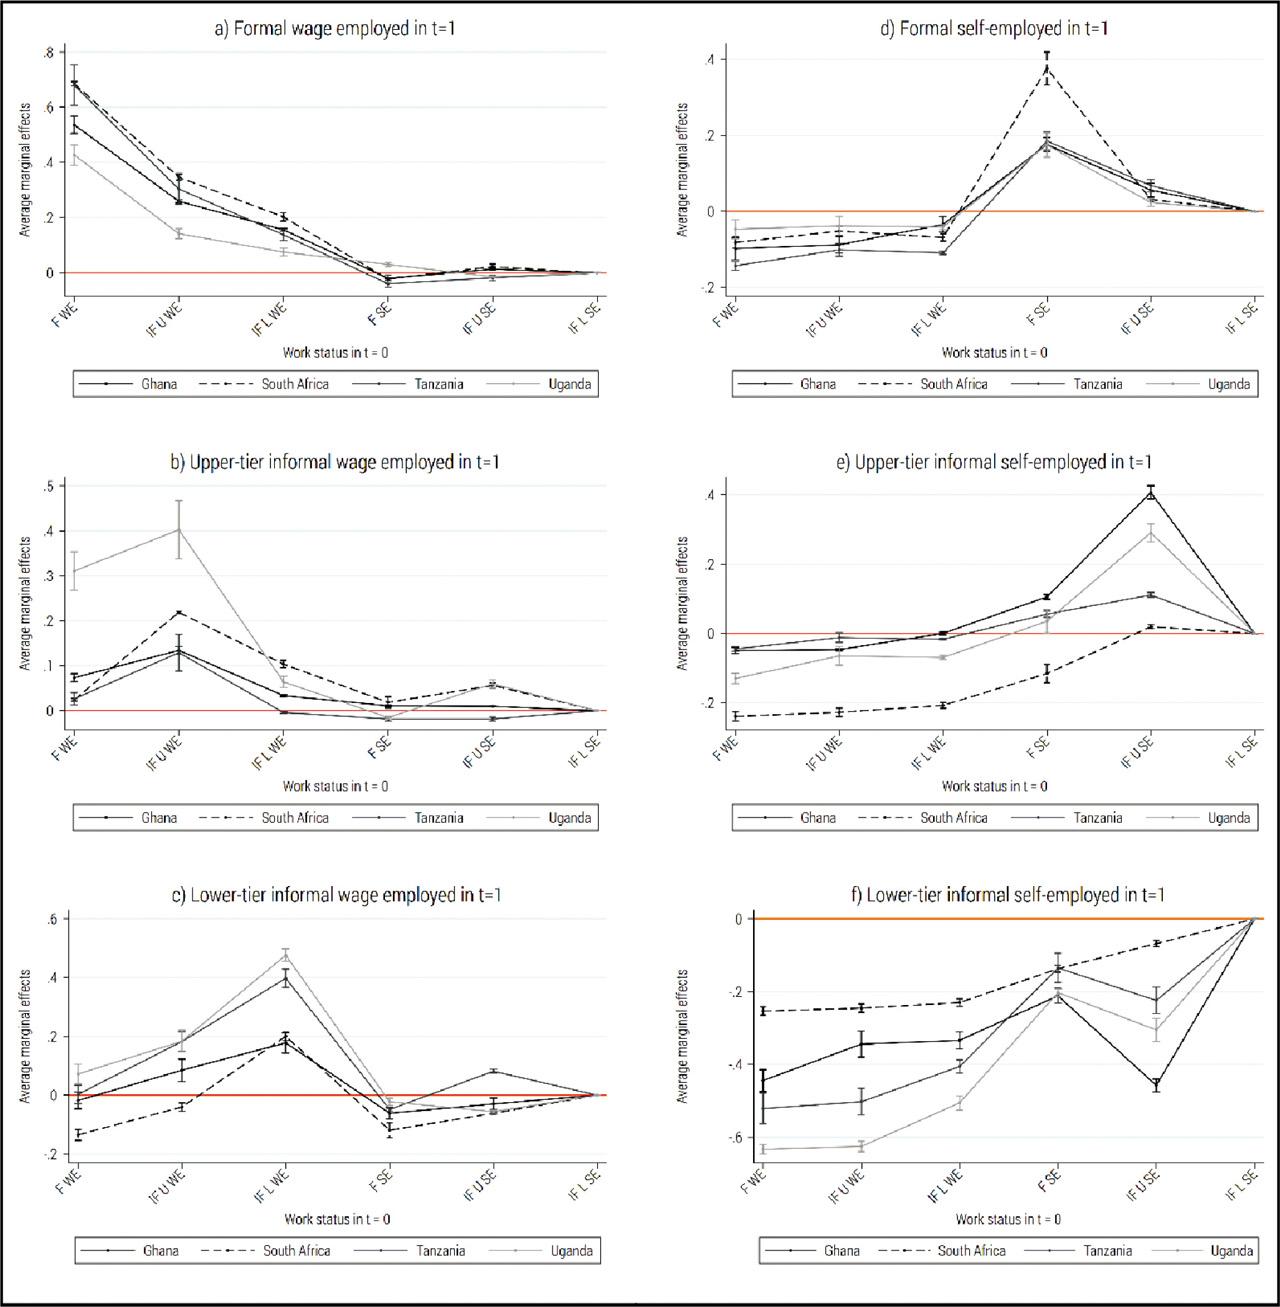
Figure C3
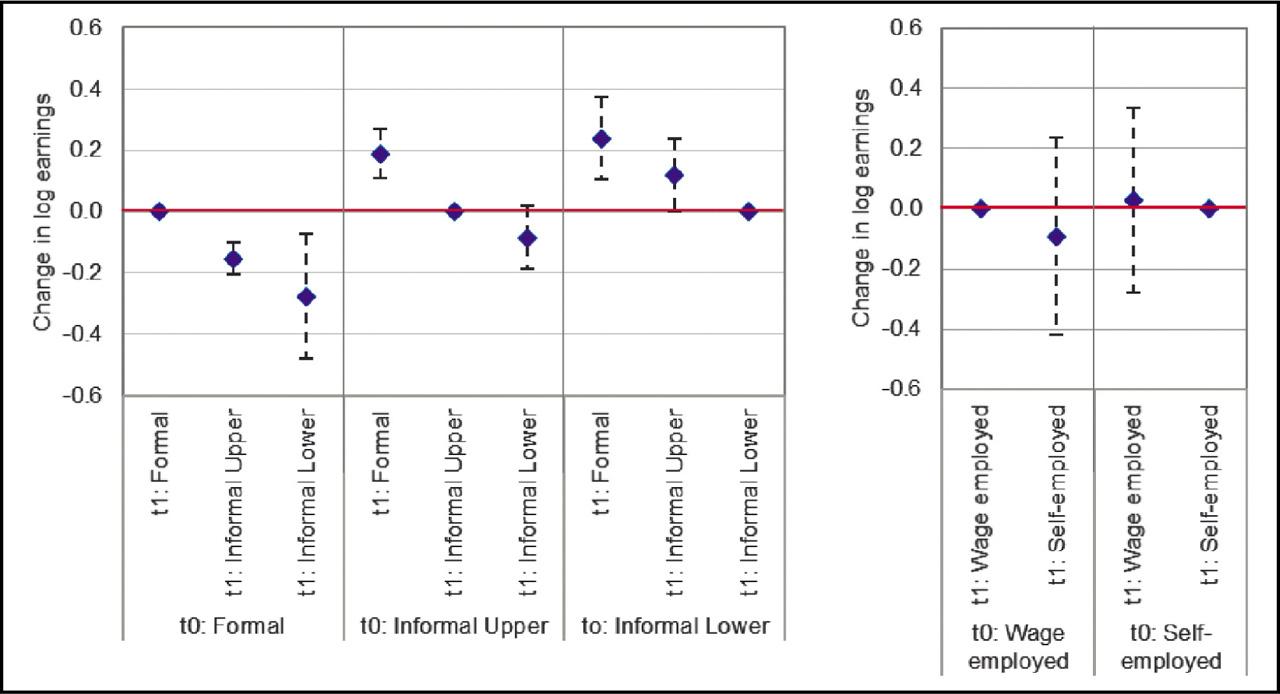
Figure C4
Transition matrices across work status groups
| WAVE t = 1 | Share of stayers | |||||||||
|---|---|---|---|---|---|---|---|---|---|---|
| Wage employed | Self-employed | |||||||||
| Formal | Informal | Formal | Informal | |||||||
| Upper | Lower | Upper | Lower | |||||||
| a) Ghana | ||||||||||
| WAVE t = 0 | Wage employed | Formal | 65.1 | 6.9 | 9.6 | 4.3 | 3.6 | 10.6 | 8.6 | |
| Informal | Upper | 33.0 | 11.8 | 23.7 | 2.5 | 3.2 | 25.8 | 0.6 | ||
| Lower | 21.7 | 5.3 | 32.2 | 7.5 | 6.4 | 26.9 | 6.1 | |||
| Self-employed | Formal | 2.1 | 3.4 | 12.1 | 29.5 | 15.8 | 37.1 | 2.6 | ||
| Informal | Upper | 4.0 | 2.5 | 15.2 | 14.7 | 44.7 | 18.9 | 5.3 | ||
| Lower | 2.1 | 2.0 | 15.8 | 6.8 | 6.3 | 67.2 | 28.1 | |||
| TOTAL | 21.0 | 4.5 | 18.4 | 9.1 | 11.2 | 35.8 | 51.3 | |||
| b) South Africa | ||||||||||
| WAVE t = 0 | Wage employed | Formal | 83.3 | 7.1 | 5.8 | 2.2 | 1.1 | 0.5 | 47.2 | |
| Informal | Upper | 50.1 | 25.1 | 14.7 | 6.0 | 1.0 | 3.1 | 2.2 | ||
| Lower | 26.4 | 13.1 | 47.7 | 4.7 | 3.9 | 4.3 | 10.2 | |||
| Self-employed | Formal | 13.0 | 9.7 | 5.1 | 50.8 | 13.3 | 8.1 | 2.0 | ||
| Informal | Upper | 12.2 | 11.1 | 19.5 | 16.1 | 23.5 | 17.6 | 1.3 | ||
| Lower | 14.7 | 6.2 | 16.8 | 6.9 | 24.6 | 30.8 | 1.1 | |||
| TOTAL | 63.4 | 9.9 | 14.9 | 5.2 | 3.4 | 3.1 | 64.0 | |||
| c) Tanzania | ||||||||||
| WAVE t = 0 | Wage employed | Formal | 79.7 | 4.4 | 9.7 | 1.5 | 1.0 | 3.6 | 9.3 | |
| Informal | Upper | 45.8 | 5.8 | 33.1 | 6.5 | 2.9 | 6.0 | 0.2 | ||
| Lower | 14.8 | 0.9 | 62.4 | 2.9 | 3.5 | 15.5 | 17.9 | |||
| Self-employed | Formal | 2.0 | 0.0 | 5.0 | 31.7 | 18.2 | 43.1 | 2.9 | ||
| Informal | Upper | 4.5 | 0.0 | 21.8 | 15.2 | 23.1 | 35.4 | 0.9 | ||
| Lower | 5.8 | 1.5 | 15.3 | 8.3 | 4.1 | 64.9 | 28.2 | |||
| TOTAL | 22.2 | 1.8 | 27.3 | 8.6 | 6.0 | 34.2 | 59.3 | |||
| d) Uganda | ||||||||||
| WAVE t = 0 | Wage employed | Formal | 58.0 | 27.0 | 8.1 | 5.2 | 0.0 | 1.7 | 6.8 | |
| Informal | Upper | 20.0 | 48.3 | 14.1 | 5.7 | 6.1 | 5.9 | 5.2 | ||
| Lower | 4.7 | 6.2 | 68.3 | 2.7 | 4.3 | 13.9 | 17.7 | |||
| Self-employed | Formal | 2.7 | 0.0 | 10.5 | 20.7 | 15.0 | 51.1 | 0.6 | ||
| Informal | Upper | 0.0 | 4.6 | 5.0 | 13.9 | 39.8 | 36.8 | 2.3 | ||
| Lower | 2.2 | 1.0 | 11.9 | 4.4 | 7.2 | 73.2 | 31.2 | |||
| TOTAL | 14.8 | 13.3 | 24.3 | 5.7 | 7.9 | 34.1 | 63.9 | |||
Distribution of workers by work status (%), extended definition
| Ghana | South Africa | Tanzania | Uganda | |||
|---|---|---|---|---|---|---|
| a) Proportion of employment by work status (incl. family farms and unemployment) | ||||||
| Wage employed | Formal | 6.8 | 44.3 | 3.9 | 4.0 | |
| Informal | Upper | 2.8 | 7.0 | 1.1 | 3.7 | |
| Lower | 9.8 | 16.7 | 9.5 | 8.8 | ||
| Self-employed | Formal | 4.6 | 3.1 | 3.0 | 1.1 | |
| Informal | Upper | 6.2 | 4.2 | 1.3 | 2.0 | |
| Lower | 21.7 | 2.9 | 14.4 | 14.5 | ||
| Family farms | 43.4 | 0.9 | 65.5 | 65.0 | ||
| Unemployment | 4.8 | 21.0 | 1.3 | 1.0 | ||
| TOTAL | 100 | 100 | 100 | 100 | ||
| b) Proportion of formal vs. informal employment (incl. family farms as informal lower) | ||||||
| Formal | 12.0 | 59.9 | 7.0 | 5.1 | ||
| Informal | Upper | 9.4 | 14.2 | 2.4 | 5.7 | |
| Lower | 78.6 | 25.9 | 90.6 | 89.2 | ||
| TOTAL | 100 | 100 | 100 | 100 | ||
Basic socioeconomic, labor market and institutional indicators, 2010–2017
| Ghana | South Africa | Tanzania | Uganda | |
|---|---|---|---|---|
| GDP per capita | ||||
| Annual (constant 2017 PPP $) | 4,505 | 12,731 | 2,256 | 2,004 |
| Growth rate (annual %) | 4.4 | 0.4 | 3.4 | 1.7 |
| Sectoral contribution to GDP (% of GDP) | ||||
| Agriculture | 21.9 | 2.2 | 26.6 | 26.2 |
| Industry | 28.6 | 26.6 | 25.1 | 25.5 |
| Services | 42.8 | 61.1 | 40.6 | 42.0 |
| Poverty headcount (% of population) | ||||
| $1.90 a day (2011 PPP) | 12.0 | 17.5 | 49.5 | 38.5 |
| $3.20 a day (2011 PPP) | 30.1 | 36.5 | 78.2 | 68.5 |
| Educational attainment (% of population 25+ years) (cumulative) | ||||
| At least completed primary | 64.7 | 81.4 | 64.8 | 38.4 |
| At least completed lower secondary | 54.3 | 74.5 | 11.0 | 26.4 |
| At least completed upper secondary | 20.6 | 61.5 | 3.4 | 10.3 |
| Sector employment (% of total) (modeled ILO estimate) | ||||
| Agriculture | 41.6 | 5.0 | 68.3 | 70.1 |
| Industry | 16.2 | 23.7 | 6.1 | 7.2 |
| Services | 42.2 | 71.3 | 25.5 | 22.6 |
| Public sector employment | ||||
| Public sector employment as a share of formal employment (%) | 45.4 | 22.7 | 49.8 | 39.5 |
| Union membership | ||||
| Share of private paid employees with union membership (%) | 17.5 | 20.4 | 9.4 | 3.0 |
| Ease of doing business | ||||
| Score (0 = lowest performance to 100 = best performance) | 57.8 | 65.7 | 52.5 | 57.3 |
| Number of start-up procedures to register a business | 7.6 | 6.5 | 11.3 | 14.0 |
| Days required to start a business | 12.9 | 45.3 | 29.5 | 26.8 |
| New business density (registrations per 1,000 people ages 15–64) | 1.0 | 7.2 | 0.3 | 0.9 |
| Quality of institutions | ||||
| Governance quality index (1–10) | 6.5 | 6.1 | 5.2 | 5.7 |
| Regulatory performance in paying taxes (1–100) | 66.3 | 81.2 | 53.8 | 73.0 |
| Workers’ Rights (1–100) | 79.0 | 86.0 | 71.0 | 70.0 |
Distribution of workers by work status (%)
| Ghana | South Africa | Tanzania | Uganda | |||
|---|---|---|---|---|---|---|
| a) Proportion of employment by work status | ||||||
| Wage employed | Formal | 13.2 | 56.7 | 11.7 | 11.7 | |
| Informal | Upper | 5.3 | 8.9 | 3.3 | 10.8 | |
| Lower | 18.9 | 21.4 | 28.6 | 26.0 | ||
| Self-employed | Formal | 8.9 | 4.0 | 9.1 | 3.1 | |
| Informal | Upper | 11.9 | 5.4 | 3.9 | 5.8 | |
| Lower | 41.8 | 3.7 | 43.4 | 42.6 | ||
| TOTAL | 100 | 100 | 100 | 100 | ||
| b) Proportion of formal vs. informal employment | ||||||
| Formal | 22.1 | 60.6 | 20.7 | 14.9 | ||
| Informal | Upper | 17.2 | 14.3 | 7.2 | 16.6 | |
| Lower | 60.7 | 25.1 | 72.0 | 68.6 | ||
| TOTAL | 100 | 100 | 100 | 100 | ||
| c) Proportion of upper-tier informality in informal employment | ||||||
| Upper informal in total informal employment | 22.1 | 36.4 | 9.1 | 19.4 | ||
| Upper informal in informal self-employment | 22.2 | 59.7 | 8.2 | 11.9 | ||
| Upper informal in informal wage employment | 22.0 | 29.4 | 10.5 | 29.4 | ||
Change in log labor earnings
| All countries | Excl. South Africa | |||
|---|---|---|---|---|
| Variables | (1) | (2) | (3) | (4) |
| Log labor earnings (t = 0) | −0.335*** (0.057) | −0.334** (0.058) | −0.375* (0.123) | −0.375* (0.124) |
| Formality status in t = 0 (base: Lower informal in t = 0) | ||||
| Formal (t = 0) | −0.033 (0.037) | −0.033 (0.035) | 0.018 (0.045) | 0.016 (0.044) |
| Upper informal (t = 0) | −0.023 (0.023) | −0.025 (0.024) | 0.016 (0.031) | 0.021 (0.030) |
| Formality status in t = 0 and t = 1 (base: Lower informal in t = 0 and t = 1) | ||||
| Formal (t = 0) × Formal (t = 1) | 0.337** (0.081) | 0.330** (0.077) | 0.240 (0.101) | 0.243 (0.110) |
| Formal (t = 0) × Upper informal (t = 1) | 0.136 (0.076) | 0.133 (0.073) | 0.014 (0.080) | 0.013 (0.087) |
| Upper informal (t = 0) × Formal (t = 1) | 0.257*** (0.029) | 0.256*** (0.030) | 0.265** (0.035) | 0.260** (0.045) |
| Upper informal (t = 0) × Upper informal (t = 1) | 0.071 (0.057) | 0.070 (0.056) | 0.109 (0.118) | 0.099 (0.121) |
| Lower informal (t = 0) × Formal (t = 0) | 0.206*** (0.022) | 0.206*** (0.021) | 0.211* (0.054) | 0.212* (0.054) |
| Lower informal (t = 0) × Upper informal (t = 0) | 0.082* (0.029) | 0.095* (0.033) | 0.067 (0.062) | 0.069 (0.045) |
| Employment status in t = 0 (base: Wage employed in t = 0) | ||||
| Self-employed (t = 0) | 0.045 (0.106) | −0.091** (0.014) | ||
| Employment status in t = 0 and t = 1 (base: Wage employed in t = 0 and t = 1) | ||||
| Self-employed (t = 0) × Self-employed (t = 0) | −0.090 (0.054) | −0.021 (0.041) | ||
| Wage employed (t = 0) × Self-employed (t = 0) | 0.015 (0.104) | −0.067 (0.087) | ||
| Characteristics in t = 0 | ||||
| Level of education (base: No schooling) | ||||
| Primary | 0.058 (0.036) | 0.061 (0.031) | 0.076 (0.036) | 0.076 (0.029) |
| Post-primary | 0.103** (0.022) | 0.106*** (0.018) | 0.104* (0.033) | 0.108* (0.032) |
| Secondary | 0.205*** (0.035) | 0.207*** (0.032) | 0.212* (0.054) | 0.219* (0.063) |
| Post-secondary | 0.328*** (0.039) | 0.332*** (0.037) | 0.227** (0.045) | 0.236** (0.055) |
| Tertiary | 0.542*** (0.089) | 0.544*** (0.088) | 0.474* (0.143) | 0.482* (0.154) |
| Age | 0.005 (0.004) | 0.004 (0.003) | 0.004 (0.009) | 0.003 (0.008) |
| Age squared (×0.01) | −0.004 (0.004) | −0.004 (0.004) | −0.002 (0.009) | −0.001 (0.008) |
| Female | −0.134** (0.029) | −0.135** (0.030) | −0.152 (0.082) | −0.157 (0.083) |
| Urban | 0.076** (0.023) | 0.076** (0.023) | 0.095 (0.064) | 0.100 (0.062) |
| Country (base: Uganda) | ||||
| South Africa | 0.110 (0.052) | 0.102 (0.067) | ||
| Tanzania | 0.073 (0.033) | 0.067 (0.036) | 0.096 (0.094) | 0.097 (0.099) |
| Uganda | −0.014 (0.018) | −0.021 (0.023) | 0.013 (0.058) | 0.013 (0.065) |
| Sample selection | ||||
| Panel retention From t = 0 to t = 1 | −0.021 (0.029) | −0.018 (0.024) | −0.136 (0.149) | −0.140 (0.140) |
| Employed (non-farm) in t = 0 | 0.005 (0.010) | 0.005 (0.011) | −0.044 (0.115) | −0.038 (0.114) |
| Constant | 1.500** (0.269) | 1.504** (0.269) | 1.765* (0.490) | 1.805* (0.484) |
| Observations | 7,240 | 7,240 | 2,760 | 2,760 |
| Adj. R2 | 0.371 | 0.376 | 0.382 | 0.384 |
Data sources
| Country | Survey | t = 0 | t = 1 |
|---|---|---|---|
| Ghana | GSPS | Wave I (2009/10) | Wave II (2013/14) |
| South Africa | NIDS | Wave IV (2014/15) | Wave V (2017) |
| Tanzania | TZNPS | Wave II (2010/11) | Wave III (2012/13) |
| Uganda | UNPS | Wave II (2010/11) | Wave III (2011/12) |
Employment dynamics, including inactivity/unemployment as an additional destination state
| Multinomial logistic regression | Number of obs = 9,851 | |||||
|---|---|---|---|---|---|---|
| Average marginal effects on work status in t = 1 | Log-likelihood = −12,048 | |||||
| Base outcome: Lower-tier informal wage employed | Pseudo R2 = 0.284 | |||||
| Variables | (1) | (2) | (3) | (4) | (5) | (6) |
| Formal wage employed | Upper-tier informal wage employed | Lower-tier informal wage employed | Formal self-employed | Upper-tier informal self-employed | Inactive/unemployed | |
| Work status in t = 0 (base: lower-tier informal self-employed) | ||||||
| (1) Formal wage employed | 0.584*** (0.016) | 0.051*** (0.009) | −0.002 (0.020) | −0.070*** (0.009) | −0.052*** (0.018) | −0.271*** (0.012) |
| (2) Upper-tier informal wage employed | 0.264*** (0.011) | 0.168*** (0.007) | 0.084*** (0.019) | −0.048*** (0.009) | −0.038** (0.017) | −0.210*** (0.022) |
| (3) Lower-tier informal wage employed | 0.130*** (0.008) | 0.053*** (0.013) | 0.228*** (0.023) | −0.054*** (0.010) | −0.028* (0.015) | −0.137*** (0.019) |
| (4) Formal self-employed | −0.006 (0.012) | 0.006 (0.013) | −0.022* (0.012) | 0.195*** (0.024) | 0.051* (0.027) | −0.168*** (0.017) |
| (5) Upper-tier informal self-employed | 0.008 (0.010) | 0.023** (0.011) | 0.008 (0.023) | 0.027** (0.013) | 0.151*** (0.044) | −0.101*** (0.038) |
| Level of education (base: no schooling) | ||||||
| Primary | 0.035** (0.016) | 0.001 (0.007) | −0.065** (0.027) | 0.018*** (0.005) | 0.002 (0.004) | −0.003 (0.018) |
| Post-primary | 0.093*** (0.017) | 0.012 (0.020) | −0.113*** (0.032) | 0.040*** (0.004) | 0.006 (0.005) | −0.021 (0.019) |
| Secondary | 0.157*** (0.024) | 0.011 (0.017) | −0.157*** (0.033) | 0.042*** (0.003) | 0.001 (0.009) | −0.036** (0.015) |
| Post-secondary | 0.219*** (0.028) | 0.031* (0.019) | −0.204*** (0.035) | 0.082*** (0.017) | 0.005 (0.010) | −0.072*** (0.014) |
| Tertiary | 0.329*** (0.029) | 0.013 (0.014) | −0.249*** (0.040) | 0.088*** (0.032) | −0.009 (0.018) | −0.099*** (0.023) |
| Age | 0.015*** (0.004) | 0.002 (0.001) | −0.001 (0.001) | 0.006* (0.003) | 0.002 (0.002) | −0.030*** (0.006) |
| Age squared (×0.01) | −0.018*** (0.004) | −0.003 (0.002) | −0.001 (0.001) | −0.006* (0.004) | −0.003 (0.002) | 0.038*** (0.006) |
| Female | −0.050*** (0.010) | 0.016*** (0.003) | −0.028* (0.016) | −0.023*** (0.003) | −0.019*** (0.001) | 0.078*** (0.024) |
| Urban | 0.012*** (0.004) | −0.022*** (0.005) | 0.015 (0.016) | 0.006 (0.007) | −0.009*** (0.004) | 0.018 (0.013) |
| Country (base: Ghana) | ||||||
| South Africa | 0.085*** (0.007) | 0.020*** (0.003) | −0.035*** (0.008) | −0.020*** (0.005) | −0.032*** (0.002) | 0.107*** (0.006) |
| Tanzania | 0.162*** (0.017) | −0.021*** (0.004) | 0.030*** (0.006) | 0.026*** (0.002) | −0.024*** (0.004) | −0.188*** (0.005) |
| Uganda | −0.053*** (0.003) | 0.100*** (0.009) | 0.042*** (0.007) | −0.009*** (0.002) | 0.016*** (0.002) | −0.151*** (0.009) |
| Sample selection | ||||||
| Panel retention From t = 0 to t = 1 | −0.037 (0.039) | −0.020* (0.012) | −0.033*** (0.012) | −0.012 (0.009) | −0.015* (0.008) | 0.031 (0.030) |
| Employed (non-farm) in t = 0 | −0.034 (0.033) | −0.009 (0.013) | −0.003 (0.022) | 0.001 (0.013) | −0.022*** (0.007) | 0.087 (0.056) |
Employment transitions
| Multinomial logistic regression | Number of obs = 7,816 | ||||
|---|---|---|---|---|---|
| Average marginal effects on work status in t = 1 | Log-likelihood = −7,851.1291 | ||||
| Base outcome: Lower-tier informal wage employed | Pseudo R2 = 0.3353 | ||||
| (1) | (2) | (3) | (4) | (5) | |
| Variables | Formal wage employed | Upper-tier informal wage employed | Lower-tier informal wage employed | Formal self-employed | Upper-tier informal self-employed |
| Work status in t = 0 (base: lower-tier informal self-employed) | |||||
| (1) Formal wage employed | 0.628*** (0.028) | 0.037** (0.016) | −0.066** (0.033) | −0.128*** (0.014) | −0.096*** (0.029) |
| (2) Upper-tier informal wage employed | 0.293*** (0.026) | 0.192*** (0.015) | 0.044 (0.033) | −0.099*** (0.014) | −0.078*** (0.028) |
| (3) Lower-tier informal wage employed | 0.153*** (0.008) | 0.062** (0.024) | 0.264*** (0.042) | −0.104*** (0.016) | −0.062** (0.025) |
| (4) Formal self-Employed | −0.045* (0.026) | −0.007 (0.023) | −0.079*** (0.020) | 0.227*** (0.033) | 0.043 (0.044) |
| (5) Upper-tier informal self-employed | −0.012 (0.024) | 0.028 (0.022) | −0.023 (0.030) | 0.016 (0.014) | 0.201*** (0.056) |
| Level of education (base: no schooling) | |||||
| Primary | 0.053*** (0.018) | 0.001 (0.009) | −0.089*** (0.025) | 0.023*** (0.006) | 0.001 (0.004) |
| Post-primary | 0.121*** (0.023) | 0.011 (0.026) | −0.160*** (0.033) | 0.050*** (0.005) | 0.004 (0.005) |
| Secondary | 0.196*** (0.025) | 0.008 (0.022) | −0.223*** (0.034) | 0.052*** (0.003) | −0.002 (0.012) |
| Post-secondary | 0.246*** (0.028) | 0.026 (0.022) | −0.283*** (0.036) | 0.096*** (0.020) | −0.000 (0.012) |
| Tertiary | 0.342*** (0.024) | −0.001 (0.019) | −0.337*** (0.041) | 0.107*** (0.038) | −0.016 (0.020) |
| Age | 0.003 (0.003) | −0.002 (0.002) | −0.010*** (0.003) | 0.006 (0.004) | 0.000 (0.002) |
| Age squared (×0.01) | −0.002 (0.004) | 0.002 (0.003) | 0.009*** (0.003) | −0.006 (0.005) | −0.001 (0.003) |
| Female | −0.037*** (0.009) | 0.029*** (0.003) | −0.008 (0.011) | −0.021*** (0.005) | −0.016*** (0.001) |
| Urban | 0.029*** (0.006) | −0.027*** (0.007) | 0.015 (0.018) | 0.007 (0.009) | −0.013*** (0.004) |
| Country (base: Ghana) | |||||
| South Africa | 0.122*** (0.006) | 0.037*** (0.007) | 0.005 (0.012) | −0.010 (0.006) | −0.020*** (0.003) |
| Tanzania | 0.112*** (0.018) | −0.033*** (0.004) | −0.019*** (0.006) | 0.017*** (0.002) | −0.036*** (0.005) |
| Uganda | −0.106*** (0.005) | 0.099*** (0.010) | 0.011 (0.007) | −0.018*** (0.002) | 0.007*** (0.002) |
| Sample selection | |||||
| Panel retention from t = 0 to t = 1 | −0.044** (0.020) | −0.019** (0.009) | −0.026* (0.015) | −0.007 (0.011) | −0.009 (0.013) |
| Employed (non-farm) in t = 0 | 0.011 (0.012) | −0.002 (0.021) | 0.010 (0.022) | 0.005 (0.014) | −0.025** (0.010) |
Employment dynamics, using ordered logistic regression
| Ordered logistic regression, average marginal effects, split sample | ||||||
|---|---|---|---|---|---|---|
| (1) | (2) | (3) | ||||
| Formality status in t = 0 | Lower-tier informal | Upper-tier informal | Formal | |||
| Formality status in t = 1 | Formal | Upper-tier informal | Formal | Lower-tier informal | Upper-tier informal | Lower-tier informal |
| Variables | ||||||
| Employment status (base: Wage employed) | ||||||
| Self-employed | −0.036 (0.026) | −0.013 (0.012) | −0.122** (0.057) | 0.114** (0.055) | 0.081*** (0.007) | 0.185*** (0.034) |
| Level of education (base: no schooling) | ||||||
| Primary | 0.033 (0.020) | 0.019** (0.008) | 0.022 (0.021) | −0.033 (0.035) | −0.034* (0.020) | −0.125* (0.073) |
| Post-primary | 0.121** (0.053) | 0.056*** (0.011) | 0.117 (0.080) | −0.145 (0.109) | −0.069*** (0.016) | −0.197*** (0.055) |
| Secondary | 0.208*** (0.074) | 0.077*** (0.005) | 0.238*** (0.068) | −0.245*** (0.093) | −0.092*** (0.020) | −0.232*** (0.055) |
| Post-secondary | 0.281*** (0.043) | 0.084*** (0.004) | 0.328*** (0.076) | −0.300*** (0.096) | −0.114*** (0.024) | −0.263*** (0.059) |
| Tertiary | 0.575*** (0.064) | 0.048** (0.023) | 0.554*** (0.101) | −0.395*** (0.084) | −0.133*** (0.024) | −0.286*** (0.054) |
| Age | 0.003 (0.004) | 0.001 (0.001) | 0.013 (0.010) | −0.011 (0.009) | −0.004** (0.002) | −0.007** (0.003) |
| Age squared (×0.01) | −0.002 (0.004) | −0.001 (0.001) | −0.014 (0.009) | 0.012 (0.009) | 0.004* (0.002) | 0.006* (0.004) |
| Female | −0.066** (0.031) | −0.023*** (0.005) | −0.014 (0.048) | 0.013 (0.044) | 0.019*** (0.005) | 0.034*** (0.009) |
| Urban | 0.021* (0.012) | 0.007 (0.006) | 0.046** (0.019) | −0.042** (0.018) | 0.001 (0.007) | 0.003 (0.013) |
| Country (base: Ghana) | ||||||
| South Africa | 0.102*** (0.015) | 0.036*** (0.009) | 0.068*** (0.010) | −0.061*** (0.010) | −0.058*** (0.012) | −0.122*** (0.004) |
| Tanzania | 0.038 (0.031) | 0.016** (0.007) | 0.027 (0.035) | −0.026 (0.033) | −0.049*** (0.004) | −0.106*** (0.008) |
| Uganda | −0.040*** (0.010) | −0.021* (0.012) | −0.080*** (0.014) | 0.090*** (0.015) | 0.013*** (0.001) | 0.045*** (0.005) |
| Sample selection | ||||||
| Panel retention From t = 0 to t = 1 | −0.144* (0.082) | −0.049*** (0.014) | −0.024 (0.044) | 0.021 (0.040) | 0.026* (0.014) | 0.045 (0.030) |
| Employed (non-farm) in t = 0 | 0.013 (0.023) | 0.004 (0.009) | 0.090*** (0.030) | −0.082*** (0.026) | 0.025* (0.014) | 0.043* (0.024) |
| Observations | 2,869 | 1,166 | 3,781 | |||
| Pseudo R2 | 0.0728 | 0.0614 | 0.1220 | |||
Transition matrices across work status groups, including additional destination states (family farms under lower-tier informal self-employment and unemployment)
| WAVE t = 1 | Share of stayers | ||||||||||
|---|---|---|---|---|---|---|---|---|---|---|---|
| Wage employed | Self-employed | Unempl. | |||||||||
| Formal | Informal | Formal | Informal | ||||||||
| Upper | Lower | Upper | Lower | ||||||||
| a) Ghana | |||||||||||
| WAVE t = 0 | Wage employed | Formal | 59.0 | 6.2 | 8.7 | 3.9 | 3.2 | 16.7 | 2.2 | 7.8 | |
| Informal | Upper | 25.7 | 9.2 | 18.5 | 2.0 | 2.5 | 40.5 | 1.6 | 0.5 | ||
| Lower | 15.5 | 3.8 | 22.9 | 5.4 | 4.5 | 41.2 | 6.8 | 4.3 | |||
| Self-employed | Formal | 1.1 | 1.7 | 6.2 | 14.9 | 8.0 | 64.2 | 4.0 | 1.3 | ||
| Informal | Upper | 2.2 | 1.3 | 8.2 | 8.0 | 24.2 | 52.4 | 3.8 | 2.9 | ||
| Lower | 0.8 | 0.8 | 6.5 | 2.8 | 2.6 | 83.5 | 3.1 | 34.9 | |||
| TOTAL | 11.9 | 2.6 | 10.5 | 5.2 | 6.4 | 59.7 | 3.7 | 51.7 | |||
| b) South Africa | |||||||||||
| WAVE t = 0 | Wage employed | Formal | 78.9 | 6.7 | 5.5 | 2.1 | 1.0 | 0.7 | 5.1 | 44.7 | |
| Informal | Upper | 42.0 | 21.0 | 12.4 | 5.0 | 0.9 | 2.7 | 16.1 | 1.9 | ||
| Lower | 22.0 | 10.9 | 39.8 | 3.9 | 3.2 | 3.9 | 16.2 | 8.5 | |||
| Self-employed | Formal | 10.8 | 8.0 | 4.2 | 42.0 | 11.0 | 8.5 | 15.5 | 1.7 | ||
| Informal | Upper | 9.9 | 9.0 | 15.8 | 13.1 | 19.1 | 14.3 | 18.8 | 1.0 | ||
| Lower | 10.0 | 4.2 | 11.4 | 4.7 | 16.7 | 21.2 | 31.9 | 0.8 | |||
| TOTAL | 56.9 | 8.9 | 13.4 | 4.7 | 3.1 | 3.0 | 10.1 | 58.6 | |||
| c) Tanzania | |||||||||||
| WAVE t = 0 | Wage employed | Formal | 71.9 | 4.0 | 8.8 | 1.4 | 0.9 | 12.7 | 0.4 | 8.4 | |
| Informal | Upper | 40.5 | 5.1 | 29.2 | 5.7 | 2.5 | 15.9 | 1.1 | 0.2 | ||
| Lower | 11.1 | 0.7 | 46.7 | 2.2 | 2.6 | 35.9 | 0.8 | 13.4 | |||
| Self-employed | Formal | 1.6 | 0.0 | 4.1 | 25.8 | 14.8 | 53.6 | 0.0 | 2.3 | ||
| Informal | Upper | 3.8 | 0.0 | 18.5 | 12.9 | 19.6 | 45.2 | 0.0 | 0.8 | ||
| Lower | 3.8 | 1.0 | 9.9 | 5.4 | 2.7 | 74.8 | 2.5 | 32.5 | |||
| TOTAL | 16.5 | 1.3 | 20.4 | 6.4 | 4.5 | 49.6 | 1.3 | 57.5 | |||
| d) Uganda | |||||||||||
| WAVE t = 0 | Wage employed | Formal | 57.7 | 26.8 | 8.1 | 5.2 | 0.0 | 2.2 | 0.0 | 6.8 | |
| Informal | Upper | 17.8 | 43.1 | 12.6 | 5.1 | 5.5 | 16.0 | 0.0 | 4.7 | ||
| Lower | 3.2 | 4.2 | 46.1 | 1.8 | 2.9 | 41.4 | 0.5 | 12.0 | |||
| Self-employed | Formal | 2.6 | 0.0 | 10.1 | 19.8 | 14.3 | 53.3 | 0.0 | 0.6 | ||
| Informal | Upper | 0.0 | 3.7 | 4.0 | 11.2 | 32.1 | 49.1 | 0.0 | 1.8 | ||
| Lower | 1.2 | 0.5 | 6.3 | 2.3 | 3.8 | 85.4 | 0.5 | 36.4 | |||
| TOTAL | 10.2 | 9.1 | 16.7 | 3.9 | 5.4 | 54.3 | 0.3 | 62.3 | |||
Average worker characteristics by work status
| Ghana | South Africa | Tanzania | Uganda | |||
|---|---|---|---|---|---|---|
| a) Average age (years) | ||||||
| Wage employed | Formal | 43.5 (0.53) | 37.5 (0.16) | 40.5 (0.52) | 36.1 (0.71) | |
| Informal | Upper | 36.4 (0.82) | 35.6 (0.37) | 33.4 (1.00) | 34.7 (0.84) | |
| Lower | 38.4 (0.46) | 35.4 (0.25) | 30.3 (0.35) | 30.5 (0.53) | ||
| Self-employed | Formal | 41.5 (0.64) | 41.3 (0.72) | 37.5 (0.54) | 34.8 (1.29) | |
| Informal | Upper | 40.3 (0.53) | 40.2 (0.54) | 34.7 (0.83) | 38.8 (0.95) | |
| Lower | 40.8 (0.29) | 38.6 (0.69) | 31.0 (0.33) | 34.8 (0.47) | ||
| TOTAL | 40.5 (0.19) | 37.2 (0.12) | 32.7 (0.20) | 34.1 (0.29) | ||
| b) Share of female workers (%) | ||||||
| Wage employed | Formal | 33.7 (2.41) | 41.5 (0.75) | 32.5 (2.15) | 41.3 (3.77) | |
| Informal | Upper | 30.0 (3.55) | 57.0 (1.65) | 35.5 (4.33) | 34.3 (3.80) | |
| Lower | 33.8 (1.91) | 44.3 (1.09) | 34.0 (1.55) | 26.8 (2.12) | ||
| Self-employed | Formal | 47.9 (3.24) | 45.8 (3.00) | 36.0 (2.83) | 39.7 (6.60) | |
| Informal | Upper | 50.0 (2.67) | 40.3 (2.25) | 25.4 (3.73) | 29.4 (4.25) | |
| Lower | 81.7 (1.08) | 58.4 (2.96) | 63.9 (1.31) | 47.9 (1.85) | ||
| TOTAL | 56.8 (0.90) | 44.2 (0.55) | 46.7 (0.87) | 38.9 (1.19) | ||
| c) Share of workers with secondary or tertiary education (%) | ||||||
| Wage employed | Formal | 52.2 (3.02) | 63.7 (0.74) | 36.4 (2.29) | 60.1 (3.88) | |
| Informal | Upper | 37.8 (4.04) | 55.5 (1.66) | 39.9 (4.76) | 59.7 (4.09) | |
| Lower | 19.1 (1.76) | 28.0 (0.98) | 1.2 (0.36) | 11.8 (1.66) | ||
| Self-employed | Formal | 18.6 (2.80) | 69.3 (2.78) | 2.4 (0.91) | 42.9 (6.74) | |
| Informal | Upper | 10.0 (1.82) | 28.6 (2.07) | 3.3 (1.56) | 37.3 (4.59) | |
| Lower | 8.3 (0.95) | 33.0 (2.82) | 1.7 (0.38) | 12.2 (1.29) | ||
| TOTAL | 19.0 (0.83) | 52.5 (0.55) | 7.1 (0.47) | 25.8 (1.13) | ||
Change in distribution of workers by work status, balanced panel
| Ghana | South Africa | Tanzania | Uganda | |||
|---|---|---|---|---|---|---|
| a) Change (ppts) in proportion of employment by work status | ||||||
| Wage employed | Formal | 1.7 | −0.4 | 5.0 | −2.7 | |
| Informal | Upper | −2.5 | 1.6 | −2.4 | 0.0 | |
| Lower | −3.8 | −3.3 | −0.4 | 0.7 | ||
| Self-employed | Formal | 0.8 | 2.0 | −2.8 | 1.3 | |
| Informal | Upper | −1.5 | −0.5 | 0.7 | 0.5 | |
| Lower | 5.3 | 0.6 | −0.1 | 0.3 | ||
| b) Change (ppts) in proportion of formal and informal employment | ||||||
| Formal | 2.5 | 1.5 | 2.3 | −1.5 | ||
| Informal | Upper | −4.0 | 1.1 | −1.7 | 0.5 | |
| Lower | 1.5 | −2.6 | −0.5 | 1.0 | ||
| c) Change (ppts) in proportion of self-employment | ||||||
| Self-employed | 4.6 | 2.1 | −2.2 | 2.1 | ||
Excludability of instruments from main employment dynamics equation
| Head of household | Sample member in the previous wave | |
|---|---|---|
| F-statistic (p-value) | 0.1800 | 0.9647 |
(Non-farm) employment and panel retention rates (%)
| Ghana | South Africa | Tanzania | Uganda | |||||
|---|---|---|---|---|---|---|---|---|
| Employed (non-farm) | Panel retention | Employed (non-farm) | Panel retention | Employed (non-farm) | Panel retention | Employed (non-farm) | Panel retention | |
| Percentage share | 51.7 | 70.8 | 78.1 | 75.9 | 33.2 | 69.1 | 34.0 | 71.9 |
Probability of employment (non-farm) in the baseline and panel retention
| Variables | Ghana | South Africa | Tanzania | Uganda | ||||
|---|---|---|---|---|---|---|---|---|
| (1) | (2) | (1) | (2) | (1) | (2) | (1) | (2) | |
| Employed (non-farm) | Panel retention | Employed (non-farm) | Panel retention | Employed (non-farm) | Panel retention | Employed (non-farm) | Panel retention | |
| Level of education (base: no schooling) | ||||||||
| Primary | 0.164* (0.086) | −0.044 (0.080) | −0.040 (0.025) | 0.013 (0.024) | 0.091*** (0.013) | 0.014 (0.013) | −0.052** (0.022) | 0.004 (0.020) |
| Post-primary | 0.216** (0.085) | −0.034 (0.079) | −0.047* (0.024) | 0.013 (0.023) | 0.332*** (0.019) | 0.014 (0.018) | 0.108*** (0.029) | −0.033 (0.026) |
| Secondary | 0.328*** (0.088) | −0.044 (0.082) | 0.001 (0.024) | 0.010 (0.024) | 0.602*** (0.038) | 0.127*** (0.032) | 0.089** (0.035) | −0.030 (0.031) |
| Post-secondary | 0.506*** (0.093) | −0.018 (0.090) | 0.069*** (0.025) | −0.013 (0.025) | 0.556*** (0.045) | 0.024 (0.045) | 0.356*** (0.040) | −0.041 (0.037) |
| Tertiary | 0.521*** (0.091) | −0.081 (0.089) | 0.160*** (0.028) | −0.022 (0.032) | 0.593*** (0.063) | 0.145*** (0.040) | 0.124** (0.063) | −0.111* (0.059) |
| Age | 0.033*** (0.004) | 0.052*** (0.003) | 0.026*** (0.002) | 0.010*** (0.002) | 0.004* (0.002) | 0.031*** (0.002) | 0.010*** (0.003) | 0.027*** (0.003) |
| Age squared (×0.01) | −0.042*** (0.005) | −0.064*** (0.004) | −0.024*** (0.003) | −0.013*** (0.003) | −0.010*** (0.003) | −0.039*** (0.003) | −0.016*** (0.004) | −0.030*** (0.004) |
| Female | 0.189*** (0.017) | −0.015 (0.014) | −0.089*** (0.008) | 0.061*** (0.008) | −0.001 (0.011) | −0.074*** (0.010) | −0.115*** (0.015) | 0.019 (0.013) |
| Urban | 0.264*** (0.012) | −0.032** (0.015) | 0.113*** (0.008) | −0.011 (0.008) | 0.375*** (0.007) | −0.092*** (0.011) | 0.340*** (0.015) | −0.050*** (0.016) |
| Head of household | 0.268*** (0.018) | 0.106*** (0.008) | 0.108*** (0.012) | 0.140*** (0.017) | ||||
| Sample member in the previous wave | n.a. | 0.234*** (0.008) | 0.044*** (0.012) | 0.073*** (0.016) | ||||
| Wald test of rho = 0 | 15.216 | 10.086 | 17.313 | 9.811 | ||||
| F-statistic (p-value) | 0.000 | 0.002 | 0.000 | 0.002 | ||||
| Observations | 6,718 | 21,498 | 7,870 | 4,315 | ||||