
Figure 1
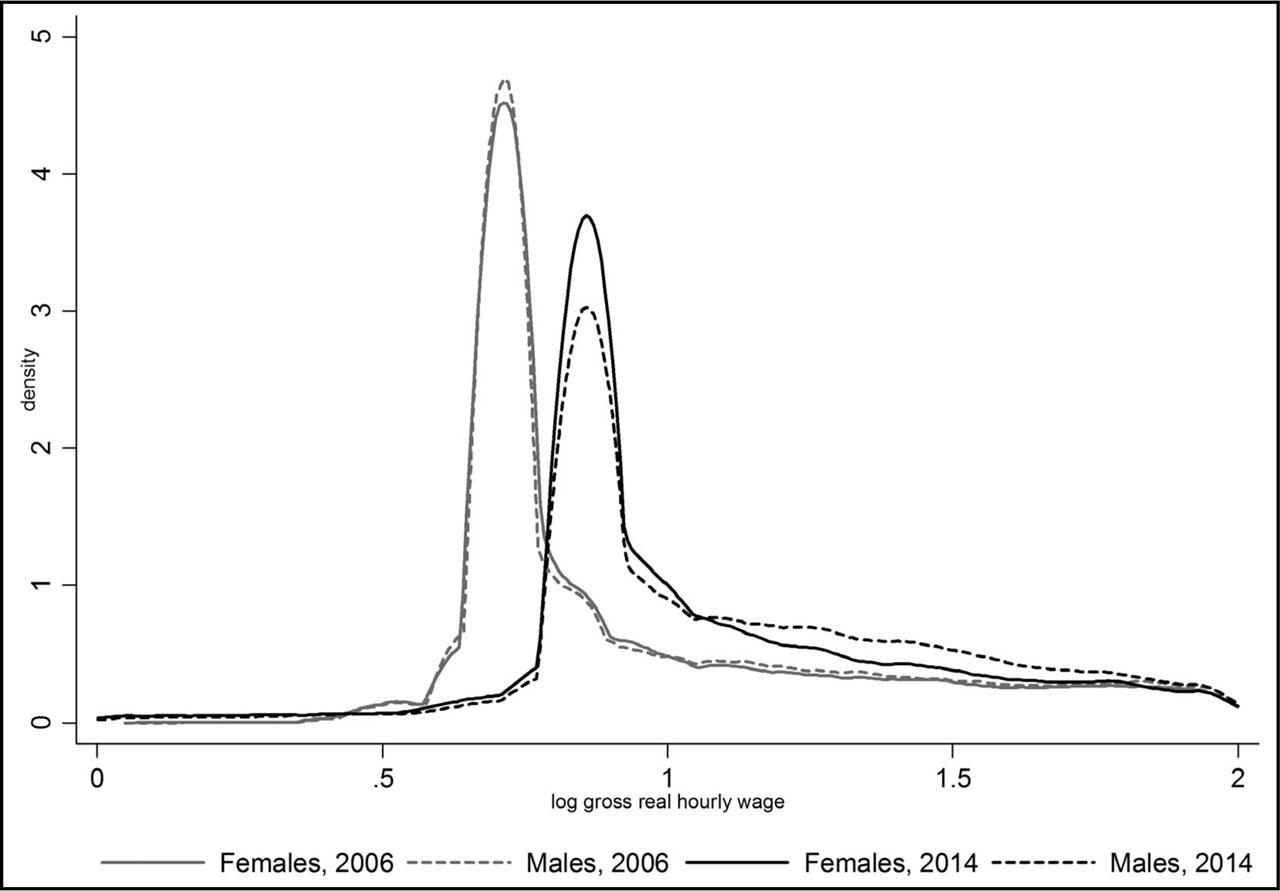
Figure 2
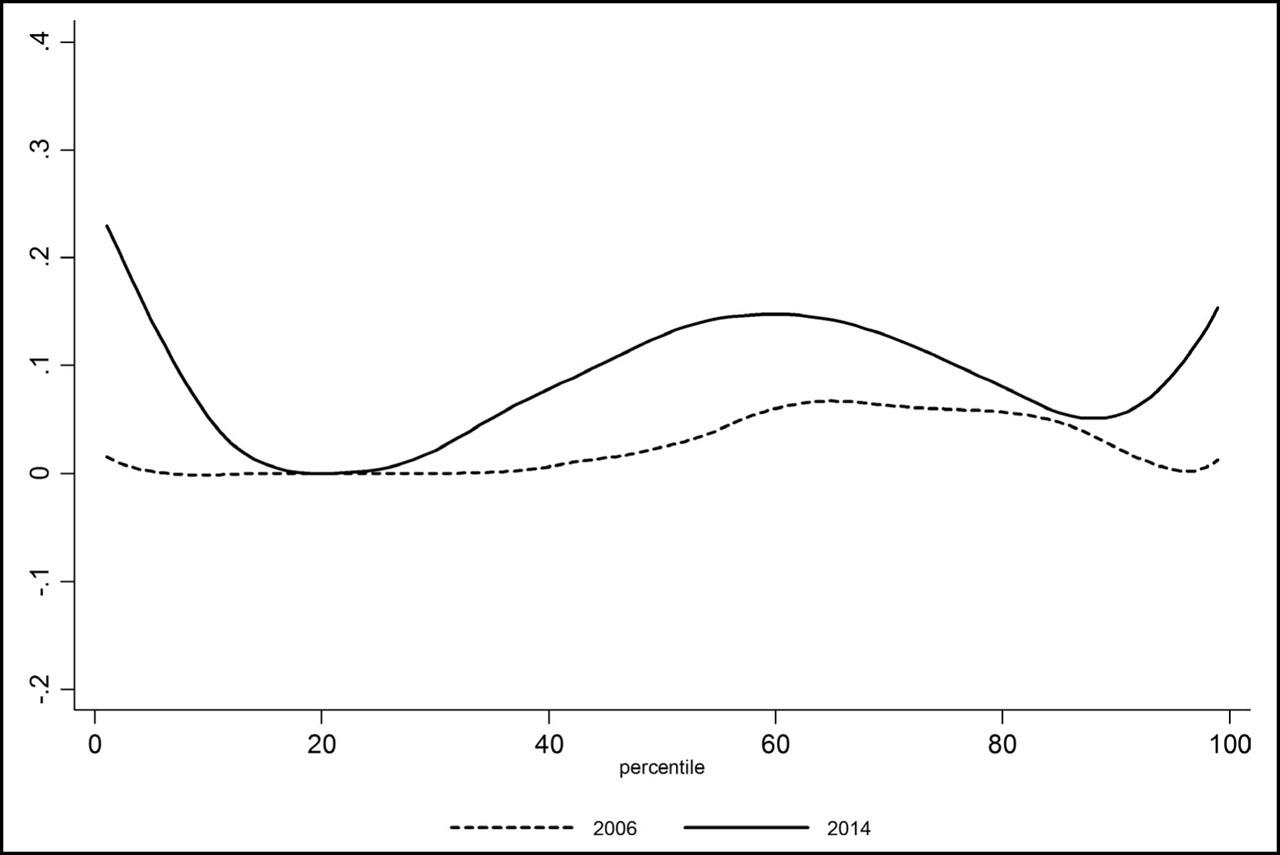
Figure 3
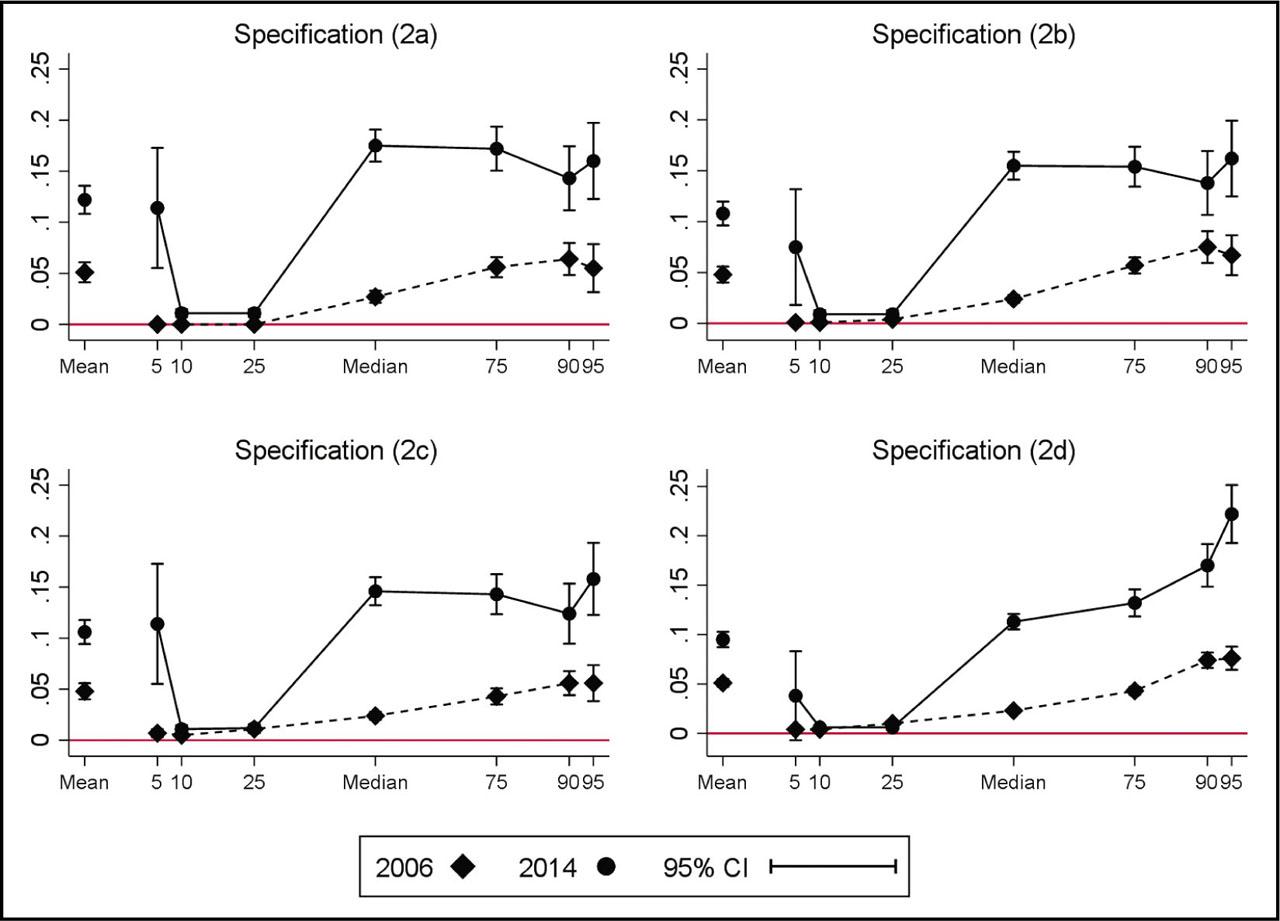
Figure 4
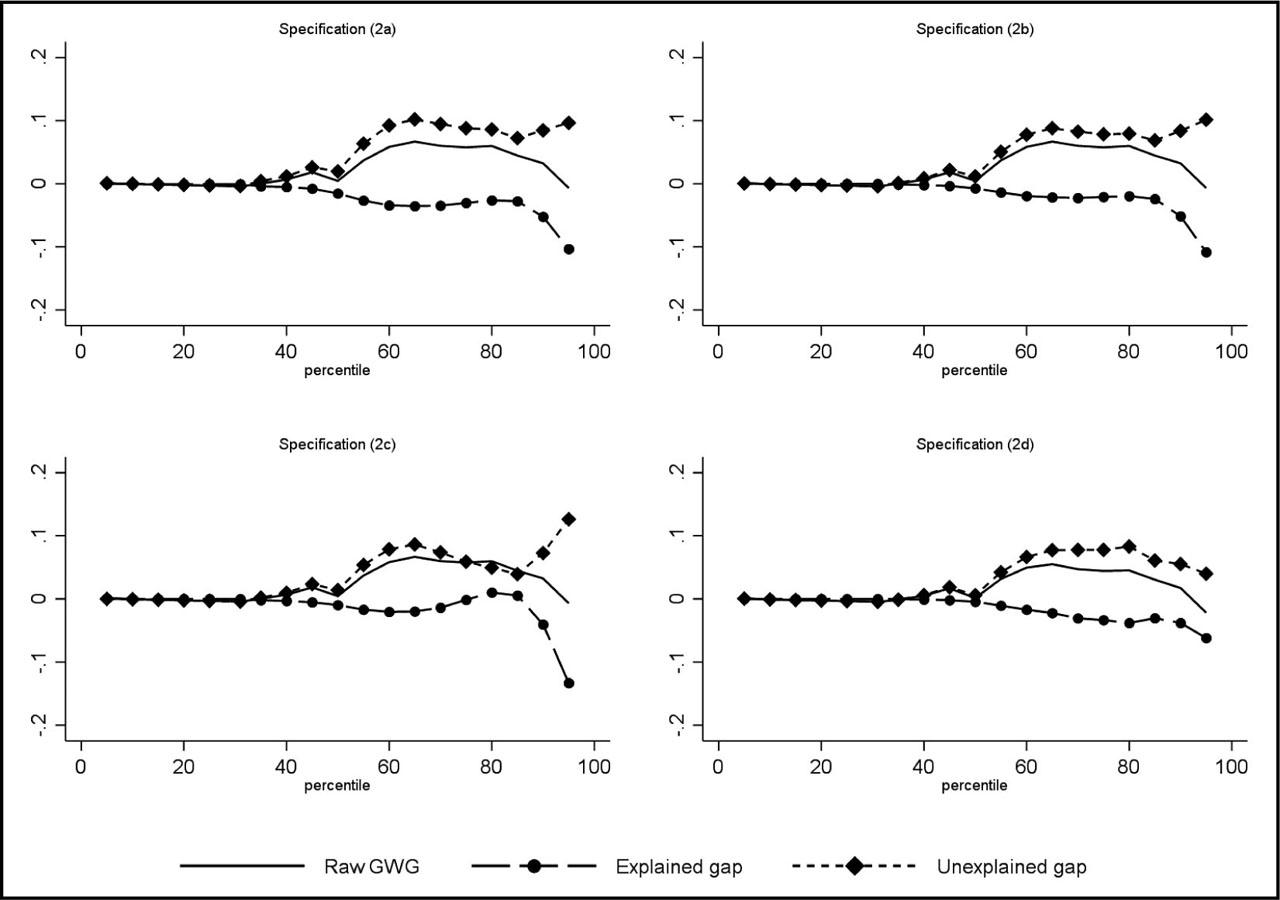
Figure 5
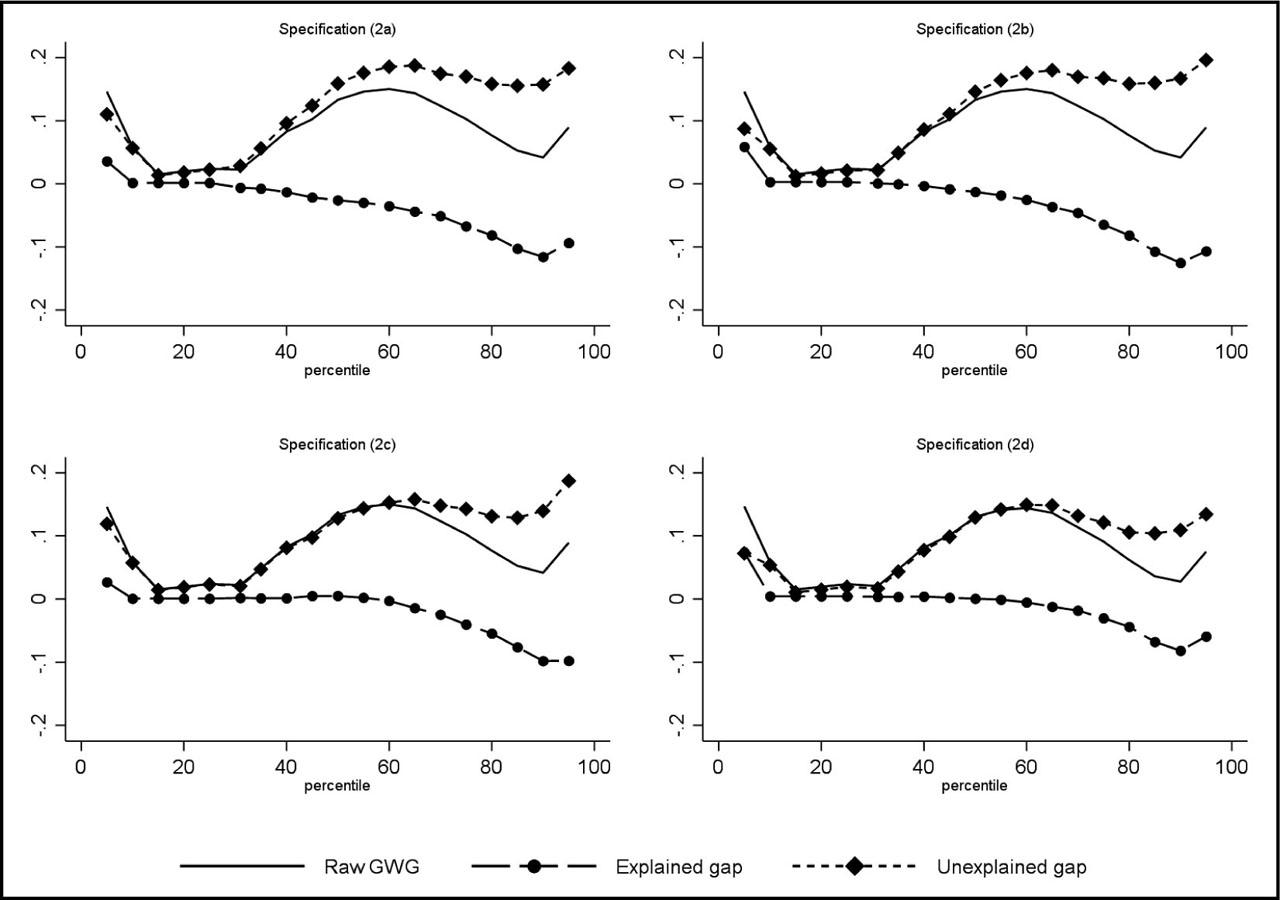
Figure 6
Figure B1
Figure B2
Raw and adjusted GWG at selected percentiles of the wage distribution
| Year and specification | RIF-OLS regressions (percentile of the wage distribution) | OLS | ||||||
|---|---|---|---|---|---|---|---|---|
| 5th | 10th | 25th | 50th | 75th | 90th | 95th | Mean | |
| 2006 | ||||||||
| (1) Raw GWG | 0.001 (0.001) | −0.000 (0.001) | −0.000 (0.001) | 0.020*** (0.005) | 0.056*** (0.016) | 0.029*** (0.016) | −0.009 (0.021) | 0.024*** (0.007) |
| (2) Adjusted GWG | ||||||||
| a. Personal characteristics | 0.001 (0.001) | 0.001 (0.001) | 0.001 (0.001) | 0.042*** (0.004) | 0.107*** (0.012) | 0.077*** (0.012) | 0.071*** (0.017) | 0.051*** (0.005) |
| b. Personal and work-related characteristics | 0.001 (0.001) | 0.001 (0.001) | 0.001 (0.001) | 0.037*** (0.004) | 0.100*** (0.010) | 0.072*** (0.012) | 0.077*** (0.017) | 0.048*** (0.004) |
| c. Personal, work-related, observed firm and observed establishment characteristics | 0.000 (0.001) | 0.001 (0.001) | 0.001 (0.001) | 0.040*** (0.004) | 0.089*** (0.009) | 0.070*** (0.011) | 0.102*** (0.016) | 0.048*** (0.004) |
| d. Personal and work-related characteristics and establishment fixed effects | 0.001* (0.000) | 0.001*** (0.000) | 0.001*** (0.000) | 0.026*** (0.002) | 0.082*** (0.006) | 0.111*** (0.008) | 0.179*** (0.012) | 0.051*** (0.002) |
| 2014 | ||||||||
| (1) Raw GWG | 0.132*** (0.031) | 0.011*** (0.002) | 0.011*** (0.002) | 0.138*** (0.010) | 0.097*** (0.015) | 0.046* (0.020) | 0.084*** (0.021) | 0.084*** (0.009) |
| (2) Adjusted GWG | ||||||||
| a. Personal characteristics | 0.114*** (0.030) | 0.011*** (0.002) | 0.011*** (0.002) | 0.175*** (0.008) | 0.172*** (0.011) | 0.143*** (0.016) | 0.160*** (0.019) | 0.122*** (0.007) |
| b. Personal and work-related characteristics | 0.075* (0.029) | 0.009*** (0.002) | 0.009*** (0.002) | 0.155*** (0.007) | 0.154*** (0.010) | 0.138*** (0.016) | 0.162*** (0.019) | 0.108*** (0.006) |
| c. Personal, work-related, observed firm and observed establishment characteristics | 0.114*** (0.030) | 0.011*** (0.002) | 0.012*** (0.002) | 0.146*** (0.007) | 0.143*** (0.010) | 0.124*** (0.015) | 0.158*** (0.018) | 0.106*** (0.006) |
| d. Personal and work-related characteristics and establishment fixed effects | 0.038 (0.023) | 0.006*** (0.001) | 0.006*** (0.001) | 0.113*** (0.004) | 0.132*** (0.007) | 0.170*** (0.011) | 0.222*** (0.015) | 0.095*** (0.004) |
Number of employees to be sampled in establishments (SES second stage of sampling) by size band of the establishment
| Establishment size band | Number of employees to be sampled |
|---|---|
| 1–19 | All |
| 20–49 | 20 |
| 50–99 | 25 |
| 100–299 | 35 |
| 250–499 | 40 |
| 500–999 | 50 |
| 1,000–2,499 | 75 |
| 2,500–4,999 | 125 |
| 5,000 and over | 150 |
List of selected gender equality policies, Turkey 2000–2018
| Year | Policy | Description |
|---|---|---|
| 2001 | Amendment to the Constitution (Article 41) | Added “based on the equality between spouses” to the previous version of the article, which stated that “Family is the foundation of the Turkish society”. |
| 2002 | New Civil Code (Law no: 4721) | Increased the legal marriage age to 18 for men (from 17) and women (from 15); established the equality of men and women in the family, including abolishment of the term “head of household” and of needing the permission of spouses to work; introduced the legal basis for the sharing of marital assets in case of divorce; granted the same heredity rights to children born out of wedlock as to those of legitimate birth. |
| 2003 | New Labor Law (Law no: 4857) | Set the legal basis for equal pay for equal work; reinforced the equal treatment principle for women and men; decreased the restrictions on temporary employment; provided a legal basis for atypical employment; lifted the ban on employment of women in night shifts of manufacturing establishments; extended paid maternity leave from 12 weeks to 16 weeks (8 weeks before and 8 weeks after childbirth); introduced breastfeeding leave to a total of one and a half hours for mothers of children below the age of one; obliged companies employing 100–150 female workers to provide comprehensive nursery rooms for children under the age of one and companies employing >150 female workers to provide comprehensive childcare centers and pre-school facilities for children under the age of six. |
| 2003 | Family Court Law (Law no: 4787) | Established Family Courts in districts with >100,000 population to enforce the Civil Code and ensure gender equality. |
| 2004 | Amendments to the Constitution (Articles 10 and 90) | Amendments to Article 10 reinforced equal rights of women and men and emphasized the responsibility of the State to ensure equality. Amendments to Article 90 ensured the supremacy of international laws (including the Convention on the Elimination of All Forms of Discrimination against Women in 1985 and the European Social Charter in 1996) in the case of a conflict between Turkish law and international treaties with regards to human rights. |
| 2005 | New Penal Code (Law no: 5237) | Defined sexual harassment in work; reinforced prohibition of gender-based discrimination. |
| 2006 | Social Insurance and General Health Insurance Act (Law no: 5510) | Merged different security systems into one structure; adopted harmonized legislation for maternity and breastfeeding leaves and for the pension plans regulating the working conditions for women. |
| 2008 | Employment Package (Law no: 5763) | Introduced a direct employment subsidy program (with a limit that corresponds to the minimum wage level) with a one-year participation period (extended to June 30, 2010, with Law 5838) by reducing the employers’ contribution to social security payment of new hires for 5 years, covering 100% of social security payments of new employees for the first year and reducing its participation by 20% each year for the following 4 years. Targeted young men (ages between 18 and 29) and women >18 who were not employed as a tax-registered workers in the preceding 6 months. |
| 2010 | Amendment to the Constitution (Article 10) | Added “Measures taken for this purpose shall not be interpreted as contrary to the principle” to Article 10. |
| 2011 | Amendments to the Labor Law (Law No. 6111) | Enforced the rules of maternity leave for women (mandatory for 16 weeks and fully paid by the social security system); introduced the right to use paid leaves for breastfeeding; ruled out terminating job contracts on grounds of pregnancy; brought new regulations for part-time work; incorporated domestic help workers into the social security system; extended maternity leave to 12 months for civil servants and 6 months for others on an unpaid basis; granted 10 days’ voluntary paid paternity leave to civil servants whose wives give birth. Extended the period (for the period between March 2011 and December 2015) and coverage (both men and women of all ages and relaxing the subsidy limit covering the total social security payment amount regardless of the wage level) of the 2008 employment subsidy program. |
| 2016 | Amendments to the Labor Law (Law no: 6663) | Introduced unpaid maternity leave to mothers as half of their weekly working hours for 60 days for the first birth, 120 days for the second birth, and 160 days for following births; introduced the right to request part time work for the period between when maternity leave ends until the beginning of the month after the child's compulsory education begins for both parents whose spouse is also working; extended the coverage of maternity leave and the right to request part-time work to couples or individuals adopting a child under 3 years’ old. |
Decomposition of the GWG at the mean
| Specification | ||||
|---|---|---|---|---|
| (2a) | (2b) | (2c) | (2d) | |
| 2006 | ||||
| Raw GWG | 0.024*** (0.006) | 0.024*** (0.006) | 0.024*** (0.006) | 0.024*** (0.006) |
| Explained gap | −0.023*** (0.004) | −0.025*** (0.004) | −0.024*** (0.005) | −0.016*** (0.001) |
| [−97.2%] | [−104.8%] | [−103.1%] | [−65.9%] | |
| Unexplained gap | 0.047*** (0.005) | 0.049*** (0.004) | 0.048*** (0.004) | 0.039*** (0.001) |
| [197.2%] | [204.8%] | [203.1%] | [165.9%] | |
| 2014 | ||||
| Raw GWG | 0.084*** (0.008) | 0.084*** (0.008) | 0.084*** (0.008) | 0.084*** (0.008) |
| Explained gap | −0.035*** (0.005) | −0.024*** (0.005) | −0.019*** (0.006) | −0.008*** (0.002) |
| [−41.9%] | [−29.1%] | [−22.8%] | [−9.0%] | |
| Unexplained gap | 0.119*** (0.007) | 0.108*** (0.006) | 0.103*** (0.006) | 0.092*** (0.003) |
| [141.9%] | [129.1%] | [122.8%] | [109.0%] | |
Sample means within establishments
| 2006 | 2014 | |||||
|---|---|---|---|---|---|---|
| All | Males | Females | All | Males | Females | |
| Personal characteristics | ||||||
| Male | 0.71 | – | – | 0.67 | – | – |
| Educational attainment | ||||||
| Primary school and below | 0.26 | 0.28 | 0.17 | 0.16 | 0.16 | 0.15 |
| Primary education and secondary school | 0.15 | 0.16 | 0.10 | 0.14 | 0.15 | 0.10 |
| High school | 0.27 | 0.26 | 0.31 | 0.32 | 0.32 | 0.33 |
| Vocational high school | 0.09 | 0.09 | 0.10 | 0.07 | 0.08 | 0.06 |
| Higher education | 0.23 | 0.22 | 0.32 | 0.31 | 0.29 | 0.37 |
| Potential labor market experience (years) | 16.68 | 17.66 | 14.25 | 17.09 | 17.74 | 15.76 |
| Work-related characteristics | ||||||
| Tenure (years) | 3.20 | 3.29 | 2.93 | 2.86 | 2.97 | 2.61 |
| Full-time | 0.99 | 0.99 | 0.99 | 0.98 | 0.98 | 0.98 |
| Permanent contract | 0.97 | 0.97 | 0.97 | 0.94 | 0.94 | 0.95 |
| Overtime work | 0.11 | 0.11 | 0.8 | 0.15 | 0.16 | 0.12 |
| Occupation distribution | ||||||
| Legislators, senior officials, and managers | 0.07 | 0.08 | 0.06 | 0.06 | 0.08 | 0.05 |
| Professionals | 0.08 | 0.07 | 0.12 | 0.10 | 0.10 | 0.13 |
| Technicians and associate professionals | 0.18 | 0.17 | 0.20 | 0.09 | 0.09 | 0.08 |
| Clerks | 0.14 | 0.01 | 0.28 | 0.17 | 0.13 | 0.28 |
| Service, shop and market sales’ workers | 0.13 | 0.14 | 0.11 | 0.26 | 0.25 | 0.26 |
| Skilled agricultural and fishery workers | 0.00 | 0.00 | 0.00 | 0.00 | 0.00 | 0.00 |
| Craft and related trade workers | 0.16 | 0.17 | 0.08 | 0.11 | 0.12 | 0.03 |
| Plant and machine operators and assemblers | 0.11 | 0.13 | 0.04 | 0.09 | 0.11 | 0.04 |
| Elementary occupations | 0.13 | 0.13 | 0.12 | 0.12 | 0.11 | 0.13 |
| Average number of employees per establishment | 19 | 14 | 5 | 17 | 12 | 5 |
Components of the BO decomposition of the mean GWG, 2006
| Specification | ||||
|---|---|---|---|---|
| (2a) | (2b) | (2c) | (2d) | |
| Raw GWG | 0.024*** (0.006) | 0.024*** (0.006) | 0.024*** (0.006) | 0.024*** (0.006) |
| Explained gap | −0.023*** (0.003) | −0.025*** (0.004) | −0.024*** (0.005) | −0.016*** (0.001) |
| [−97.2] | [−104.8%] | [−103.1%] | [−65.9%] | |
| Unexplained gap | 0.047*** (0.005) | 0.049*** (0.004) | 0.048*** (0.004) | 0.039*** (0.001) |
| Explained | [197.2] | [204.8%] | [203.1%] | [165.9%] |
| Personal characteristics | ||||
| Education | −0.138*** (0.004) | −0.119*** (0.003) | −0.106*** (0.003) | −0.067*** (0.001) |
| [−580.0%] | [−503.1%] | [−447.8%] | [−282.4%] | |
| Potential labour market experience | 0.115*** (0.003) | 0.054*** (0.002) | 0.054*** (0.002) | 0.046*** (0.001) |
| [482.8%] | [225.8%] | [227.7%] | [192.1%] | |
| Work-related characteristics | ||||
| Tenure | 0.038*** (0.002) | 0.024*** (0.002) | 0.016*** (0.000) | |
| [160.6%] | [101.1%] | [68.7%] | ||
| Permanent contract | 0.000 (0.000) | −0.000 (0.000) | −0.000*** (0.000) | |
| [0.6%] | [−0.8%] | [−0.8%] | ||
| Full-time | −0.005*** (0.001) | −0.006*** (0.001) | −0.006*** (0.000) | |
| [−20.3%] | [−23.8%] | [−24.5%] | ||
| Overtime work | 0.007*** (0.001) | 0.003*** (0.000) | −0.005*** (0.000) | |
| [31.4%] | [12.7%] | [−19.1%] | ||
| Observed firm and establishment characteristics | ||||
| Firm size | 0.001 (0.001) | |||
| [3.9%] | ||||
| Collective agreement coverage | 0.012*** (0.001) | |||
| [49.3%] | ||||
| Industry of the establishment | −0.006* (0.002) | |||
| Unexplained | [−25.5%] | |||
| Characteristics | 0.006 (0.011) | −0.010 (0.051) | −0.031 (0.051) | 0.056** (0.022) |
| [26.3%] | [−42.8%] | [−132.1%] | [237.8%] | |
| Constant | 0.041*** (0.010) | 0.059 (0.051) | 0.080 (0.052) | −0.017 (0.022) |
| [170.9%] | [247.6%] | [335.2%] | [−71.9%] | |
Raw and adjusted GWG at the mean
| Specification | Raw GWG | Adjusted GWG | |||
|---|---|---|---|---|---|
| (1) | (2a) | (2b) | (2c) | (2d) | |
| 2006 | 0.024*** (0.007) | 0.051*** (0.005) | 0.048*** (0.004) | 0.048*** (0.004) | 0.051*** (0.002) |
| 2014 | 0.084*** (0.009) | 0.122*** (0.007) | 0.108*** (0.006) | 0.106*** (0.006) | 0.095*** (0.004) |
| Personal characteristics | No | Yes | Yes | Yes | Yes |
| Work-related characteristics | No | No | Yes | Yes | Yes |
| Observed firm and establishment characteristics | No | No | No | Yes | No |
| Establishment fixed effects | No | No | No | No | Yes |
Sample means for establishments
| 2006 | 2014 | |
|---|---|---|
| Firm and establishment characteristics | ||
| Firm size | ||
| 10–49 employees | 0.57 | 0.41 |
| 50–249 employees | 0.20 | 0.16 |
| 250–499 employees | 0.08 | 0.13 |
| 500–999 employees | 0.06 | 0.13 |
| 1000+ employees | 0.10 | 0.16 |
| Collective agreement coverage of the establishment | 4.74 | 0.05 |
| Industry of the establishment | ||
| Mining and quarrying | 0.01 | 0.01 |
| Manufacturing | 0.35 | 0.24 |
| Electricity, gas, and water supply | 0.02 | 0.02 |
| Construction | 0.05 | 0.05 |
| Wholesale and retail trade | 0.24 | 0.31 |
| Hotels and restaurants | 0.05 | 0.06 |
| Transport, storage, and communication | 0.08 | 0.05 |
| Financial intermediation | 0.06 | 0.05 |
| Real estate, renting and business activities | 0.06 | 0.11 |
| Education | 0.04 | 0.03 |
| Health and social work | 0.02 | 0.03 |
| Other social and personal service activities | 0.02 | 0.04 |
| Number of establishments | 12,874 | 7,867 |
SES sample coverage by year
| Year | SESa | HLFSc | HLFS | HLFS | (3)/(2) | (4)/(3) | (1)/(4) |
|---|---|---|---|---|---|---|---|
| 2006 | 5,986,247 | 20,423,000 | 12,028,000 | 8,242,000 | 0.59 | 0.69 | 0.73 |
| 2014 | 9,651,017 | 25,932,000 | 17,125,000 | 13,777,000 | 0.66 | 0.80 | 0.70 |
Sample means across all establishments
| 2006 | 2014 | |||||
|---|---|---|---|---|---|---|
| All | Males | Females | All | Males | Females | |
| Personal characteristics | ||||||
| Educational attainment | ||||||
| Primary school and below | 0.27 | 0.31 | 0.19 | 0.17 | 0.19 | 0.15 |
| Primary education and secondary school | 0.15 | 0.16 | 0.11 | 0.15 | 0.18 | 0.11 |
| High school | 0.24 | 0.23 | 0.28 | 0.28 | 0.27 | 0.29 |
| Vocational high school | 0.10 | 0.11 | 0.09 | 0.08 | 0.10 | 0.06 |
| Higher education | 0.23 | 0.19 | 0.33 | 0.31 | 0.27 | 0.40 |
| Potential labor market experience (years) | 17.09 | 18.23 | 14.01 | 17.40 | 18.30 | 15.32 |
| Work-related characteristics | ||||||
| Tenure (years) | 3.67 | 3.92 | 3.03 | 3.18 | 3.39 | 2.70 |
| Full-time | 0.99 | 0.99 | 0.99 | 0.98 | 0.98 | 0.98 |
| Permanent contract | 0.96 | 0.96 | 0.97 | 0.93 | 0.94 | 0.93 |
| Overtime work | 0.14 | 0.15 | 0.11 | 0.20 | 0.22 | 0.15 |
| Firm and establishment characteristics | ||||||
| Firm size (number of employees) | ||||||
| 10–49 | 0.46 | 0.46 | 0.46 | 0.32 | 0.32 | 0.32 |
| 50–249 | 0.24 | 0.24 | 0.24 | 0.19 | 0.20 | 0.18 |
| 250–499 | 0.10 | 0.10 | 0.10 | 0.17 | 0.17 | 0.17 |
| 500–999 | 0.08 | 0.08 | 0.08 | 0.16 | 0.16 | 0.17 |
| 1000+ | 0.12 | 0.12 | 0.11 | 0.15 | 0.15 | 0.16 |
| Collective agreement coverage of the establishment | 0.10 | 0.12 | 0.06 | 0.10 | 0.12 | 0.08 |
| Industry of the establishment | ||||||
| Mining and quarrying | 0.01 | 0.02 | 0.01 | 0.02 | 0.02 | 0.01 |
| Manufacturing | 0.42 | 0.44 | 0.37 | 0.33 | 0.36 | 0.25 |
| Electricity, gas, and water supply | 0.03 | 0.03 | 0.01 | 0.02 | 0.02 | 0.01 |
| Construction | 0.04 | 0.05 | 0.02 | 0.04 | 0.04 | 0.02 |
| Wholesale and retail trade | 0.19 | 0.19 | 0.20 | 0.23 | 0.23 | 0.23 |
| Hotels and restaurants | 0.05 | 0.05 | 0.04 | 0.06 | 0.06 | 0.06 |
| Transport, storage, and communication | 0.07 | 0.07 | 0.06 | 0.06 | 0.06 | 0.06 |
| Financial intermediation | 0.04 | 0.03 | 0.07 | 0.04 | 0.03 | 0.06 |
| Real estate, renting and business activities | 0.06 | 0.06 | 0.07 | 0.11 | 0.10 | 0.13 |
| Education | 0.04 | 0.03 | 0.07 | 0.04 | 0.03 | 0.06 |
| Health and social work | 0.03 | 0.02 | 0.06 | 0.04 | 0.02 | 0.08 |
| Other social and personal service activities | 0.02 | 0.02 | 0.02 | 0.03 | 0.03 | 0.03 |
| Occupation | ||||||
| Legislators, senior officials, and managers | 0.06 | 0.06 | 0.05 | 0.06 | 0.06 | 0.05 |
| Professionals | 0.08 | 0.06 | 0.13 | 0.12 | 0.10 | 0.16 |
| Technicians and associate professionals | 0.17 | 0.16 | 0.21 | 0.09 | 0.10 | 0.09 |
| Clerks | 0.12 | 0.09 | 0.22 | 0.15 | 0.11 | 0.24 |
| Service workers; shop and market sales’ workers | 0.11 | 0.11 | 0.09 | 0.19 | 0.18 | 0.22 |
| Skilled agricultural and fishery workers | 0.002 | 0.003 | 0.001 | 0.001 | 0.001 | 0.001 |
| Craft and related trade workers | 0.19 | 0.21 | 0.11 | 0.13 | 0.17 | 0.05 |
| Plant and machine operators and assemblers | 0.13 | 0.15 | 0.06 | 0.13 | 0.15 | 0.07 |
| Elementary occupations | 0.14 | 0.15 | 0.13 | 0.13 | 0.12 | 0.13 |
| Region | ||||||
| Istanbul | – | – | – | 0.27 | 0.25 | 0.30 |
| West Marmara | – | – | – | 0.07 | 0.07 | 0.07 |
| Aegean | – | – | – | 0.11 | 0.11 | 0.12 |
| East Marmara | – | – | – | 0.12 | 0.12 | 0.10 |
| West Anatolia | – | – | – | 0.10 | 0.10 | 0.11 |
| Mediterranean | – | – | – | 0.09 | 0.09 | 0.08 |
| Central Anatolia | – | – | – | 0.06 | 0.06 | 0.05 |
| West Black Sea | – | – | – | 0.04 | 0.04 | 0.05 |
| East Black Sea | – | – | – | 0.04 | 0.04 | 0.05 |
| Northeast Anatolia | – | – | – | 0.02 | 0.03 | 0.02 |
| Central East Anatolia | – | – | – | 0.03 | 0.04 | 0.03 |
| Southeast Anatolia | – | – | – | 0.04 | 0.05 | 0.04 |
| Number of observations | 241,361 | 175,938 | 65,423 | 132,235 | 91,881 | 40,354 |
| Number of establishments | 12,874 | 7,867 | ||||
Sensitivity analysis, BO decomposition of the mean GWG using the female coefficients as the baseline
| Specification | ||||
|---|---|---|---|---|
| (2a) | (2b) | (2c) | (2d) | |
| 2006 | ||||
| Raw GWG | 0.024*** (0.006) | 0.024*** (0.006) | 0.024*** (0.006) | 0.024*** (0.006) |
| Explained gap | −0.041*** (0.003) | −0.031*** (0.004) | −0.032*** (0.005) | −0.012*** (0.001) |
| [−174.8%] | [−131.3%] | [−133.6%] | [−48.8%] | |
| Unexplained gap | 0.065*** (0.005) | 0.055*** (0.004) | 0.055*** (0.004) | 0.035*** (0.002) |
| [274.8%] | [231.3%] | [233.6%] | [148.8%] | |
| 2014 | ||||
| Raw GWG | 0.084*** (0.008) | 0.084*** (0.008) | 0.084*** (0.008) | 0.084*** (0.008) |
| Explained gap | −0.045*** (0.005) | −0.024*** (0.005) | −0.023*** (0.006) | 0.001 (0.002) |
| [−54.1%] | [−28.1%] | [−28.0%] | [1.7%] | |
| Unexplained gap | 0.129*** (0.007) | 0.108*** (0.006) | 0.107*** (0.006) | 0.083*** (0.003) |
| [154.1%] | [128.1%] | [128.0%] | [98.3%] | |
Sensitivity analysis, PSM estimation of the GWG
| Specification | 2006 | 2014 | ||||||
|---|---|---|---|---|---|---|---|---|
| Without occupation and industry | Treated | Controls | Difference | Robust S.E. | Treated | Controls | Difference | Robust S.E. |
| Unmatched | 1.127 | 1.151 | −0.024*** | 0.003 | 1.203 | 1.287 | −0.084*** | 0.004 |
| Matched | 1.127 | 1.155 | −0.028*** | 0.003 | 1.203 | 1.286 | −0.084*** | 0.004 |
| With industry | Treated | Controls | Difference | S.E. | Treated | Controls | Difference | S.E. |
| Unmatched | 1.127 | 1.151 | −0.024*** | 0.003 | 1.203 | 1.287 | −0.084*** | 0.004 |
| Matched | 1.127 | 1.148 | −0.021*** | 0.003 | 1.203 | 1.287 | −0.084*** | 0.005 |
| With industry and occupation | Treated | Controls | Difference | S.E. | Treated | Controls | Difference | S.E. |
| Unmatched | 1.127 | 1.151 | −0.024*** | 0.003 | 1.203 | 1.287 | −0.084*** | 0.004 |
| Matched | 1.127 | 1.146 | −0.020*** | 0.004 | 1.203 | 1.268 | −0.065*** | 0.005 |
Sensitivity analysis, adjusted GWG, 2006
| Specification | Selected percentiles of the wage distribution | OLS | ||||
|---|---|---|---|---|---|---|
| 10th | 25th | 50th | 75th | 90th | mean | |
| (2a) personal characteristics | ||||||
| Benchmark | 0.001 (0.001) | 0.001 (0.001) | 0.042*** (0.004) | 0.107*** (0.012) | 0.077*** (0.012) | 0.051*** (0.005) |
| Sample (aged 18–64 years) | 0.001 (0.001) | 0.001 (0.001) | 0.045*** (0.005) | 0.107*** (0.012) | 0.076*** (0.012) | 0.051*** (0.005) |
| Weighteda | 0.001 (0.001) | 0.001 (0.001) | 0.091*** (0.011) | 0.125*** (0.022) | 0.072* (0.029) | 0.064*** (0.010) |
| Conditional quantile regression | 0.000 (0.000) | −0.000 (0.000) | 0.027*** (0.003) | 0.056*** (0.005) | 0.064*** (0.008) | 0.051*** (0.005) |
| (2b) personal and work-related characteristics | ||||||
| Benchmark | 0.001 (0.001) | 0.001 (0.001) | 0.037*** (0.004) | 0.100*** (0.010) | 0.072*** (0.012) | 0.048*** (0.004) |
| Sample (aged 18–64 years) | 0.001 (0.001) | 0.001 (0.001) | 0.040*** (0.004) | 0.100*** (0.010) | 0.071*** (0.012) | 0.048*** (0.004) |
| Weighteda | 0.001 (0.001) | 0.001 (0.001) | 0.088*** (0.010) | 0.127*** (0.019) | 0.070** (0.025) | 0.064*** (0.008) |
| Conditional quantile regression | 0.001 (0.001) | 0.004*** (0.000) | 0.024*** (0.002) | 0.057*** (0.004) | 0.075*** (0.008) | 0.048*** (0.004) |
| Excluding overtime | 0.001 (0.001) | 0.001 (0.001) | 0.045*** (0.004) | 0.109*** (0.011) | 0.074*** (0.012) | 0.053*** (0.004) |
| Including occupation | 0.001 (0.001) | 0.001 (0.001) | 0.052*** (0.004) | 0.133*** (0.010) | 0.067*** (0.011) | 0.057*** (0.004) |
| (2c) personal, work-related, observed firm and establishment characteristics | ||||||
| Benchmark | 0.001 (0.001) | 0.001 (0.001) | 0.040*** (0.004) | 0.089*** (0.009) | 0.070*** (0.011) | 0.048*** (0.004) |
| Sample (aged 18–64 years) | 0.000 (0.001) | 0.000 (0.001) | 0.041*** (0.004) | 0.088*** (0.009) | 0.070*** (0.011) | 0.048*** (0.004) |
| Weighteda | 0.000 (0.001) | 0.000 (0.001) | 0.083*** (0.009) | 0.105*** (0.016) | 0.063** (0.022) | 0.057*** (0.007) |
| Conditional quantile regression | 0.005*** (0.001) | 0.011*** (0.002) | 0.024*** (0.002) | 0.043*** (0.004) | 0.056*** (0.006) | 0.048*** (0.004) |
| Excluding overtime | 0.001 (0.001) | 0.001 (0.001) | 0.044*** (0.004) | 0.089*** (0.009) | 0.068*** (0.011) | 0.049*** (0.004) |
| Including occupation | 0.001 (0.001) | 0.001 (0.001) | 0.048*** (0.004) | 0.101*** (0.009) | 0.053*** (0.011) | 0.048*** (0.004) |
| Including detailed industryc | −0.000 (0.001) | −0.000 (0.001) | 0.027*** (0.004) | 0.062*** (0.009) | 0.058*** (0.011) | 0.036*** (0.004) |
| (2d) personal and work-related characteristics and establishment fixed effects | ||||||
| Benchmark | 0.001*** (0.000) | 0.001*** (0.000) | 0.026*** (0.002) | 0.082*** (0.006) | 0.111*** (0.008) | 0.051*** (0.002) |
| Sample (aged 18–64 years) | 0.001*** (0.000) | 0.001*** (0.000) | 0.027*** (0.002) | 0.082*** (0.006) | 0.110*** (0.008) | 0.051*** (0.002) |
| Weighteda | 0.001*** (0.000) | 0.001*** (0.000) | 0.045*** (0.005) | 0.079*** (0.012) | 0.088*** (0.013) | 0.050*** (0.004) |
| Conditional quantile regression | 0.004*** (0.001) | 0.010*** (0.001) | 0.023*** (0.001) | 0.043*** (0.002) | 0.074*** (0.004) | 0.051*** (0.002) |
| Excluding overtime | 0.001*** (0.000) | 0.001*** (0.000) | 0.027*** (0.002) | 0.075*** (0.006) | 0.101*** (0.008) | 0.048*** (0.002) |
| Including occupation | 0.001*** (0.000) | 0.001*** (0.000) | 0.028*** (0.002) | 0.075*** (0.006) | 0.077*** (0.008) | 0.042*** (0.002) |
Variable definitions
| Variable | Type | Definition |
|---|---|---|
| Log hourly gross wage | Continuous | Constructed by the author: the monthly gross wage (the sum of monthly basic wages, overtime payments, payments for shift work/night work, and other regular payments paid to employees) in the reference montha divided by monthly paid hours (the sum of contractual working hours pertaining to basic wage and overtime hours worked) during the reference month (deflated using the Consumer Price Index base year 2003, in 2003 TRY) |
| Gender | Binary | Recoded by the author as follows: |
| Educational attainment | Categorical | The highest successfully completed level of education which the employee has received according to the International Standard Classification of Education (ISCED 97 in 2006 and ISCED 2011 in 2014). |
| Potential labor market experience | Continuous | Constructed by the author: age–years of schooling–6. Years of schooling are taken as 5 years for primary school and below, 8 years for primary education and secondary education, 11 years for high school and vocational high school, and 14 years for higher education following Cebeci (2015). |
| Tenure | Continuous | The total length of service in the firm to which the establishment belongs in the reference month (in years). |
| Full-time employment | Binary | Contractual working time. Recoded by the author as: |
| Type of employment contract | Binary | Type of employment contract of the worker. Recoded by the author as: |
| Overtime work | Binary | Constructed by the author based on the monthly hours of overtime work during the reference month. Recoded by the author as: |
| Firm size | Categorical | Size of the firm (in terms of number of employees) to which the establishment belongs. |
| Collective agreement coverage | Binary | Collective agreement coverage of the establishment. Recoded by the author as: |
| Industry | Categorical | Principal economics activity of the establishment coded according to the Statistical Classification of Economic Activities in the European Community (NACE Rev. 1.1 in 2006 and NACE Rev. 2 in 2014). Recoded by the author at section level according to NACE Rev. 2 (12 categories). |
| Occupation | Categorical | Occupation of the employee in the reference month coded according to the ISCO88 in 2006 and ISCO 08 in 2014. Recoded by the author at one-digit ISCO 08 level (9 categories) |
| Regionb | Categorical | Region of the establishment codded according to the NUTS-1 – only available in 2014 (12 categories) |
Sensitivity analysis, adjusted GWG, 2014
| Specification | Selected percentiles of the wage distribution | OLS | ||||
|---|---|---|---|---|---|---|
| 10th | 25th | 50th | 75th | 90th | Mean | |
| (2a) Personal characteristics | ||||||
| Benchmark | 0.011*** (0.002) | 0.011*** (0.002) | 0.175*** (0.008) | 0.172*** (0.011) | 0.143*** (0.016) | 0.122*** (0.007) |
| Sample (aged 18–64 years) | 0.011*** (0.002) | 0.012*** (0.002) | 0.177*** (0.008) | 0.171*** (0.011) | 0.140*** (0.016) | 0.123*** (0.007) |
| Weighteda | 0.015** (0.005) | 0.013** (0.004) | 0.140*** (0.013) | 0.132*** (0.019) | 0.064 (0.033) | 0.092*** (0.012) |
| Conditional quantile regression | 0.038*** (0.006) | 0.025*** (0.002) | 0.096*** (0.005) | 0.148*** (0.007) | 0.153*** (0.009) | 0.122*** (0.007) |
| (2b) Personal and work-related characteristics | ||||||
| Benchmark | 0.009*** (0.002) | 0.009*** (0.002) | 0.155*** (0.007) | 0.154*** (0.010) | 0.138*** (0.016) | 0.108*** (0.006) |
| Sample (aged 18–64 years) | 0.009*** (0.002) | 0.010*** (0.002) | 0.157*** (0.007) | 0.153*** (0.010) | 0.135*** (0.016) | 0.108*** (0.006) |
| Weighteda | 0.012** (0.005) | 0.011** (0.004) | 0.121*** (0.012) | 0.110*** (0.016) | 0.048 (0.033) | 0.074*** (0.011) |
| Conditional quantile regression | 0.037*** (0.005) | 0.041*** (0.003) | 0.068*** (0.004) | 0.129*** (0.007) | 0.162*** (0.008) | 0.108*** (0.006) |
| Excluding overtime | 0.010*** (0.002) | 0.010*** (0.002) | 0.164*** (0.007) | 0.152*** (0.010) | 0.126*** (0.016) | 0.111*** (0.006) |
| Including occupation | 0.011*** (0.002) | 0.011*** (0.002) | 0.154*** (0.007) | 0.153*** (0.010) | 0.113*** (0.016) | 0.103*** (0.006) |
| (2c) Personal, work-related, observed firm and establishment characteristics | ||||||
| Benchmark | 0.011*** (0.002) | 0.012*** (0.002) | 0.146*** (0.007) | 0.143*** (0.010) | 0.124*** (0.015) | 0.106*** (0.006) |
| Sample (aged 18–64 years) | 0.011*** (0.002) | 0.012*** (0.002) | 0.148*** (0.007) | 0.141*** (0.010) | 0.121*** (0.015) | 0.106*** (0.006) |
| Weighteda | 0.014*** (0.004) | 0.013*** (0.004) | 0.122*** (0.012) | 0.120*** (0.018) | 0.094** (0.032) | 0.090*** (0.012) |
| Conditional quantile regression | 0.058*** (0.006) | 0.052*** (0.004) | 0.077*** (0.004) | 0.112*** (0.006) | 0.141*** (0.008) | 0.106*** (0.006) |
| Excluding overtime | 0.012*** (0.002) | 0.012*** (0.002) | 0.149*** (0.007) | 0.136*** (0.010) | 0.109*** (0.015) | 0.105*** (0.006) |
| Including occupation | 0.012*** (0.002) | 0.012*** (0.002) | 0.138*** (0.007) | 0.125*** (0.009) | 0.081*** (0.015) | 0.092*** (0.006) |
| Including detailed industryb | 0.010*** (0.002) | 0.010*** (0.001) | 0.127*** (0.007) | 0.122*** (0.009) | 0.116*** (0.015) | 0.095*** (0.005) |
| Including regionc | 0.013*** (0.002) | 0.012*** (0.002) | 0.160*** (0.007) | 0.148*** (0.009) | 0.123*** (0.015) | 0.113*** (0.006) |
| (2d) Personal and work-related characteristics and establishment fixed effects | ||||||
| Benchmark | 0.006*** (0.001) | 0.006*** (0.001) | 0.113*** (0.004) | 0.132*** (0.007) | 0.170*** (0.011) | 0.095*** (0.004) |
| Sample (aged 18–64 years) | 0.006*** (0.001) | 0.006*** (0.001) | 0.114*** (0.004) | 0.131*** (0.007) | 0.168*** (0.011) | 0.095*** (0.004) |
| Weighteda | 0.007* (0.003) | 0.006** (0.002) | 0.103*** (0.008) | 0.119*** (0.016) | 0.150*** (0.033) | 0.089*** (0.012) |
| Conditional quantile regression | 0.030*** (0.004) | 0.039*** (0.003) | 0.061*** (0.003) | 0.099*** (0.004) | 0.147*** (0.006) | 0.095*** (0.004) |
| Excluding overtime | 0.007*** (0.001) | 0.007*** (0.001) | 0.115*** (0.004) | 0.124*** (0.007) | 0.152*** (0.011) | 0.094*** (0.004) |
| Including occupation | 0.006*** (0.001) | 0.006*** (0.001) | 0.102*** (0.004) | 0.109*** (0.007) | 0.113*** (0.011) | 0.076*** (0.004) |
Components of the BO decomposition of the mean GWG, 2014
| Specification | ||||
|---|---|---|---|---|
| (2a) | (2b) | (2c) | (2d) | |
| Raw GWG | 0.084*** (0.008) | 0.084*** (0.008) | 0.084*** (0.008) | 0.084*** (0.003) |
| Explained gap | −0.035*** (0.005) | −0.024*** (0.005) | −0.019*** (0.006) | −0.008*** (0.002) |
| [−41.9%] | [−29.1%] | [−22.8%] | [−9.0%] | |
| Unexplained gap | 0.119*** (0.007) | 0.108*** (0.006) | 0.103*** (0.006) | 0.092*** (0.003) |
| Explained | [141.9%] | [129.1%] | [122.8%] | [109.0%] |
| Personal characteristics | ||||
| Education | −0.115*** (0.005) | −0.109*** (0.005) | −0.101*** (0.004) | −0.066*** (0.002) |
| [−137.0%] | [−129.6%] | [−119.7%] | [−79.2%] | |
| Potential labour market experience | 0.080*** (0.003) | 0.051*** (0.002) | 0.054*** (0.002) | 0.045*** (0.001) |
| [95.2%] | [61.2%] | [64.9%] | [54.0%] | |
| Work-related characteristics | ||||
| Tenure | 0.028*** (0.002) | 0.023*** (0.002) | 0.017*** (0.001) | |
| [33.5%] | [27.0%] | [20.6%] | ||
| Permanent contract | 0.000 (0.001) | 0.000 (0.001) | 0.000 (0.000) | |
| [0.3%] | [0.3%] | [0.6%] | ||
| Full-time | −0.000 (0.000) | −0.000 (0.000) | −0.001*** (0.000) | |
| [−0.3%] | [−0.3%] | [−1.3%] | ||
| Overtime work | 0.005*** (0.001) | −0.001 (0.001) | −0.003*** (0.000) | |
| [5.8%] | [−1.2%] | [−3.7%] | ||
| Observed firm and establishment characteristics | ||||
| Firm size | −0.002 (0.002) | |||
| [−1.9%] | ||||
| Collective agreement coverage | 0.003*** (0.001) | |||
| [3.8%] | ||||
| Industry of the establishment | 0.004 (0.003) | |||
| Unexplained | [4.3%] | |||
| Characteristics | 0.054** (0.017) | 0.133* (0.056) | 0.072 (0.059) | 0.110** (0.033) |
| [64.0%] | [157.9%] | [85.6%] | [130.8%] | |
| Constant | 0.065*** (0.018) | −0.024 (0.057) | 0.031 (0.060) | −0.018 (0.033) |
| [77.8%] | [−28.8%] | [37.2%] | [−21.8%] | |