
Figure 1
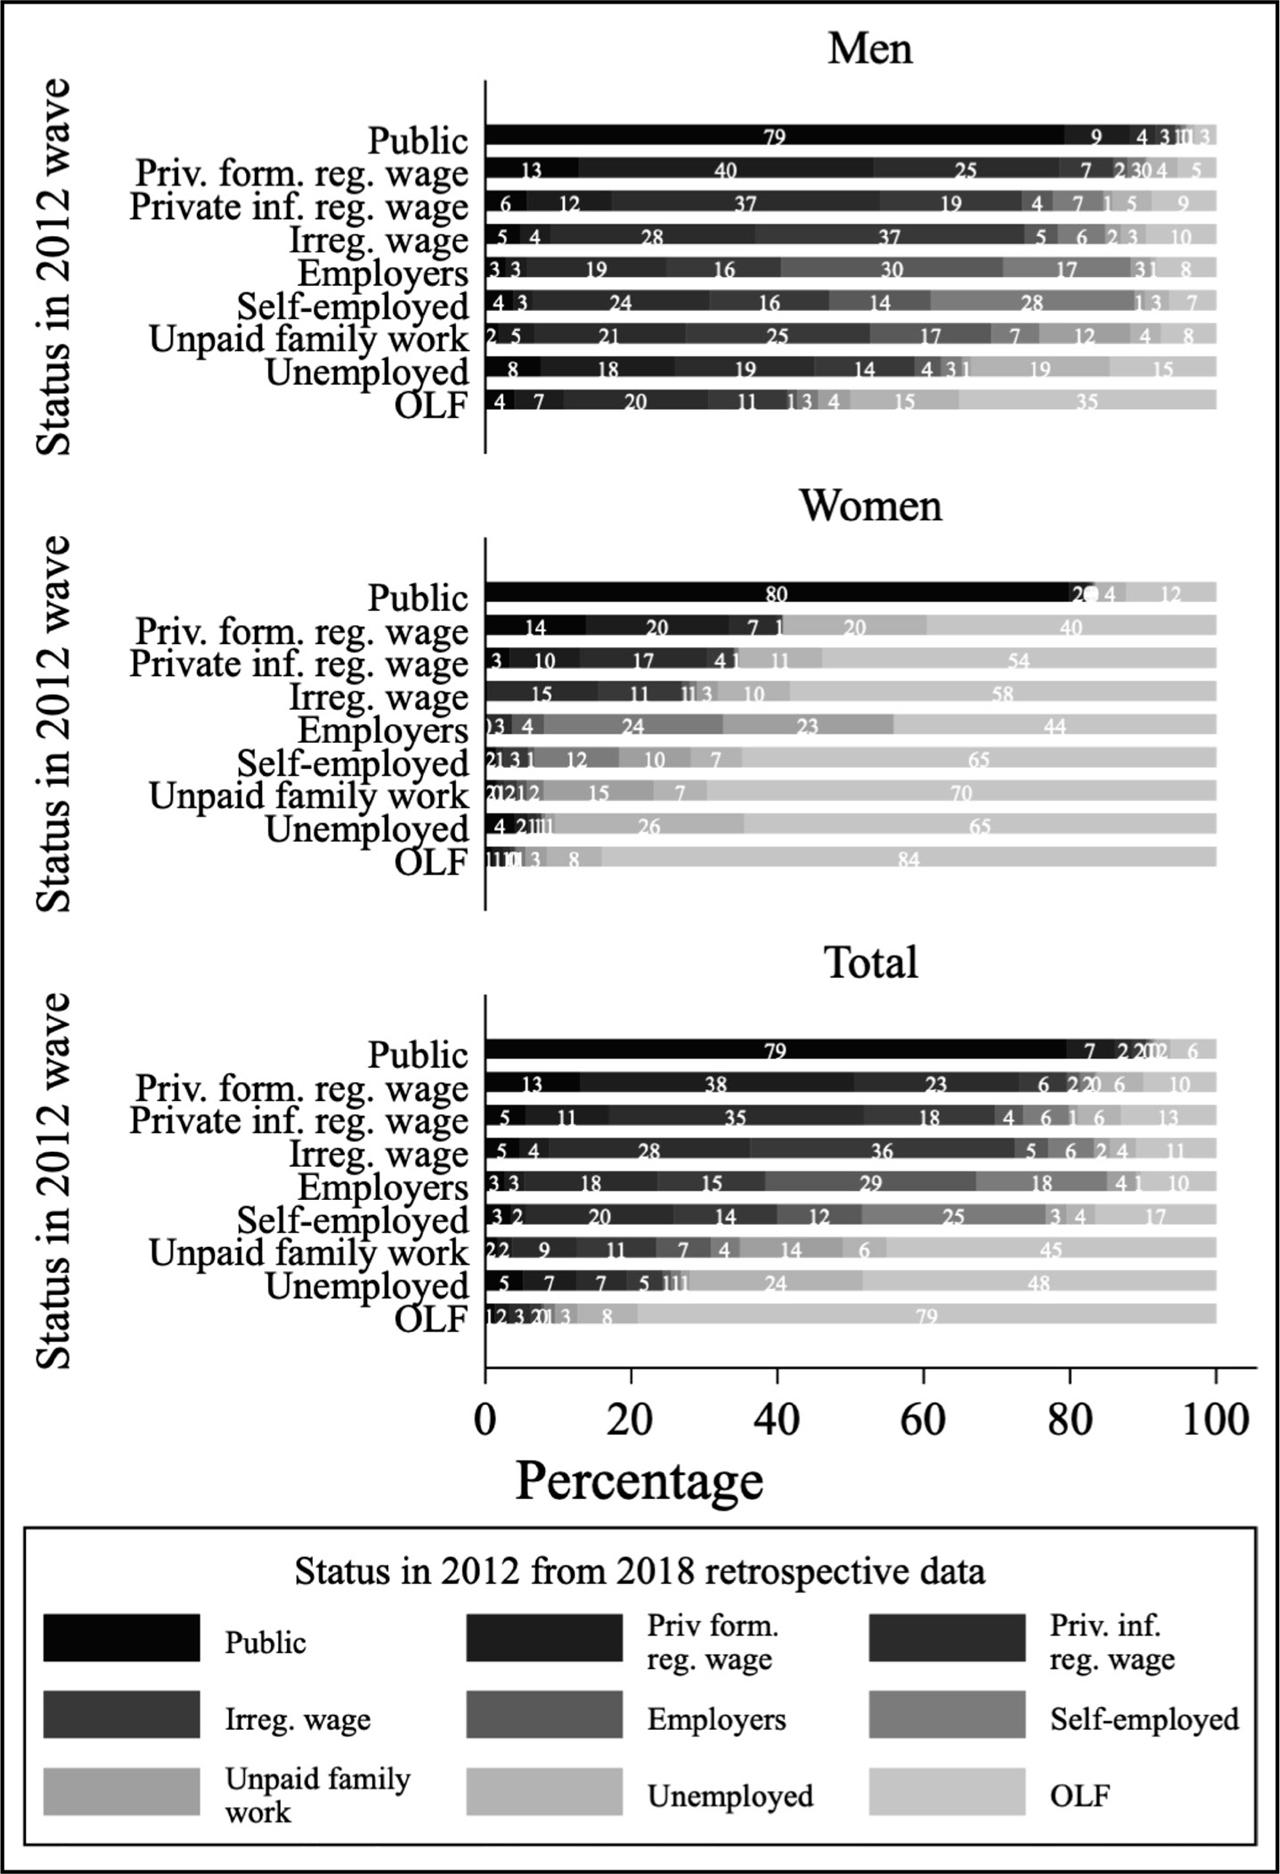
Figure 2
Figure 3
Figure 4
Figure 5
Figure 6
Figure 7
Figure 8
Figure 9
Figure 10
Figure 11
Figure 12
Figure 13
Figure 14
Figure 15
Type II attrition logit model: odds ratios for probability of attrition
| Number of household members | |
|---|---|
| No. of Children 0–5 in HH | 0.088*** (0.047) |
| No. of Children 6–14 in HH | 0.002*** (0.002) |
| No. of Males 15–64 in HH | 0.009*** (0.007) |
| No. of Females 15–64 in HH | 0.032*** (0.021) |
| No. of Males 65+ in HH | 0.038** (0.047) |
| No. of Females 65+ in HH | 0.007*** (0.009) |
| Governorate (Cairo (urban) omit.) | |
| Alex. # urban | 0.210*** (0.053) |
| Port-Said # urban | 0.012*** (0.012) |
| Suez # urban | 0.028*** (0.015) |
| Damietta # urban | 0.050*** (0.032) |
| Damietta # rural | 0.083*** (0.034) |
| Dakahlia # urban | 0.069*** (0.027) |
| Dakahlia # rural | 0.053*** (0.016) |
| Sharkia # urban | 0.122*** (0.045) |
| Sharkia # rural | 0.100*** (0.028) |
| Kalyoubia # urban | 0.300** (0.111) |
| Kalyoubia # rural | 0.094*** (0.032) |
| Kafr-Elsheikh # urban | 0.049*** (0.026) |
| Kafr-Elsheikh # rural | 0.050*** (0.017) |
| Gharbia # urban | 0.172*** (0.058) |
| Gharbia # rural | 0.098*** (0.028) |
| Menoufia # urban | 0.072*** (0.032) |
| Menoufia # rural | 0.082*** (0.033) |
| Behera # urban | 0.086*** (0.036) |
| Behera # rural | 0.083*** (0.026) |
| Ismailia # urban | 0.123*** (0.043) |
| Ismailia # rural | 0.111*** (0.035) |
| Giza # urban | 0.245*** (0.071) |
| Giza # rural | 0.348*** (0.102) |
| Beni-Suef # urban | 0.086*** (0.034) |
| Beni-Suef # rural | 0.161*** (0.044) |
| Fayoum # urban | 0.015*** (0.011) |
| Fayoum # rural | 0.112*** (0.034) |
| Menia # urban | 0.072*** (0.028) |
| Menia # rural | 0.061*** (0.017) |
| Asyout # urban | 0.095*** (0.030) |
| Asyout # rural | 0.107*** (0.029) |
| Suhag # urban | 0.050*** (0.021) |
| Suhag # rural | 0.035*** (0.011) |
| Qena # urban | 0.106*** (0.040) |
| Qena # rural | 0.086*** (0.023) |
| Aswan # urban | 0.071*** (0.027) |
| Aswan # rural | 0.074*** (0.026) |
| Luxor # urban | 0.199* (0.146) |
| Luxor # rural | 0.125*** (0.069) |
| Housing type (own or benefit omit.) | |
| Old rent | 1.036 (0.159) |
| New rent | 3.021** (1.190) |
| Head age (<15 omit.) | |
| 15–24 | 0.075* (0.099) |
| 25–34 | 0.079 (0.104) |
| 35–44 | 0.115 (0.151) |
| 45+ | 0.127 (0.171) |
| Head sex (male omit.) | |
| Female | 0.269* (0.147) |
| Head marital stat. (married omit.) | |
| Single | 0.122*** (0.033) |
| Divorced/Widow(er) | 0.293* (0.175) |
| Head marital stat. and sex int. | |
| Female # Single | 1.640 (0.526) |
| Female # Divorced/Widow(er) | 0.837 (0.587) |
| Head education (illit. omit.) | |
| Reads & Writes | 1.355 (0.350) |
| Less than Intermediate | 1.131 (0.193) |
| Intermediate | 1.142 (0.201) |
| Above Intermediate | 1.811 (0.590) |
| University | 1.498 (0.334) |
| Head labor mkt. status (Government employee omit.) | |
| Out of manpower | 1.042 (0.832) |
| Out of labor force | 1.546 (0.377) |
| Unemployed. | 1.668 (0.444) |
| Public enterp. | 1.028 (0.498) |
| Priv. formal wage | 1.755 (0.526) |
| Priv. inf. reg. wage | 1.618 (0.432) |
| Priv. irreg. wage | 1.524 (0.432) |
| Employer | 1.612 (0.645) |
| Self-emp./UFW ag. | 0.677 (0.274) |
| Self-emp./UFW non-ag. | 1.203 (0.408) |
| Wealth quintile (poorest omit.) | |
| Second | 1.278 (0.174) |
| Third | 1.122 (0.163) |
| Fourth | 1.436* (0.223) |
| Richest | 2.125*** (0.363) |
| Constant | 7218.760*** (8790.485) |
| Pseudo R-sq. | 0.223 |
| N (households) | 4598 |
Type I attrition logit model: odds ratios for probability of attrition
| Number of household members | |
|---|---|
| No. of Children 0–5 in HH | 0.938 (0.037) |
| No. of Children 6–14 in HH | 0.859*** (0.032) |
| No. of Males 15–64 in HH | 0.833*** (0.040) |
| No. of Females 15–64 in HH | 0.918 (0.045) |
| No. of Males 65+ in HH | 0.595** (0.095) |
| No. of Females 65+ in HH | 0.693** (0.090) |
| Single sex households (mixed sex omit.) | |
| All male | 1.543 (0.454) |
| All female | 1.407* (0.209) |
| Governorate (Cairo (urban) omit.) | |
| Alex. # urban | 1.811*** (0.197) |
| Port-Said # urban | 0.310** (0.114) |
| Suez # urban | 0.740 (0.156) |
| Damietta # urban | 0.654 (0.179) |
| Damietta # rural | 0.517*** (0.098) |
| Dakahlia # urban | 0.151*** (0.043) |
| Dakahlia # rural | 0.181*** (0.039) |
| Sharkia # urban | 0.628* (0.114) |
| Sharkia # rural | 0.225*** (0.047) |
| Kalyoubia # urban | 0.966 (0.168) |
| Kalyoubia # rural | 0.484*** (0.086) |
| Kafr-Elsheikh # urban | 0.414*** (0.101) |
| Kafr-Elsheikh # rural | 0.251*** (0.054) |
| Gharbia # urban | 0.830 (0.145) |
| Gharbia # rural | 0.219*** (0.048) |
| Menoufia # urban | 0.487** (0.117) |
| Menoufia # rural | 0.154*** (0.052) |
| Behera # urban | 0.287*** (0.074) |
| Behera # rural | 0.312*** (0.063) |
| Ismailia # urban | 0.658* (0.131) |
| Ismailia # rural | 0.223*** (0.052) |
| Giza # urban | 0.787 (0.123) |
| Giza # rural | 0.657* (0.117) |
| Beni-Suef # urban | 0.592** (0.117) |
| Beni-Suef # rural | 0.647* (0.118) |
| Fayoum # urban | 0.681 (0.135) |
| Fayoum # rural | 0.179*** (0.056) |
| Menia # urban | 0.314*** (0.079) |
| Menia # rural | 0.264*** (0.056) |
| Asyout # urban | 0.454*** (0.089) |
| Asyout # rural | 0.417*** (0.083) |
| Suhag # urban | 0.556** (0.114) |
| Suhag # rural | 0.137*** (0.036) |
| Qena # urban | 0.561* (0.128) |
| Qena # rural | 0.348*** (0.073) |
| Aswan # urban | 0.404*** (0.099) |
| Aswan # rural | 0.244*** (0.072) |
| Luxur # urban | 0.738 (0.266) |
| Luxur # rural | 0.427 (0.192) |
| Housing type (own or benefit omit.) | |
| Old rent | 1.352*** (0.104) |
| New rent | 2.636*** (0.272) |
| Head age (<25 omit.) | |
| 25–34 | 0.956 (0.145) |
| 35–44 | 1.012 (0.163) |
| 45–54 | 0.799 (0.138) |
| 55+ | 0.642* (0.114) |
| Head sex (male omit.) | |
| Female | 0.907 (0.160) |
| Head marital stat. (married omit.) | |
| Single | 0.392** (0.141) |
| Divorced | 0.608 (0.265) |
| Widow(er) | 1.177 (0.306) |
| Head marital stat. and sex int. | |
| Female # Single | 2.643 (1.384) |
| Female # Divorced | 2.210 (1.140) |
| Female # Widow(er) | 0.778 (0.246) |
| Head education (illit. omit.) | |
| Reads & Writes | 1.049 (0.142) |
| Less than Intermediate | 1.037 (0.100) |
| Intermediate | 1.075 (0.100) |
| Above Intermediate | 0.936 (0.154) |
| University | 1.326* (0.146) |
| Head labor mkt. status (Government employee omit.) | |
| Out of manpower | 1.589** (0.257) |
| Out of labor force | 0.974 (0.120) |
| Unemployed. | 0.848 (0.191) |
| Public enterp. | 1.133 (0.169) |
| Priv. formal wage | 1.018 (0.113) |
| Priv. inf. reg. wage | 1.065 (0.118) |
| Priv. irreg. wage | 0.872 (0.104) |
| Employer | 0.811 (0.096) |
| Self-emp./UFW ag. | 0.605 (0.181) |
| Self-emp./UFW non-ag. | 0.886 (0.111) |
| Wealth quintile (poorest omit.) | |
| Second | 0.896 (0.090) |
| Third | 0.883 (0.092) |
| Fourth | 1.045 (0.111) |
| Richest | 1.176 (0.136) |
| Constant | 0.564* (0.129) |
| Pseudo R-sq. | 0.122 |
| N (households) | 11808 |
Status of 2012 households in 2018
| Number | Percentage | |
|---|---|---|
| Initial households | 12,060 | 100.0 |
| Household located | 10,042 | 83.3 |
| Natural attrition | 252 | 2.1 |
| Household died out | 188 | 1.6 |
| Household left the country | 64 | 0.5 |
| Type I attrition | 1,766 | 14.6 |
| Household refused | 204 | 1.7 |
| Household found but not completed | 291 | 2.4 |
| Household not found | 1,271 | 10.5 |
| Type I attrition rate | 15.0 |
Status of individuals and split households in 2018, conditional on 2012 household being found
| Number | Percentage | |
|---|---|---|
| Individuals present in 2012 in original households found in 2018 | 42,340 | 100.0 |
| Individuals still in original households in 2018 | 34,325 | 81.1 |
| Individuals no longer in original households in 2018 | 8,015 | 18.9 |
| Natural attrition through death and migration or leaving sample frame | 2,171 | 5.1 |
| Individuals known to have died | 1,497 | 3.5 |
| Individuals who emigrated or left for a gov. outside scope of survey | 552 | 1.3 |
| Individuals who moved to group housing | 122 | 0.3 |
| Individual splits to form households within Egypt | 5,844 | 13.8 |
| Potential split households (individuals who split together) | 4,598 | |
| Split households found | 3,751 | 81.6 |
| Split households not found (attrited) | 847 | 18.4 |
| Type II attrition rate | 18.4 | |
| Individuals from 2012 in split households found | 4,828 | 82.6 |
| Individuals from 2012 in split households not found (attrited) | 1,016 | 17.4 |
| Total individuals from 2012 who were found | 39,153 | |
Questionnaire modules
| Household | Individual |
|---|---|
|
|
Refresher sample clusters by governorate, urban/rural location, and poor vs_ non-poor
| Governorate | Urban | Rural | Total | ||||||
|---|---|---|---|---|---|---|---|---|---|
| Poor | Non-poor | Total | Poor | Non-poor | Total | Poor | Non-poor | Total | |
| Cairo | 10 | 10 | 10 | 10 | |||||
| Alexandria | 7 | 7 | 7 | 7 | |||||
| Port Said | 1 | 1 | 1 | 1 | |||||
| Suez | 1 | 1 | 1 | 1 | |||||
| Damietta | 1 | 1 | 1 | 1 | 2 | 2 | |||
| Dakhalia | 5 | 5 | 4 | 3 | 7 | 4 | 8 | 12 | |
| Sharkia | 4 | 4 | 3 | 3 | 7 | 7 | |||
| Kalyoubia | 4 | 4 | 4 | 1 | 5 | 4 | 5 | 9 | |
| Kafr-Elsheikh | 1 | 1 | 1 | 1 | 2 | 2 | |||
| Gharbia | 2 | 2 | 2 | 2 | 4 | 4 | |||
| Menoufia | 1 | 1 | 4 | 2 | 6 | 4 | 3 | 7 | |
| Behera | 2 | 2 | 14 | 2 | 16 | 14 | 4 | 18 | |
| Ismailia | 1 | 1 | 1 | 1 | 2 | 2 | |||
| Giza | 7 | 7 | 8 | 2 | 10 | 8 | 9 | 17 | |
| Beni-Suef | 1 | 1 | 6 | 1 | 7 | 6 | 2 | 8 | |
| Fayoum | 1 | 1 | 1 | 2 | 3 | 1 | 3 | 4 | |
| Menia | 1 | 1 | 2 | 3 | 5 | 2 | 4 | 6 | |
| Asyout | 3 | 3 | 19 | 4 | 23 | 19 | 7 | 26 | |
| Suhag | 2 | 2 | 19 | 4 | 23 | 19 | 6 | 25 | |
| Qena | 2 | 2 | 15 | 5 | 20 | 15 | 7 | 22 | |
| Aswan | 2 | 2 | 3 | 2 | 5 | 3 | 4 | 7 | |
| Luxor | 1 | 1 | 1 | 1 | 2 | 1 | 2 | 3 | |
| Total | 60 | 60 | 100 | 40 | 140 | 100 | 100 | 200 | |
Individuals present in various combinations of waves, 1998–2018
| Waves present | Number | Percentage |
|---|---|---|
| In 1998 & 2006 & 2012 | 3,073 | 3.6 |
| In 1998 & 2006 | 4,143 | 4.8 |
| In 1998 only | 6,636 | 7.7 |
| In 2006 & 2012 | 2,796 | 3.2 |
| In 2006 only | 4,227 | 4.9 |
| In 2012 only | 4,164 | 4.8 |
| In 1998 & 2006 & 2012 & 2018 | 10,145 | 11.8 |
| In 2006 & 2012 & 2018 | 12,756 | 14.8 |
| In 2012 & 2018 | 16,252 | 18.8 |
| In 2018 only | 22,078 | 25.6 |
| Total | 86,270 | 100.0 |