
Table 1
Descriptive statistics (2010)
| Overall | Emerging and developing economies | Developed economies | ||||
|---|---|---|---|---|---|---|
| N | Mean | N | Mean | N | Mean | |
| A. Outcome variables | ||||||
| Unemployment rate | 121 | 0.080 | 85 | 0.076 | 36 | 0.090 |
| Employment rate | 121 | 0.584 | 85 | 0.599 | 36 | 0.548 |
| Labor force participation rate | 121 | 0.633 | 85 | 0.646 | 36 | 0.601 |
| B. Main regressors | ||||||
| Spending in ALMPs (% GDP) | 104 | 0.4832737 | 190 | 0.1215296 | 613 | 0.5953967 |
| Spending in PLMPs (% GDP) | 803 | 0.8125800 | 190 | 0.1605833 | 613 | 0.943 |
| C. Control variables | ||||||
| Primary balance | 120 | −1.801 | 84 | −1.055 | 36 | −3.544 |
| GDP growth gap | 121 | 0.034 | 85 | 0.046 | 36 | 0.005 |
| Share in low-skill employment | 121 | 0.149 | 85 | 0.170 | 36 | 0.100 |
| Share in medium-skill employment | 121 | 0.628 | 85 | 0.680 | 36 | 0.505 |
| Share in high-skill employment | 121 | 0.223 | 85 | 0.151 | 36 | 0.395 |
[i] Note: The variables are defined as described in Section 3. The number of observations and means are calculated for the year 2010, where the data are available.
[ii] ALMPs, active labor market policies; PLMPs, passive labor market policies.
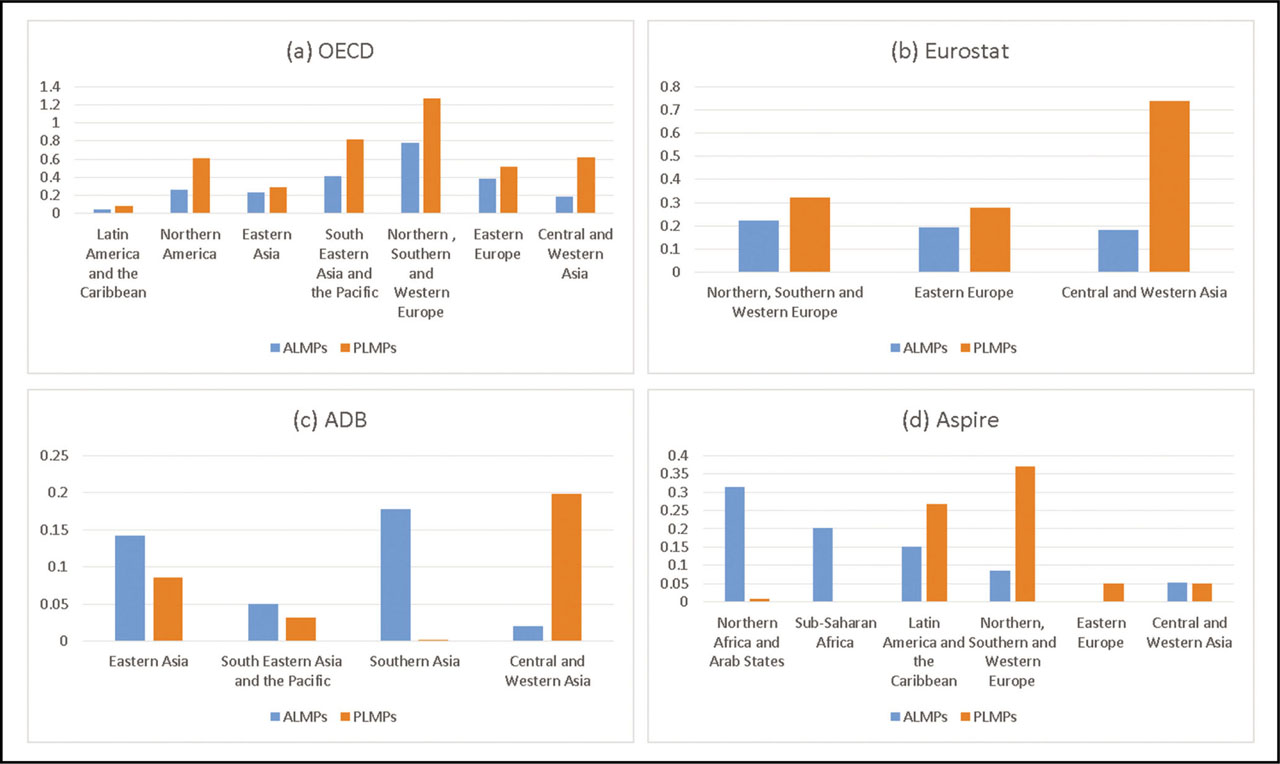
Figure 1
Average spending in ALMPs and PLMPs across regions as a share of GDP.
Note: Authors’ calculations based on different data sources as reported in Section 2. ALMPs, active labor market policies; ADB, Asian Development Bank; PLMPs, passive labor market policies.
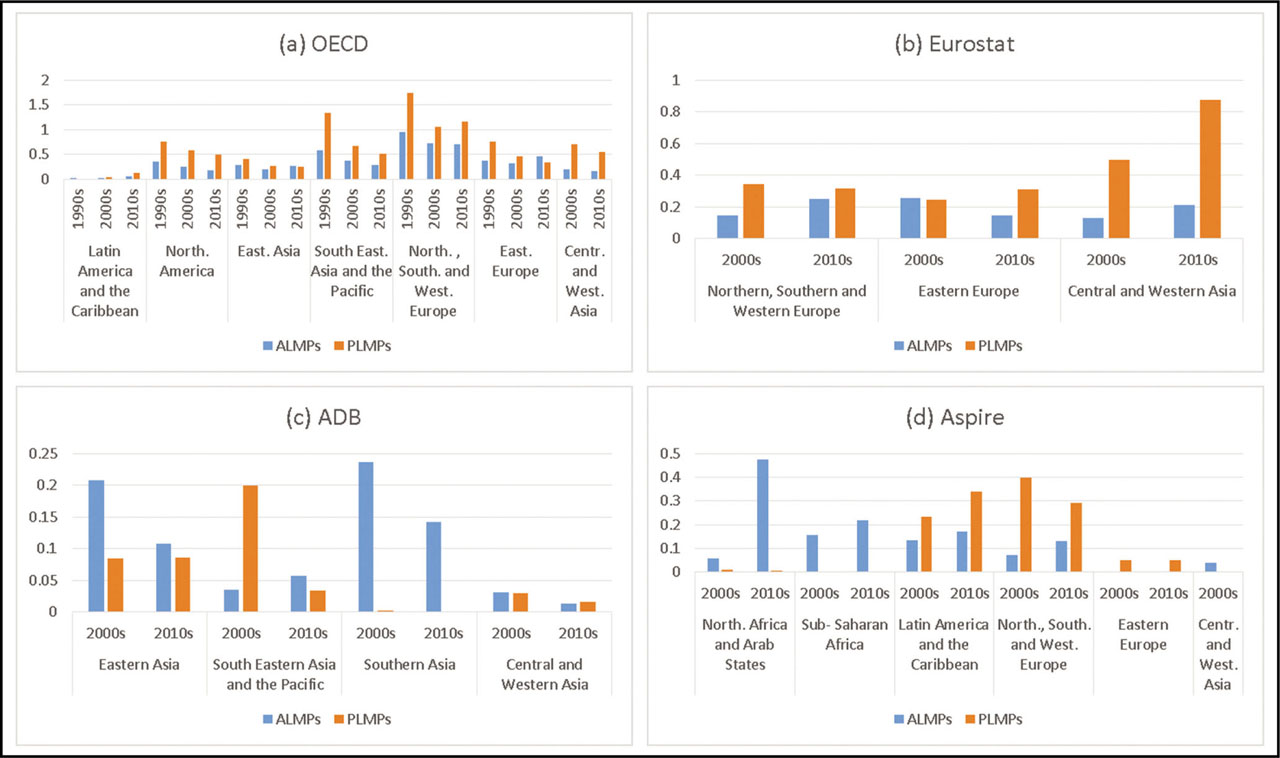
Figure 2
Spending in ALMPs and PLMPs over regions and decades as a share of GDP.
Note: Authors’ calculations based on different data sources as reported in Section 2. ALMPs, active labor market policies; PLMPs, passive labor market policies.
Table 2
Results for the unemployment rate, employment-to-population ratio, and labor force participation rate estimated with OLS
| (1) | (2) | (3) | (4) | (5) | (6) | |
|---|---|---|---|---|---|---|
| Unemployment rate | Employment rate | Labor force participation rate | ||||
| Spending in ALMPs (% GDP) | −0.036*** (0.005) | −0.013** (0.006) | 0.054*** (0.008) | 0.020** (0.009) | 0.035*** (0.006) | 0.012 (0.008) |
| Spending in PLMPs (% GDP) | 0.032*** (0.003) | 0.049*** (0.005) | −0.029*** (0.004) | −0.054*** (0.005) | −0.012*** (0.003) | −0.029*** (0.004) |
| Interaction | −0.020*** (0.004) | 0.030*** (0.005) | 0.021*** (0.004) | |||
| Constant | 0.058*** (0.004) | 0.044*** (0.005) | 0.540*** (0.005) | 0.561*** (0.006) | 0.574*** (0.004) | 0.588*** (0.005) |
| Controls | No | No | No | No | No | No |
| Country trend | Yes | Yes | Yes | Yes | Yes | Yes |
| Year FE | Yes | Yes | Yes | Yes | Yes | Yes |
| Observations | 932 | 932 | 932 | 932 | 932 | 932 |
[i] Note: The presented statistics are coefficient estimates and robust standard errors in parentheses for the panel model outlined in Section 5.
[iii] ALMPs, active labor market policies; PLMPs, passive labor market policies.
Table 3
Results of the first-stage equation
| (1) | (2) | (3) | |
|---|---|---|---|
| Spending in ALMPs | Spending in PLMPs | Interaction | |
| Eurostat | −0.293*** (0.027) | −0.325*** (0.052) | −0.398*** (0.040) |
| ADB | −0.216*** (0.046) | −0.186** (0.079) | 0.191** (0.096) |
| ASPIRE | 0.413 (0.081) | 1.101*** (0.159) | 1.544*** (0.211) |
| F statistic | 11.29 | 17.36 | 49.01 |
| Observations | 932 | 932 | 932 |
[i] Note: The presented statistics are coefficient estimates and robust standard errors in parentheses for the first-stage regression of the 2SLS model outlined in Section 5.
[ii] ***, **, * indicate significance at the 1%, 5%, 10% significance level. The F-statistic reported in the Sanderson-Windmeijer multivariate F-statistic.
[iii] ALMPs, active labor market policies; ADB, Asian Development Bank; PLMPs, passive labor market policies.
Table 4
Results for the unemployment rate, employment-to-population ratio, and labor force participation rate estimated with 2SLS
| (1) | (2) | (3) | (4) | (5) | (6) | |
|---|---|---|---|---|---|---|
| Unemployment rate | Employment rate | Labor force participation rate | ||||
| Spending in ALMPs (% GDP) | 0.015 (0.047) | −0.035 (0.045) | 0.221** (0.093) | 0.412** (0.181) | 0.230** (0.091) | 0.407** (0.180) |
| Spending in PLMPs (% GDP) | 0.018 (0.025) | 0.092*** (0.035) | −0.158*** (0.052) | −0.444*** (0.127) | −0.149*** (0.051) | −0.413*** (0.126) |
| Interaction | −0.044** (0.018) | 0.170*** (0.053) | 0.157*** (0.051) | |||
| Constant | 0.040*** (0.008) | 0.031*** (0.009) | 0.581*** (0.016) | 0.613*** (0.024) | 0.605*** (0.014) | 0.635*** (0.023) |
| Controls | No | No | No | No | No | No |
| Country trend | Yes | Yes | Yes | Yes | Yes | Yes |
| Year FE | Yes | Yes | Yes | Yes | Yes | Yes |
| Observations | 932 | 932 | 932 | 932 | 932 | 932 |
[i] Note: The presented statistics are coefficient estimates and robust standard errors in parentheses for the panel model outlined in Section 5. The spending in ALMPs and spending in PLMPs variables are instrumented by its source.
[iii] ALMPs, active labor market policies; PLMPs, passive labor market policies.
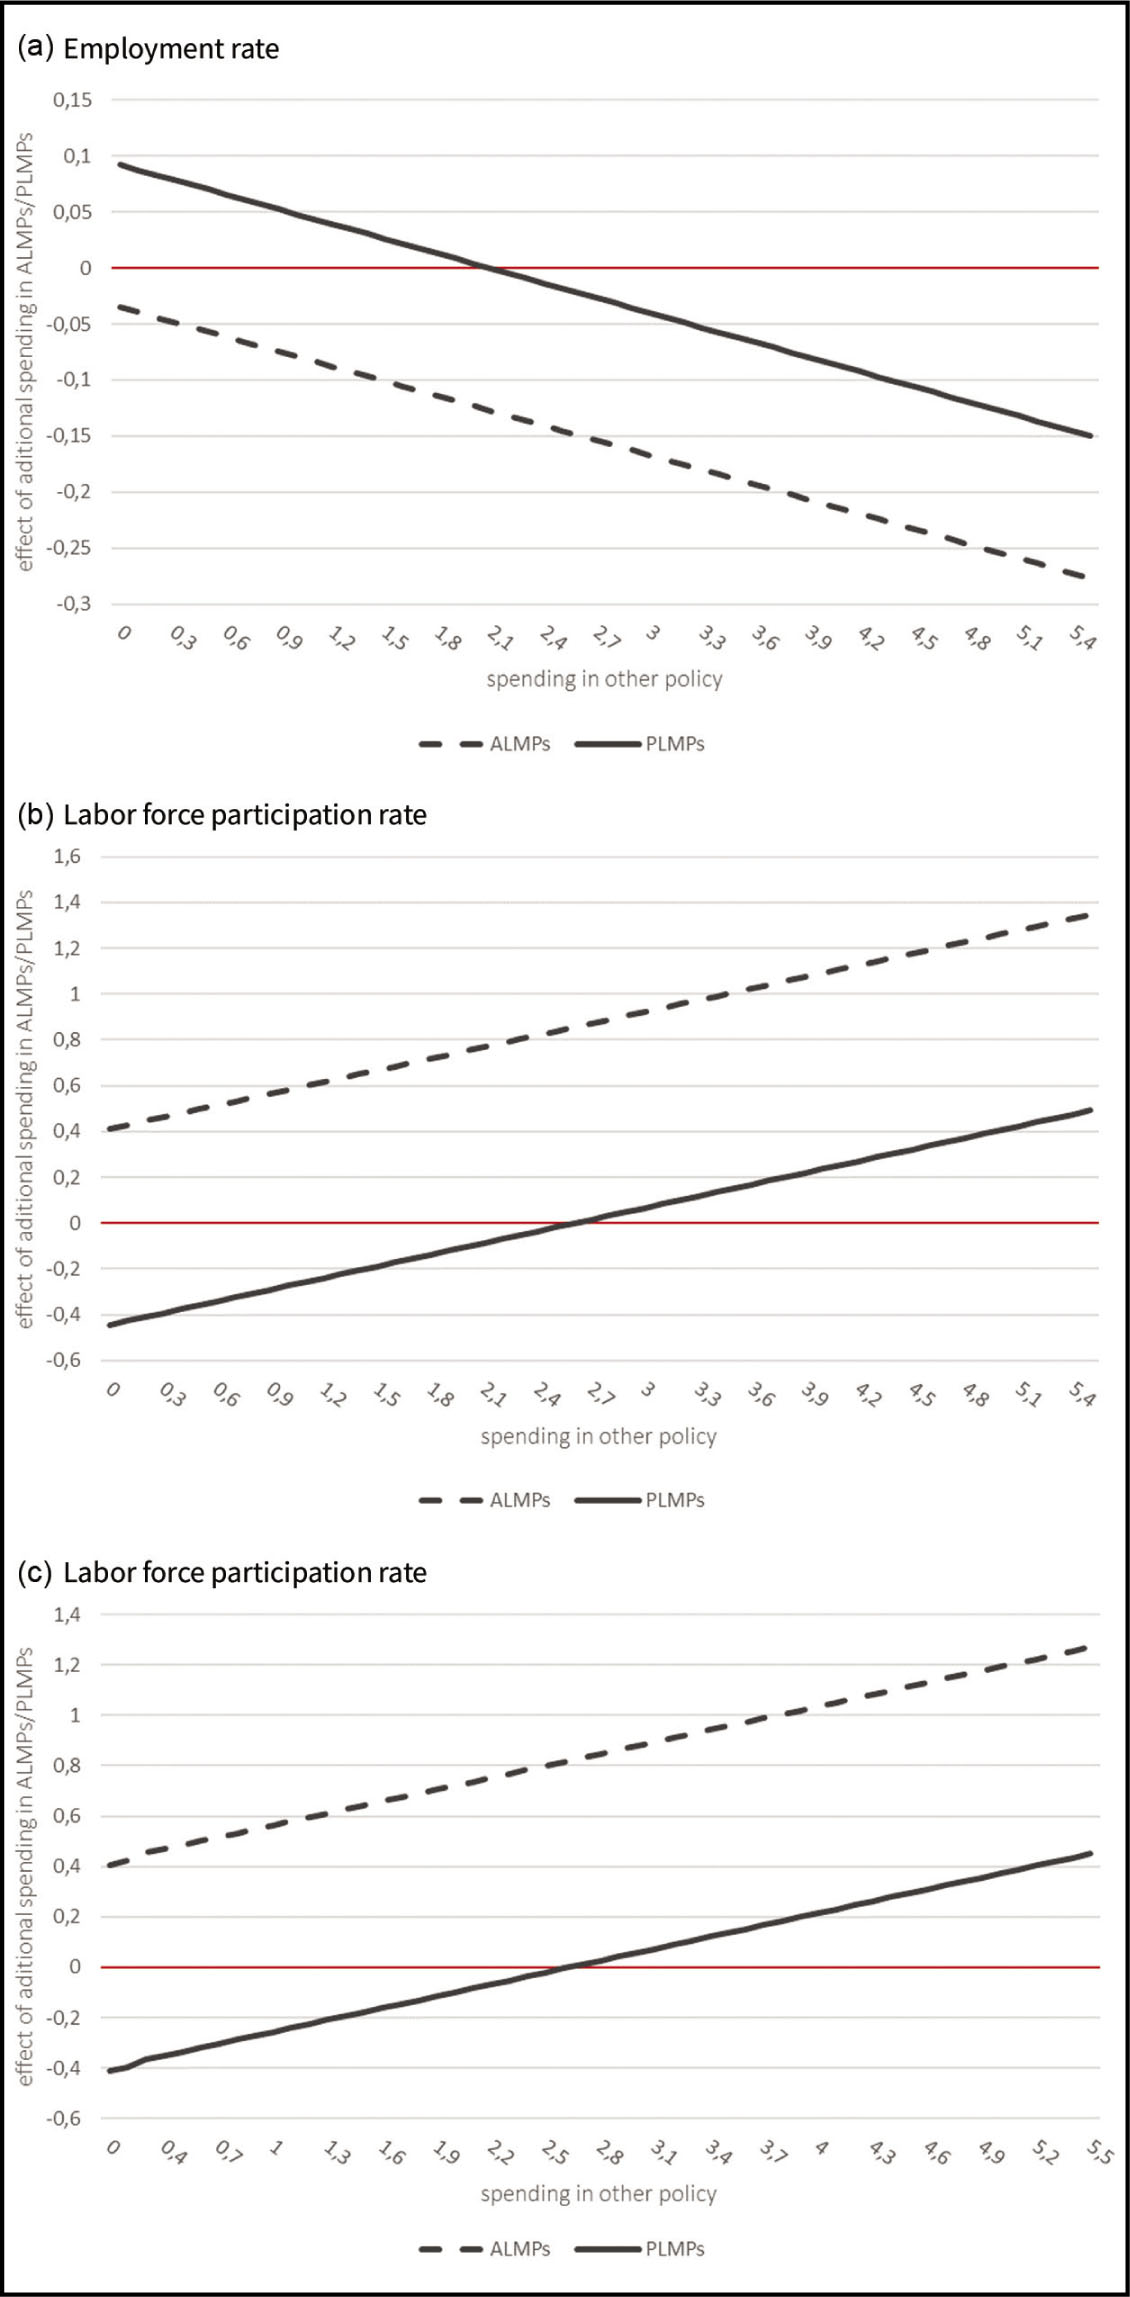
Figure 3
The effect of one additional unit spending on ALMPs (PLMPs) given spending on PLMPs. (a) Unemployment rate. (b) Employment rate.
Note: The presented statistics are coefficient estimates for the panel mode outlined in Section 5. ALMPs, active labor market policies; PLMPs, passive labor market policies.
Table 5
Results for the robustness test including additional controls
| (1) | (2) | (3) | (4) | (5) | (6) | |
|---|---|---|---|---|---|---|
| Unemployment rate | Employment rate | Labor force participation rate | ||||
| Spending in ALMPs (% GDP) | −0.022 (0.073) | −0.070 (0.078) | 0.337* (0.180) | 0.558 (0.342) | 0.323* (0.172) | 0.531 (0.331) |
| Spending in PLMPs (% GDP) | 0.037 (0.035) | 0.121** (0.050) | −0.196** (0.090) | −0.587*** (0.199) | −0.173** (0.086) | −0.540*** (0.191) |
| Interaction | −0.049* (0.026) | 0.226*** (0.078) | 0.212*** (0.073) | |||
| Constant | −0.022 (0.073) | −0.070 (0.078) | 0.337* (0.180) | 0.558 (0.342) | 0.323* (0.172) | 0.531 (0.331) |
| Controls | Yes | Yes | Yes | Yes | Yes | Yes |
| Country trend | Yes | Yes | Yes | Yes | Yes | Yes |
| Year FE | Yes | Yes | Yes | Yes | Yes | Yes |
| Observations | 871 | 871 | 871 | 871 | 871 | 871 |
[i] Note: The presented statistics are coefficient estimates and robust standard errors in parentheses for the robustness analysis outlined in Section 6.2. The spending on ALMPs and spending on PLMPs variables are instrumented by its source.
[iii] ALMPs, active labor market policies; PLMPs, passive labor market policies.
Table 6
Results for the robustness test using the lagged value of spending as an instrument
| (1) | (2) | (3) | (4) | (5) | (6) | |
|---|---|---|---|---|---|---|
| Unemployment rate | Employment rate | Labor force participation rate | ||||
| Spending in ALMPs (% GDP) | −0.016** (0.008) | 0.033*** (0.010) | 0.011 (0.008) | −0.026*** (0.010) | 0.003 (0.005) | −0.006 (0.006) |
| Spending in PLMPs (% GDP) | 0.044*** (0.005) | 0.085*** (0.007) | −0.028*** (0.004) | −0.059*** (0.006) | −0.002 (0.003) | −0.010** (0.005) |
| Interaction | −0.037*** (0.005) | 0.028*** (0.005) | 0.007** (0.003) | |||
| Constant | 0.131*** (0.022) | 0.077*** (0.024) | 0.621*** (0.024) | 0.663*** (0.026) | 0.703*** (0.019) | 0.714*** (0.020) |
| Controls | No | No | No | No | No | No |
| Country trend | Yes | Yes | Yes | Yes | Yes | Yes |
| Year FE | Yes | Yes | Yes | Yes | Yes | Yes |
| Observations | 803 | 803 | 803 | 803 | 803 | 803 |
[i] Note: The presented statistics are coefficient estimates and robust standard errors in parentheses for the robustness analysis outlined in Section 6.2. The spending on ALMPs and spending on PLMPs variables are instrumented by its lagged values.
[iii] ALMPs, active labor market policies; PLMPs, passive labor market policies.
Table 7
Results for the robustness test excluding the crisis years
| (1) | (2) | (3) | (4) | (5) | (6) | |
|---|---|---|---|---|---|---|
| Unemployment rate | Employment rate | Labor force participation rate | ||||
| Spending in ALMPs (% GDP) | 0.071 (0.083) | 0.050 (0.068) | 0.206 (0.138) | 0.539 (0.386) | 0.240* (0.132) | 0.587 (0.395) |
| Spending in PLMPs (% GDP) | 0.004 (0.036) | 0.025 (0.055) | −0.117** (0.059) | −0.442* (0.252) | −0.112* (0.057) | −0.450* (0.257) |
| Interaction | −0.010 (0.030) | 0.156* (0.093) | 0.162* (0.095) | |||
| Constant | 0.006 (0.018) | 0.007 (0.016) | 0.550*** (0.031) | 0.537*** (0.056) | 0.554*** (0.029) | 0.541*** (0.057) |
| Controls | No | No | No | No | No | No |
| Country trend | Yes | Yes | Yes | Yes | Yes | Yes |
| Year FE | Yes | Yes | Yes | Yes | Yes | Yes |
| Observations | 576 | 576 | 576 | 576 | 576 | 576 |
[i] Note: The presented statistics are coefficient estimates and robust standard errors in parentheses for the robustness analysis outlined in Section 6.2. The spending on ALMPs and spending on PLMPs variables are instrumented by its source.
[iii] ALMPs, active labor market policies; PLMPs, passive labor market policies.
Table 8
Results for the heterogeneity analysis by development status estimated using 2SLS
| (1) | (2) | (3) | (4) | (5) | (6) | |
|---|---|---|---|---|---|---|
| Unemployment rate | Employment rate | Labor force participation rate | ||||
| Spending in ALMPs (% GDP) | 0.105** (0.041) | 0.136*** (0.042) | 0.097 (0.065) | 0.216** (0.108) | 0.175** (0.072) | 0.276** (0.124) |
| Spending in PLMPs (% GDP) | −0.036 (0.023) | −0.001 (0.030) | −0.093** (0.043) | −0.301*** (0.087) | −0.127*** (0.046) | −0.319*** (0.096) |
| Interaction | −0.024 (0.020) | 0.137*** (0.039) | 0.133*** (0.043) | |||
| Spending in ALMPs x Developing | −0.072 (0.046) | −0.041 (0.045) | −0.214*** (0.071) | −0.408*** (0.118) | −0.278*** (0.079) | −0.437*** (0.136) |
| Spending in PLMPs x Developing | 0.159*** (0.035) | 0.243*** (0.053) | −0.031 (0.051) | 0.106 (0.107) | 0.054 (0.052) | 0.214* (0.116) |
| Interaction x Developing | −0.631*** (0.186) | 0.264 (0.193) | 0.026 (0.156) | |||
| Constant | 0.046*** (0.008) | 0.046 (0.031) | 0.648*** (0.068) | 0.678*** (0.105) | 0.722*** (0.074) | 0.741*** (0.114) |
| Controls | No | No | No | No | No | No |
| Country trend | Yes | Yes | Yes | Yes | Yes | Yes |
| Year FE | Yes | Yes | Yes | Yes | Yes | Yes |
| Observations | 932 | 932 | 932 | 932 | 932 | 932 |
[i] Note: The presented statistics are coefficient estimates and robust standard errors in parentheses for the robustness analysis outlined in Section 6.2. The spending on ALMPs and spending on PLMPs variables are instrumented by its source.
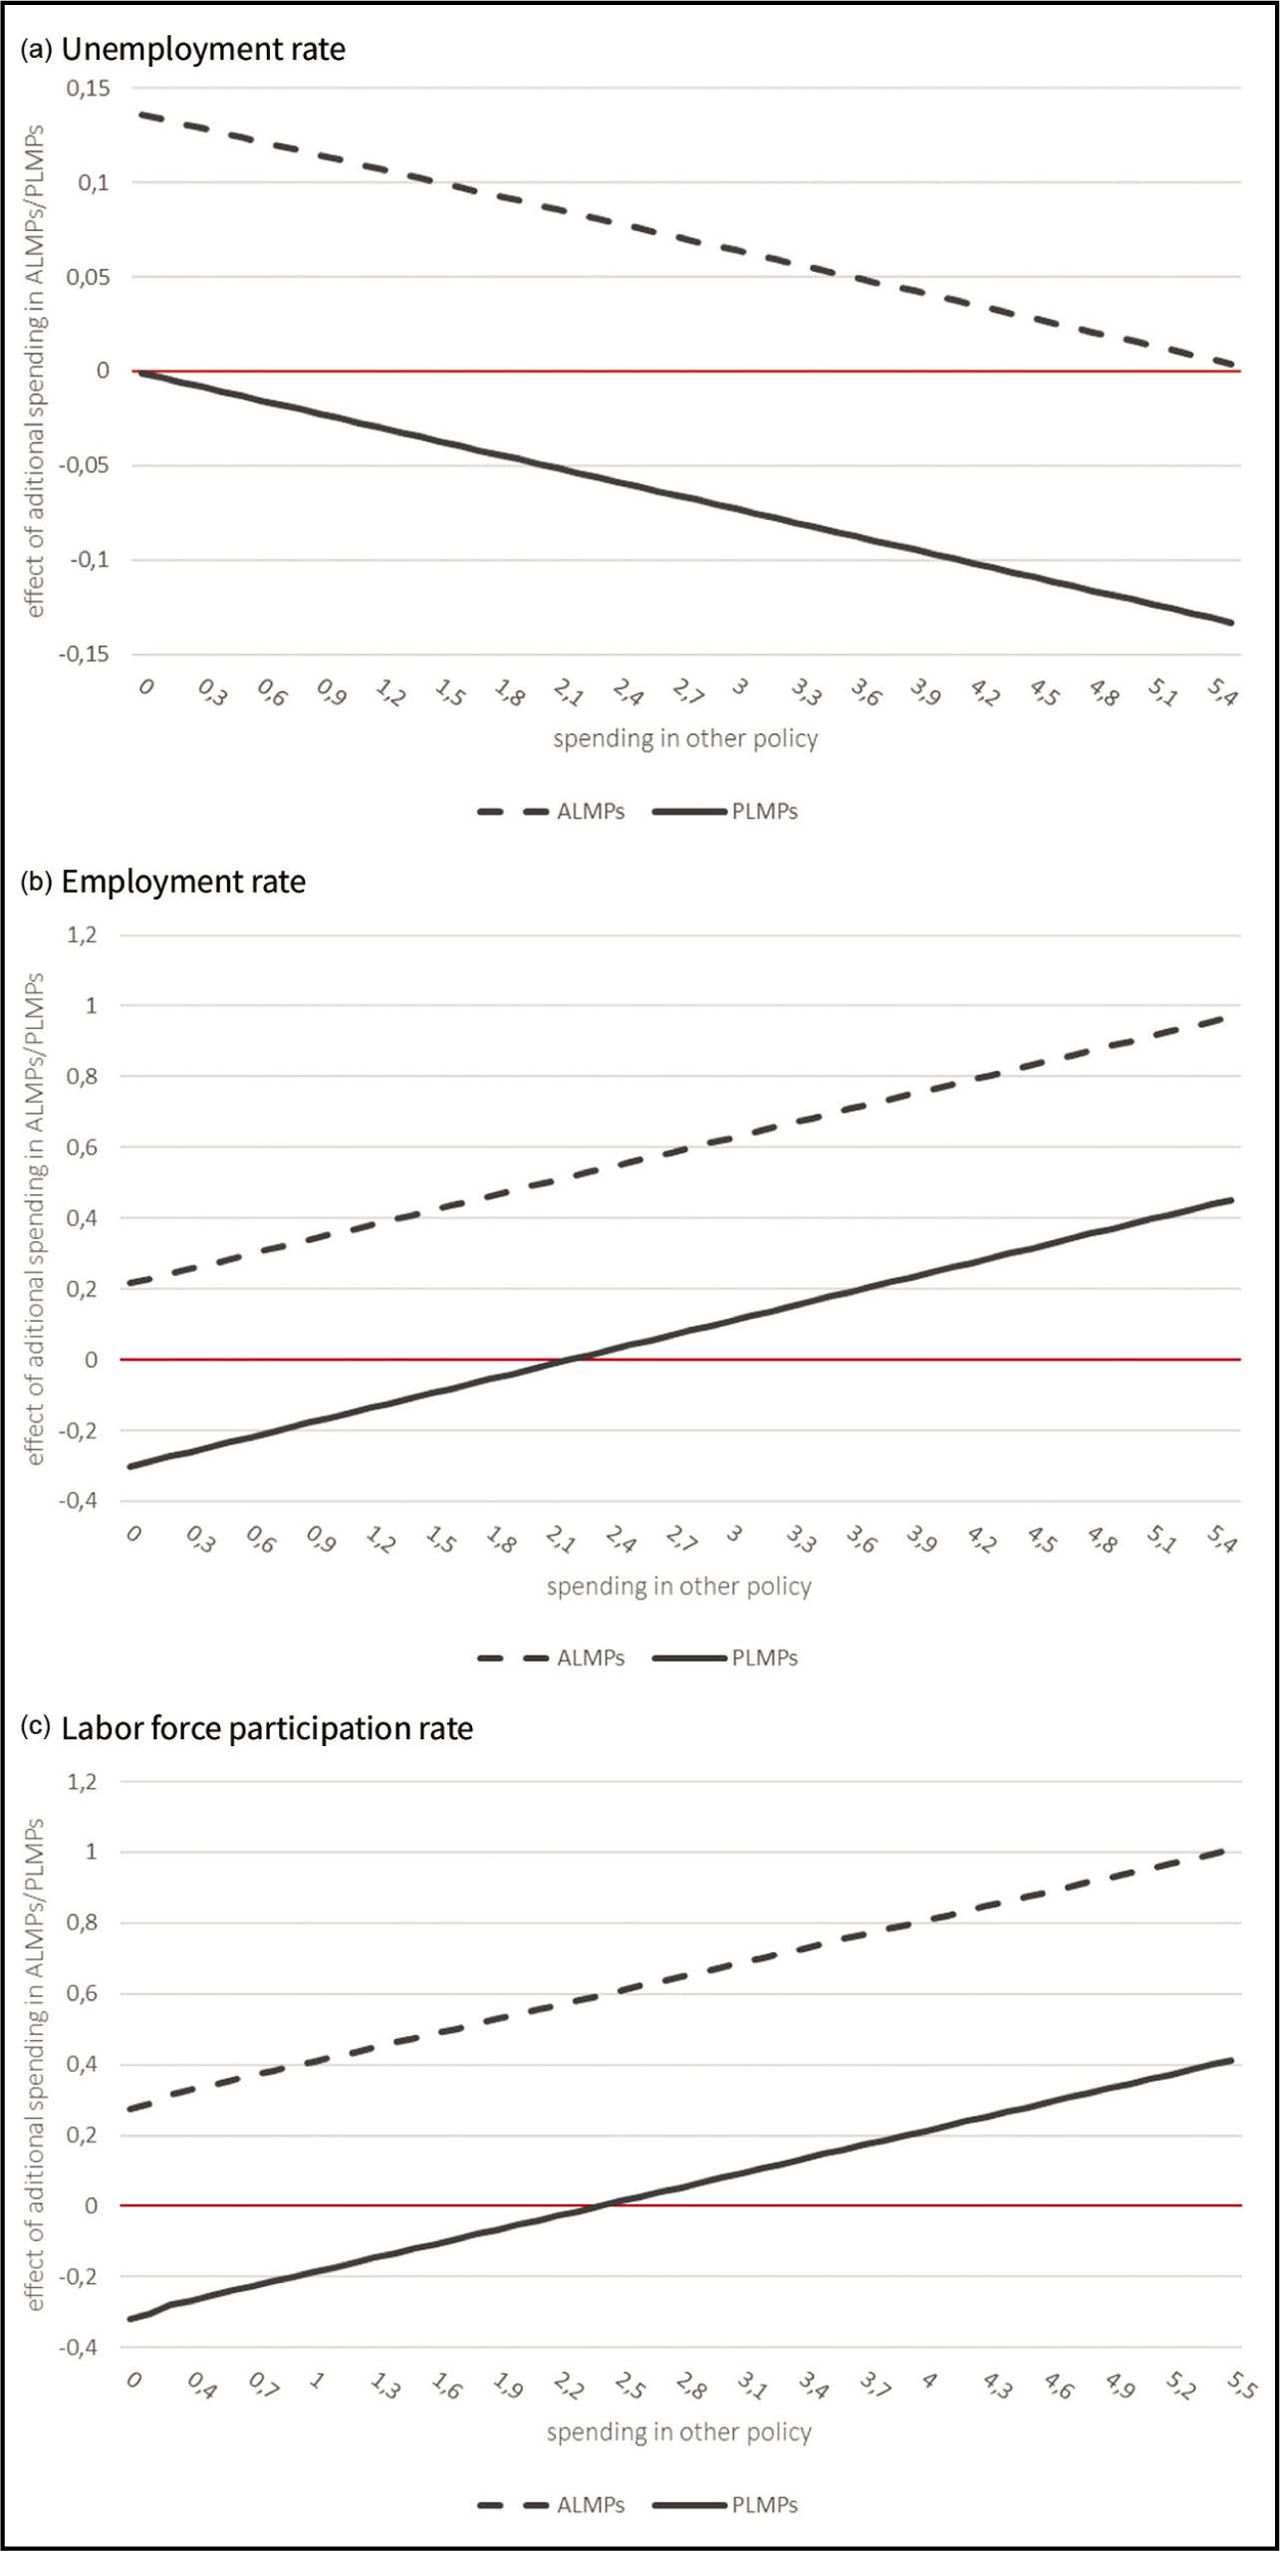
Figure 4
The effect of one additional unit spending on ALMPs (PLMPs) given spending on PLMPs in developed economies.
Note: The presented statistics are coefficient estimates for the panel mode outlined in Section 5. ALMPs, active labor market policies; PLMPs, passive labor market policies.
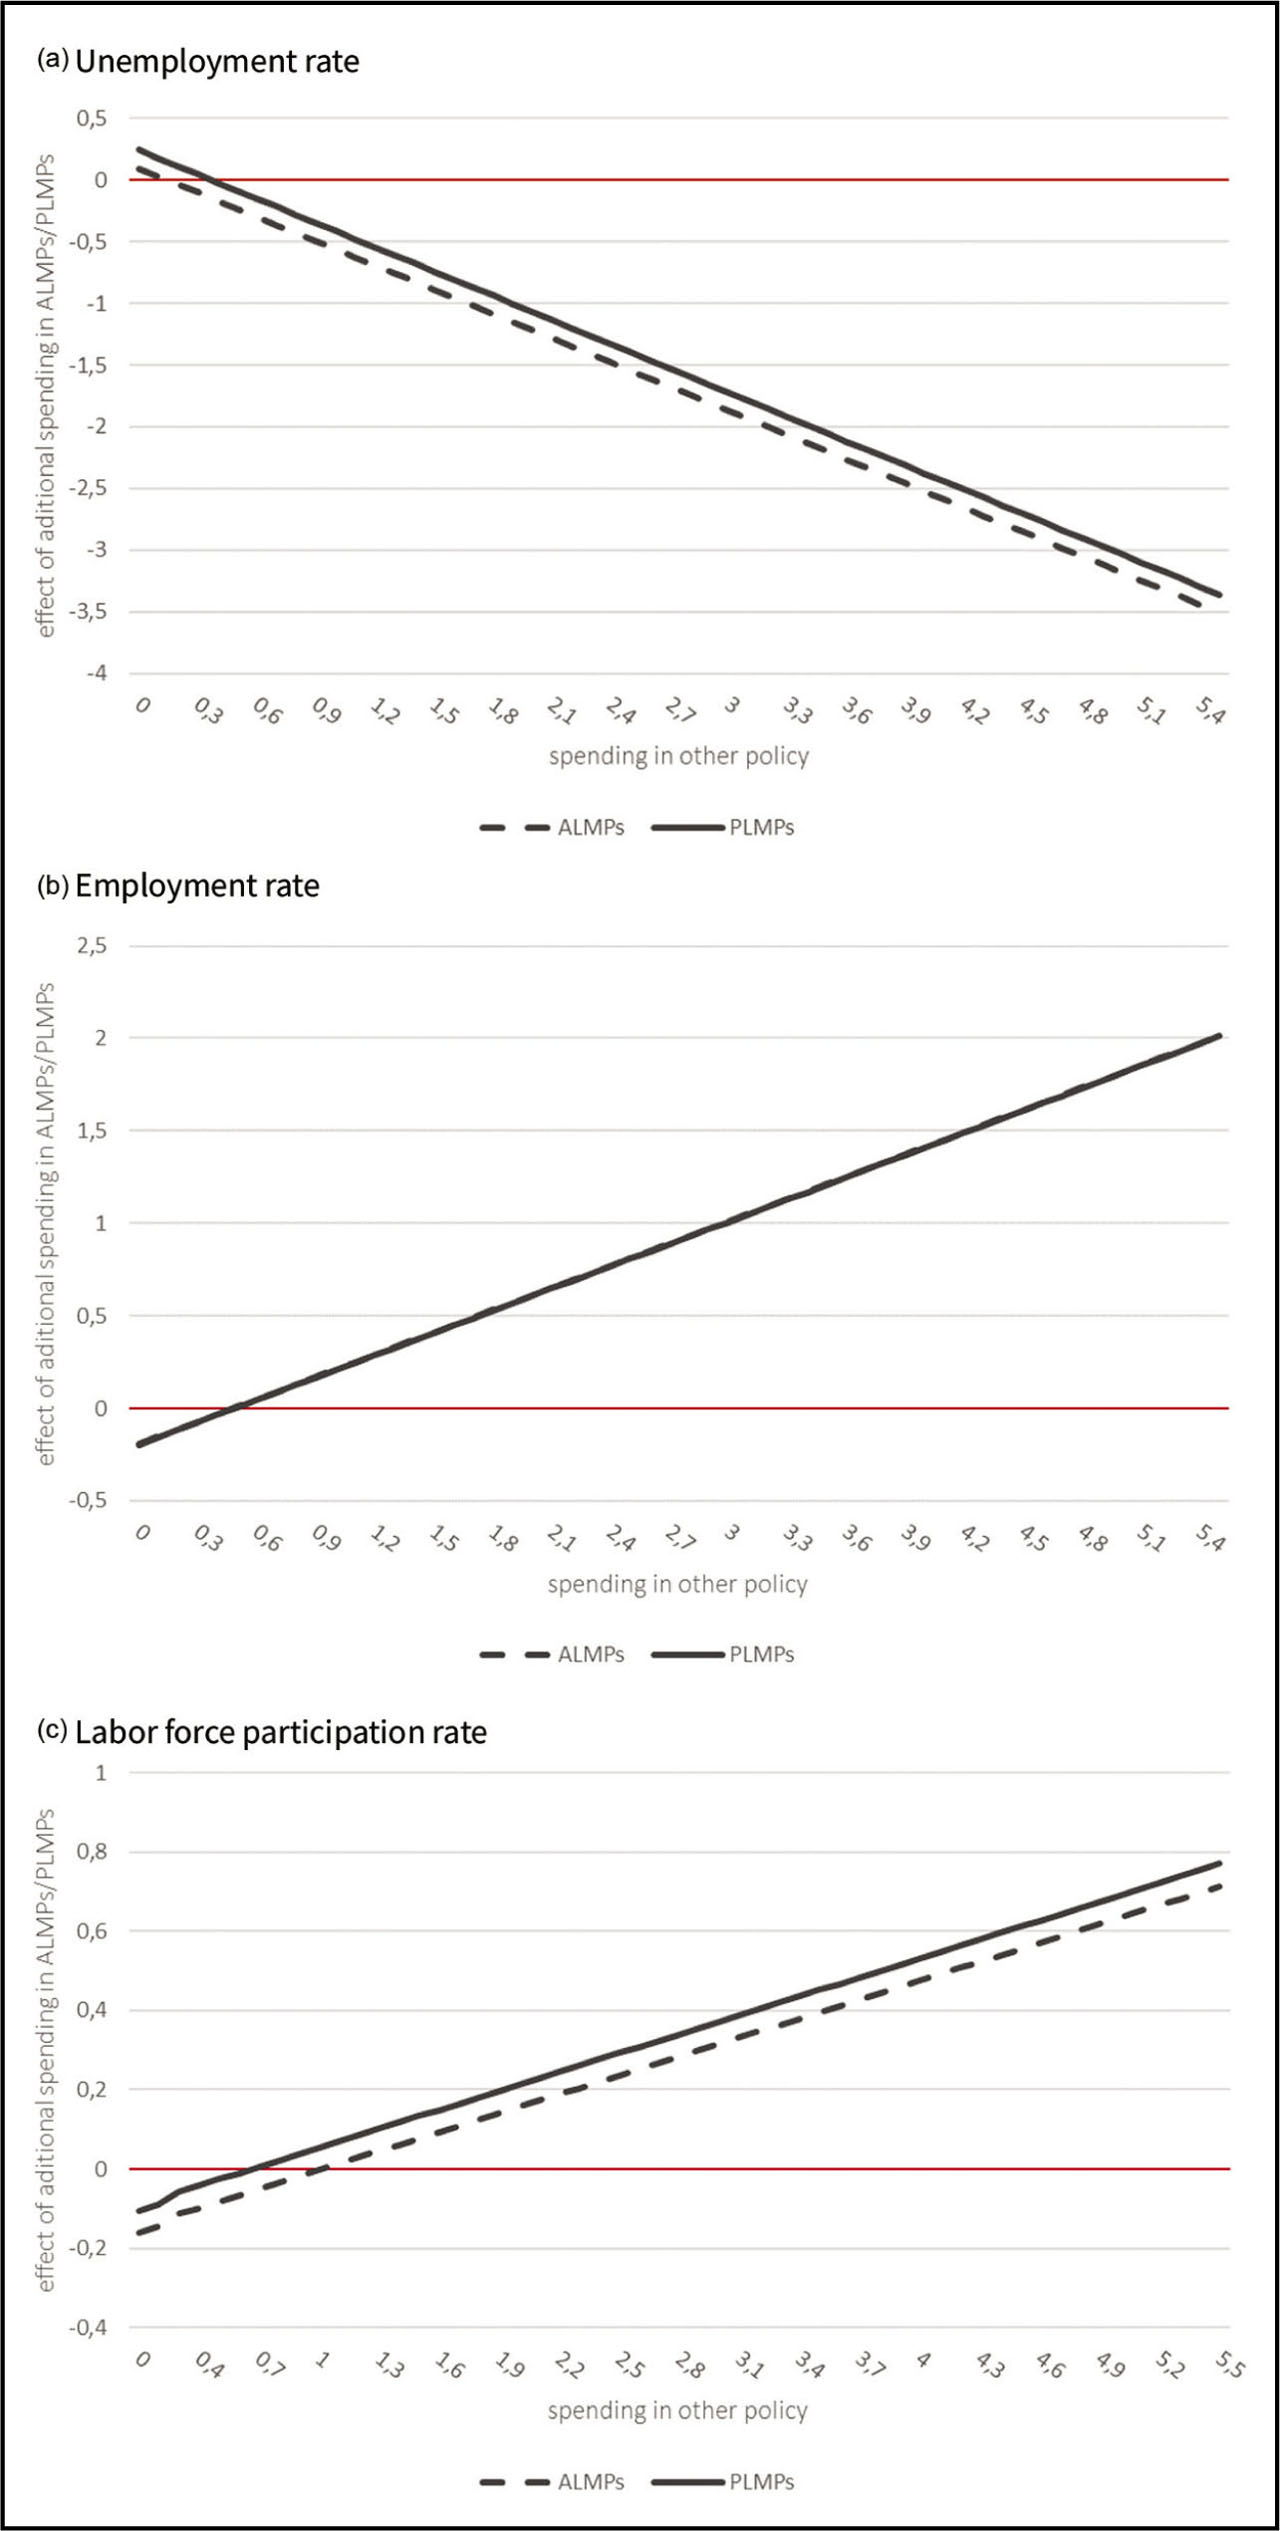
Figure 5
The effect of one additional unit spending on ALMPs (PLMPs) given spending on PLMPs in emerging and developing economies.
Note: The presented statistics are coefficient estimates for the panel mode outlined in Section 5. The two lines in Panel B almost perfectly overlap. ALMPs, active labor market policies; PLMPs, passive labor market policies.
Table A1
Data availability on spending in active and passive labor market policies
| Country | Time period covered | Source | Country | Time period covered | Source | Country | Time period covered | Source |
|---|---|---|---|---|---|---|---|---|
| Afghanistan | 2008–2010 | ADB | Greece | 1985–2010/2013–2015 | OECD | Panama | 2007–2014 | ASPIRE |
| Albania | 2000–2013 | ASPIRE | Guatemala | 2004–2013 | ASPIRE | Papua New Guinea | 2008–2015 | ADB |
| Argentina | 2000–2015 | ASPIRE | Honduras | 2003–2014 | ASPIRE | Peru | 2000–2015 | ASPIRE |
| Armenia | 2008–2015 | ADB | Hungary | 1992–2016 | OECD | Philippines | 2008–2015 | ADB |
| Australia | 1985–2016 | OECD | India | 2008–2013 | ADB | Poland | 1991–2016 | OECD |
| Austria | 1985–2016 | OECD | Indonesia | 2009–2014 | ADB | Portugal | 1985–2016 | OECD |
| Azerbaijan | 2008–2015 | ADB | Ireland | 1985–2016 | OECD | Romania | 2005–2016 | Eurostat |
| Bangladesh | 2008–2015 | ADB | Israel | 2004–2016 | OECD | Rwanda | 2004–2011/2014–2015 | ASPIRE |
| Belgium | 1985–2016 | OECD | Italy | 1990–2016 | OECD | Saint Lucia | 2000–2013 | ASPIRE |
| Benin | 2005–2014 | ASPIRE | Japan | 1985–2016 | OECD | Sao Tome and Principe | 2013–2014 | ASPIRE |
| Bhutan | 2011–2015 | ADB | Kazakhstan | 2005–2014 | ASPIRE | Senegal | 2005–2015 | ASPIRE |
| Bolivia | 2008–2015 | ASPIRE | Kenya | 2005–2016 | ASPIRE | Serbia | 2000–2013 | ASPIRE |
| Botswana | 2004–2010 | ASPIRE | Korea | 2000–2016 | OECD | Sierra Leone | 2010–2011 | ASPIRE |
| Brazil | 2000–2015 | ASPIRE | Kyrgyzstan | 2008–2015 | ADB | Slovak Republic | 1991–2016 | OECD |
| Bulgaria | 2004–2016 | Eurostat | Laos | 2008–2015 | ADB | Slovenia | 2003–2016 | OECD |
| Burkina Faso | 2005–2016 | ASPIRE | Latvia | 2003–2016 | OECD | Solomon Islands | 2008–2015 | ADB |
| Burundi | 2010–2013 | ASPIRE | Lebanon | 2009–2010 | ASPIRE | South Africa | 2009–2012 | ASPIRE |
| Cambodia | 2008–2015 | ADB | Liberia | 2008–2014 | ASPIRE | South Sudan | 2011–2012 | ASPIRE |
| Cameroon | 2011–2017 | ASPIRE | Lithuania | 2003–2016 | OECD | Spain | 1985–2015 | OECD |
| Canada | 1985–2016 | OECD | Luxemburg | 1985–2016 | OECD | Sri Lanka | 2008–2015 | ADB |
| Central African Republic | 2009–2010/2014–2015 | ASPIRE | Macedonia | 2000–2014 | ASPIRE | Swaziland | 2006–2010 | ASPIRE |
| Chile | 2004–2016 | OECD | Malawi | 2008–2016 | ASPIRE | Sweden | 1985–2016 | OECD |
| China | 2008–2015 | ADB | Malaysia | 2008–2013 | ADB | Switzerland | 1985–2016 | OECD |
| Colombia | 2000–2015 | ASPIRE | Maldives | 2008–2011 | ADB | Tajikistan | 2008–2015 | ADB |
| Congo | 2014–2016 | ASPIRE | Mali | 2011–2016 | ASPIRE | Tanzania | 2014–2016 | ASPIRE |
| Costa Rica | 2007–2012 | ASPIRE | Malta | 2006–2016 | Eurostat | Thailand | 2008–2015 | ADB |
| Croatia | 2012–2016 | Eurostat | Mauritius | 2005–2009 | ASPIRE | Timor-Leste | 2008–2014 | ADB |
| Cyprus | 2006–2016 | Eurostat | Mexico | 1998–2016 | OECD | Togo | 2011–2012 | ASPIRE |
| Czech Republic | 1991–2016 | OECD | Moldova | 2000–2014 | ASPIRE | Tunisia | 2000–2013 | ASPIRE |
| Denmark | 1986–2016 | OECD | Mongolia | 2008–2015 | ADB | Turkey | 2005–2013 | ASPIRE |
| Djibouti | 2014–2015 | ASPIRE | Montenegro | 2000–2013 | ASPIRE | Uganda | 2009–2016 | ASPIRE |
| Dominican Republic | 2010–2012 | ASPIRE | Morocco | 2007–2014 | ASPIRE | United Kingdom | 1985–2011 | OECD |
| Ecuador | 2000–2011 | ASPIRE | Mozambique | 2012–2015 | ASPIRE | United States | 1985–2016 | OECD |
| El Salvador | 2009–2014 | ASPIRE | Nepal | 2008–2015 | ADB | Uruguay | 2000–2015 | ASPIRE |
| Estonia | 2003–2016 | OECD | Netherlands | 1985–2016 | OECD | Uzbekistan | 2009–2015 | ADB |
| Ethiopia | 2009–2016 | ASPIRE | New Zealand | 1985–2016 | OECD | Vanuatu | 2008–2015 | ADB |
| Fiji | 2008–2015 | ADB | Nicaragua | 2000–2013 | ASPIRE | Viet Nam | 2008–2015 | ADB |
| Finland | 1985–2016 | OECD | Niger | 2004–2017 | ASPIRE | Zambia | 2014–2016 | ASPIRE |
| France | 1985–2015 | OECD | Nigeria | 2009–2012 | ASPIRE | Zimbabwe | 2010–2015 | ASPIRE |
| Germany | 1985–2016 | OECD | Norway | 1985–2016 | OECD | |||
| Ghana | 2010–2016 | ASPIRE | Pakistan | 2008–2015 | ADB |
[i] Note: Data availability based on the data collection as discussed in Section 2. Where different sources overlap preference was given to OECD data. Countries in bold are emerging economies according to the World Bank classification.
[ii] iData are not equally available for active and passive policies.
[iii] iiNo data are available for spending in passive labor market policies.
[iv] iiiNo data are available for spending in active labor market policies.
[v] ADB, Asian Development Bank.